Economy & Innovationlatest year available
China Leads Global High-Technology Exports
China has the world’s largest high-technology exports for the latest year available, on $825.05 billion of exports, ahead of Hong Kong on 369.16.
The world’s ten largest high-technology exporters as a treemap, with the rest of the world beside them. Each country’s figure is its own most recent year, between 2022 and 2024.
Published Article last edited
These figures are for the latest year available, as they stood when this chart was published on . The chart is a snapshot and is never refreshed, so a newer edition may exist. What this site keeps current on the subject.
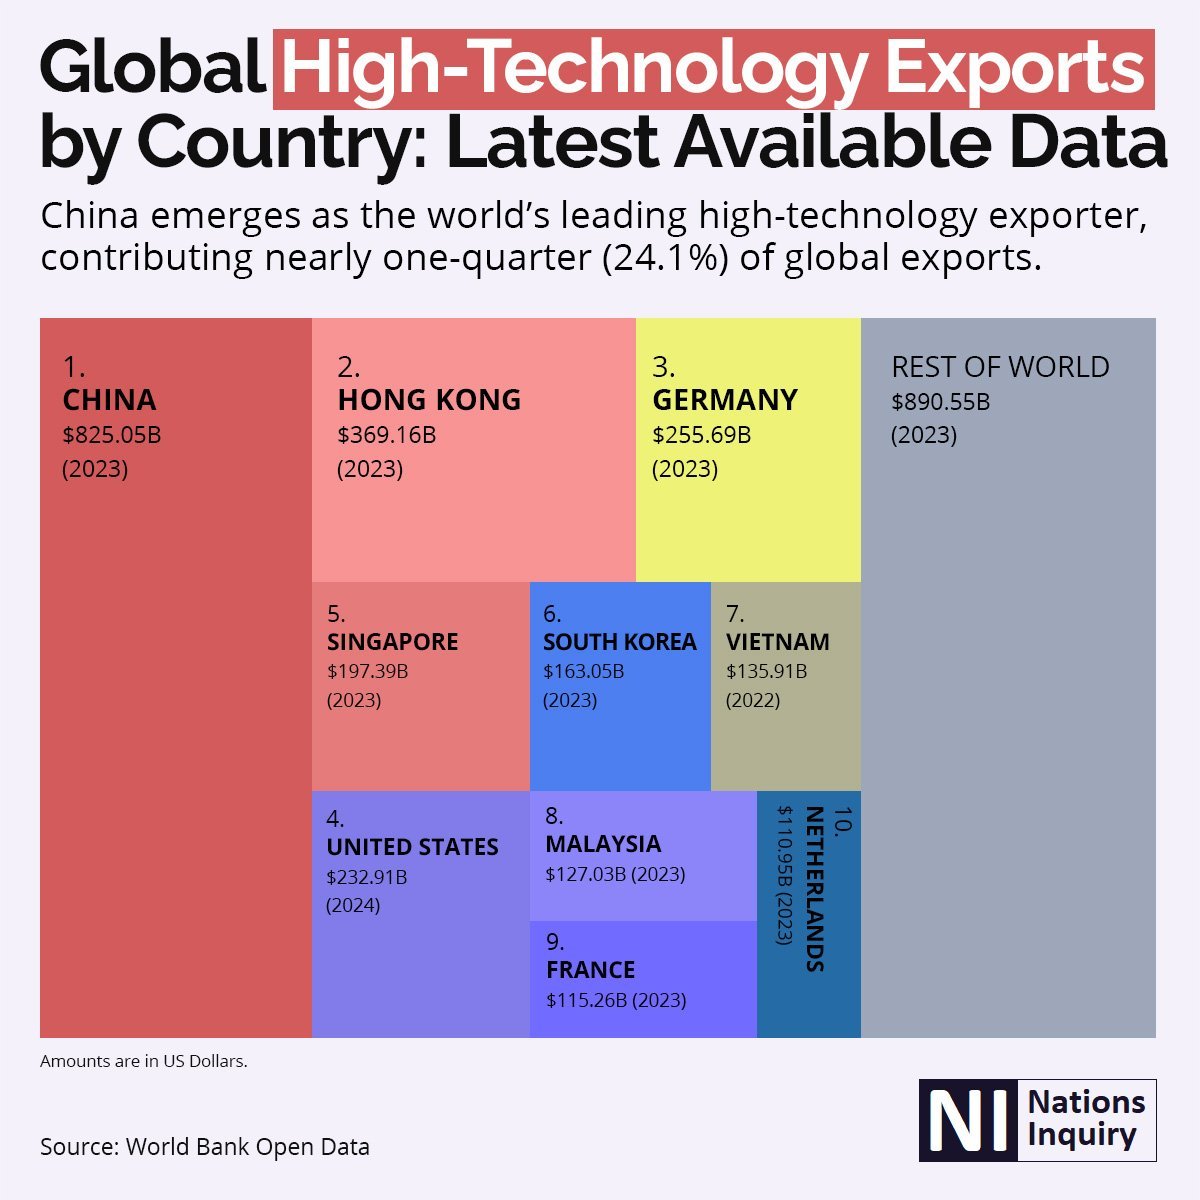
A treemap of the world’s ten largest high-technology exporters, each rectangle sized by the value of its exports. China’s block fills the left of the picture at $825.05 billion, followed by Hong Kong ($369.16bn), Germany ($255.69bn) and the United States ($232.91bn). A grey block on the right holds the rest of the world at $890.55 billion. Each country’s figure is its own most recent year, between 2022 and 2024.
01The figures
High-technology exports, latest year available
Every row the chart prints, as text rather than pixels — 10 of them, exactly as UN Comtrade (UN Statistics Division) published them. Country names link to their profiles.
Swipe the table sideways to see every column
- —Rest of the worldnot a country2023891








Amounts are in US dollars.
02Analysis
What the chart says
Rare earth minerals are China’s effective weapon
China has made its most powerful move in the trade war by controlling rare-earth minerals. These minerals are essential to achieving the highest Global High-Technology exports, including modern technology, military equipment, and clean energy. China controls 92% of the processing and 61% of the production of these minerals worldwide.
For example, elements such as neodymium and dysprosium are used in High-Technology electric vehicles, missile systems, and jet engines. China is nearly one-quarter (24.1%) of global High-Tech exports.
In 2025, China put the United States under severe pressure by imposing restrictions on the export of seven types of rare earth minerals, which pose serious threats to the US defense technology industries.
Technology Race, and Clean Energy Frontier
China has emerged as a global leader in clean energy. It is the world’s largest high-technology supplier of solar panels, electric vehicles, and batteries. US tariffs have forced China to expand its products into new markets such as Asia and Latin America.
On the other hand, the US is trying to maintain its dominance in the race for artificial intelligence and semiconductor chips by imposing sanctions on Chinese companies. China’s restrictions on related minerals such as yttrium are making the race even more complicated.
The recent conflict between the US and China on the trade front
The ongoing trade war between the US and China has taken on a new form. Where economic policies, technological supremacy, and control over natural resources are being used as weapons.
US tariffs
The tariffs imposed during the Trump administration have also caused serious economic damage to the US. According to research, rather than putting pressure on China, the tariffs have made American consumers and small businesses more vulnerable to inflation.
For example, in the import of solar panels, Chinese companies tried to avoid US sanctions by setting up production units in Southeast Asia, where the US could not achieve its goal.
Reshaping the global supply chain
The trade war has reshaped the global supply chain. Chinese companies are setting up production centers in countries such as Vietnam, Thailand, and Mexico to avoid US sanctions.
However, the US has introduced strict rules of origin to block these efforts. The conflict is not only affecting industrial policies but also risking environmental goals, as obstacles to China’s clean energy development could increase global carbon emissions.
Redefining power
The trade war is no longer limited to products, but is highlighting new forms of power. China is challenging the global system through its industrial capacity, mineral resources, technology, and financial strategy.
While the US is busy trying to maintain its dominance through technology and military power.
The race for cutting-edge technology: Competition between China and the US inthe artificial intelligence and electric vehicle industries has intensified.
Abstract
Trade wars have not only slowed economic growth, but they are also deepening geopolitical divisions. Its long-term effects include increased global poverty, unilateral technological dominance, and weakened international institutions.
In the future, the world needs to strengthen regional trade agreements on a fair basis and make radical changes to the basic structure of the WTO and other institutions.
03Sources
Where these figures come from
Source
High-technology exports in the World Bank’s World Development Indicators — UN Comtrade (UN Statistics Division)
Official statistical agency
The figures are for the latest year available, read on . This page reproduces only the 11 rows the chart itself shows, not the publisher’s full table.
How this site reads a chart — what is stored as published, whose rank is whose, when a country is named at an end, and why a chart is never refreshed.
Cite this page
“China Leads Global High-Technology Exports”, Nations Inquiry, 2025. https://nationsinquiry.com/charts/china-leads-global-high-technology-exports
Published · article last edited · Found an error?
04More charts


