Topic 02 of 18 · Country Index 2026
Economy & Innovation
What does an economy do for the people inside it?
Austria is placed first of 176 countries on economy & innovation in the Country Index 2026, and Somalia 176th. The standing rests on 4 key statistics; the other 40 on this page are published as context, with no vote.
02
4 key statistics
01Country Index 2026
Who leads on economy & innovation
The three countries placed highest of 176, the three placed lowest, and the country placed highest on each continent. Each position is a place in this topic’s own list, built from its key statistics.
 1
1 Austria
Western Europe
1st of 176 · 4 of 4 keys
Photo: chensiyuan · CC BY-SA 4.0, greyscale
 2
2 Japan
JapanEastern Asia
2nd of 176 · 4 of 4 keys
Photo: JurriaanH · CC BY-SA 3.0, greyscale
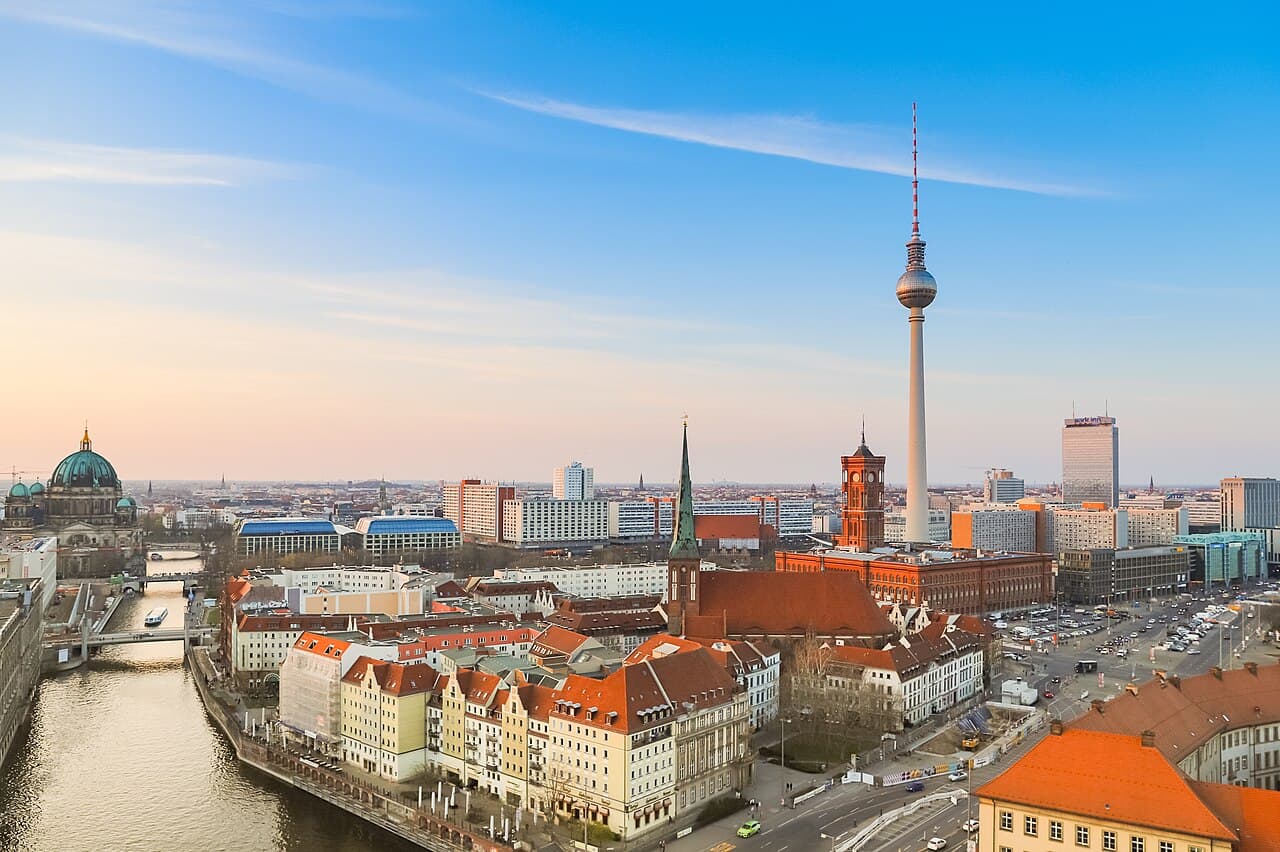 3
3 Germany
Western Europe
3rd of 176 · 4 of 4 keys
Placed lowest on Economy & Innovation
Positions out of 176. A standing is relative: it says where a country places against the others measured, not that it scored zero.
Placed first on each continent · position among all 176
02The subject
About economy & innovation
What an economy pays, produces and moves. Take-home wages, output per person, the capacity to generate and commercialise new ideas, how efficiently goods cross borders, how many adults hold a bank account, and how much of the workforce the economy actually lets participate. Note that the SIZE of an economy is deliberately absent: GDP appears here only per person, because what matters is what an economy does for the people inside it, not how large it is in total.
An economy is measured here by what it produces for each person who lives in it, what it knows how to make, and whether ordinary adults can take part in it at all. Output per person is the familiar starting point; the capability to make complex, rarely made goods says something output alone cannot, because it is the base future income grows from.
Inclusion is the third leg, for households and for firms. An economy can be rich on average while a large share of adults hold no bank account and many businesses cannot borrow from any bank, and that exclusion shapes what the average can do for them.
What this topic does not measure
The total size of an economy is deliberately left out: a very large economy spread over a very large population is not doing more for each person. Growth rates, trade shares and the structure of output (how much is farming, industry or services) are published here as context, because they describe an economy's shape rather than how well it serves people. Jobs and wages have their own topic, Work & Labour.
03The evidence
The 4 statistics that decide it
These are the only statistics that place countries on economy & innovation — one vote each. Every number is somebody else’s research, reproduced without adjustment; the ordering on top is this site’s.
Key 1 of 4
GDP per Capita (PPP)
World Bank Group
Why it is a key: Output per person: the standard measure of an economy's size set against the population it has to support.
- Edition used
- 2025data for 2025
- Countries
- 185
- Publisher’s rank
- None — values only
- Licence
- CC BY 4.0
Every country, every editionCurrent leader, 2025 edition
 Singapore
Key 2 of 4
Firms with a Bank Loan or Line of Credit
World Bank Group
Why it is a key: Whether businesses can borrow from the formal financial system — the firm-level counterpart to adults holding a bank account.
- Edition used
- 2025data for 2025
- Countries
- 170
- Publisher’s rank
- None — values only
- Licence
- CC BY 4.0
Every country, every editionCurrent leader, 2025 edition
 Israel
Key 3 of 4
Economic Complexity Index
Growth Lab at Harvard University
Why it is a key: What an economy knows how to make, read from the diversity and rarity of what it exports.
- Edition used
- 2024data for 2024
- Countries
- 145
- Publisher’s rank
- Published
- Licence
- CC0 1.0
Every country, every editionCurrent leader, 2024 edition
JapanKey 4 of 4
Account Ownership at a Financial Institution
World Bank Group
Why it is a key: Whether ordinary adults are inside the financial system at all, which output per person does not reveal.
- Edition used
- 2024data for 2024
- Countries
- 139
- Publisher’s rank
- None — values only
- Licence
- CC BY 4.0
Every country, every editionCurrent leader, 2024 edition
 Iceland
How the keys combine
Each country’s value on each key becomes its place in that key’s own field, as a share of the field. The shares are averaged, one vote per key, and only the order that produces is published.
The method in full
04Every placed country
Economy & Innovation on a map
Darker is placed higher. Hover a country for its position, or select it to open its page. Below the map, each continent’s median position — half its placed countries sit at or above it, so lower is better.
1st of 5 continents
Europe
24th
median position, of 176 · 40 of its 49 countries placed
Highest
Austria2nd of 5 continents
Americas
77th
median position, of 176 · 30 of its 48 countries placed
Highest
 Canada
3rd of 5 continents
Asia
86th
median position, of 176 · 45 of its 52 countries placed
Highest
Japan4th of 5 continents
Oceania
125th
median position, of 176 · 9 of its 21 countries placed
Highest
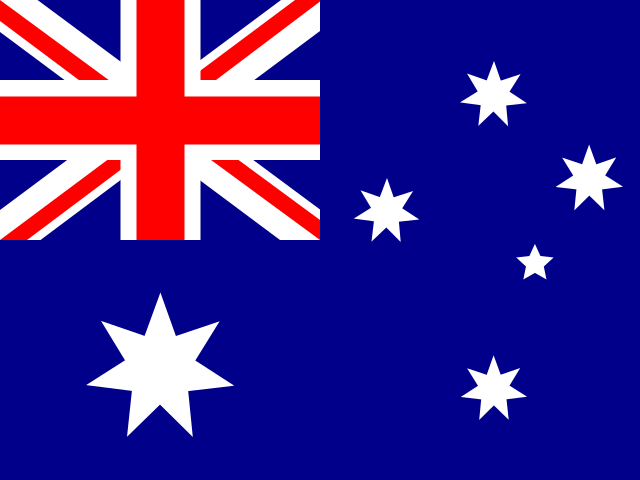 Australia
5th of 5 continents
Africa
140th
median position, of 176 · 52 of its 55 countries placed
Highest
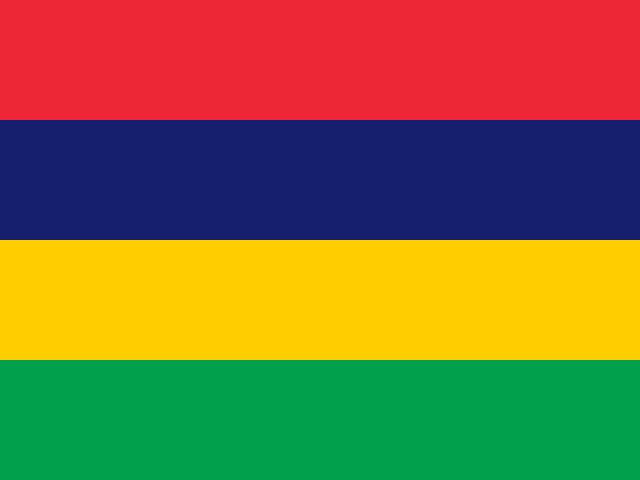 Mauritius
- Every region
All 21 sub-regions on Economy & Innovation, best median first
- 1Western Europemedian 8thfrom 7 of 9Austria1
- 2Northern Europemedian 17thfrom 10 of 13Iceland4
- 3Northern Americamedian 18thfrom 2 of 4Canada18
- 4Australia and New Zealandmedian 27thfrom 2 of 2Australia27
- 5Eastern Asiamedian 37thfrom 5 of 8Japan2
- 6Southern Europemedian 42ndfrom 13 of 17
 Slovenia11
 - 7Eastern Europemedian 45thfrom 10 of 10
 Slovakia22
 - 8Central Americamedian 76thfrom 8 of 8
 Costa Rica=57
 - 9South Americamedian 77thfrom 11 of 12
 Chile41
 - 10Caribbeanmedian 80thfrom 9 of 24
 Saint Lucia34
 - 11Western Asiamedian 84thfrom 15 of 19Israel13
- 12Southern Asiamedian 88thfrom 9 of 9
 Bhutan68
 - 13Polynesiamedian 91stfrom 2 of 7
 Samoa91
 - 14Southern Africamedian 105thfrom 5 of 5
 Namibia100
 - 15South-eastern Asiamedian 107thfrom 11 of 11Singapore=24
- 16Central Asiamedian 118thfrom 5 of 5
 Kazakhstan65
 - 17Melanesiamedian 125thfrom 4 of 5
 Fiji56
 - 18Northern Africamedian 128thfrom 6 of 6
 Tunisia103
 - 19Eastern Africamedian 140thfrom 16 of 19Mauritius36
- 20Western Africamedian 144thfrom 16 of 16
 Togo114
 - 21Middle Africamedian 149thfrom 9 of 9
 Gabon=110
05The whole field
Where all 176 countries stand
In order, best first. A row resting on fewer keys rests on less evidence: a country needs 2 of the 4 to be placed at all. “=” marks a position shared with another country. Select a country to see the working behind its standing.
Showing 25 of 176 countries placed on Economy & Innovation
- 1 of 176AustriaWestern Europe4/4
- 2 of 176JapanEastern Asia4/4
- 3 of 176GermanyWestern Europe4/4
- 4 of 176IcelandNorthern Europe3/4
- 5 of 176
 FinlandNorthern Europe4/4
 - 6 of 176
 DenmarkNorthern Europe4/4
 - 7 of 176
 FranceWestern Europe4/4
 - 8 of 176
 NetherlandsWestern Europe4/4
 - 9 of 176
 BelgiumWestern Europe4/4
 - 10 of 176
 SwitzerlandWestern Europe4/4
 - 11 of 176SloveniaSouthern Europe4/4
- 12 of 176
 LuxembourgWestern Europe2/4
 - 13 of 176IsraelWestern Asia4/4
- 14 of 176
 NorwayNorthern Europe4/4
 - 15 of 176
 South KoreaEastern Asia4/4
 - 16 of 176
 SpainSouthern Europe4/4
 - 17 of 176
 SwedenNorthern Europe4/4
 - 18 of 176CanadaNorthern America4/4
- 19 of 176
 IrelandNorthern Europe4/4
 - 20 of 176
 ItalySouthern Europe4/4
 - 21 of 176
 LithuaniaNorthern Europe4/4
 - 22 of 176SlovakiaEastern Europe4/4
- 23 of 176
 HungaryEastern Europe4/4
 - =24 of 176
 CzechiaEastern Europe4/4
 - =24 of 176SingaporeSouth-eastern Asia4/4
- 26 of 176
 United KingdomNorthern Europe4/4
 - 27 of 176AustraliaAustralia and New Zealand4/4
- 28 of 176
 United StatesNorthern America4/4
 - 29 of 176
 New ZealandAustralia and New Zealand4/4
 - 30 of 176
 MaltaSouthern Europe3/4
 - 31 of 176
 CyprusWestern Asia4/4
 - 32 of 176
 PortugalSouthern Europe4/4
 - 33 of 176
 EstoniaNorthern Europe4/4
 - 34 of 176Saint LuciaCaribbean2/4
- 35 of 176
 CroatiaSouthern Europe4/4
 - 36 of 176MauritiusEastern Africa4/4
- 37 of 176
 Hong KongEastern Asia4/4
 - 38 of 176
 ThailandSouth-eastern Asia4/4
 - 39 of 176
 LatviaNorthern Europe4/4
 - 40 of 176
 MalaysiaSouth-eastern Asia4/4
 - 41 of 176ChileSouth America4/4
- 42 of 176
 SerbiaSouthern Europe4/4
 - 43 of 176
 RomaniaEastern Europe4/4
 - 44 of 176
 BruneiSouth-eastern Asia2/4
 - 45 of 176
 PolandEastern Europe4/4
 - =46 of 176
 BrazilSouth America4/4
 - =46 of 176
 ChinaEastern Asia4/4
 - 48 of 176
 GreeceSouthern Europe4/4
 - =49 of 176
 BelarusEastern Europe3/4
 - =49 of 176
 SeychellesEastern Africa2/4
 - 51 of 176
 UruguaySouth America4/4
 - 52 of 176
 North MacedoniaSouthern Europe4/4
 - 53 of 176
 BahrainWestern Asia4/4
 - 54 of 176
 GeorgiaWestern Asia4/4
 - 55 of 176
 BulgariaEastern Europe4/4
 - 56 of 176FijiMelanesia2/4
- =57 of 176
 ArmeniaWestern Asia4/4
 - =57 of 176Costa RicaCentral America4/4
- 59 of 176
 MexicoCentral America4/4
 - 60 of 176
 KosovoSouthern Europe3/4
 - 61 of 176
 Bosnia and HerzegovinaSouthern Europe4/4
 - 62 of 176
 MontenegroSouthern Europe3/4
 - 63 of 176
 PanamaCentral America4/4
 - 64 of 176
 TürkiyeWestern Asia4/4
 - 65 of 176KazakhstanCentral Asia4/4
- 66 of 176
 RussiaEastern Europe4/4
 - 67 of 176
 Dominican RepublicCaribbean4/4
 - 68 of 176BhutanSouthern Asia2/4
- 69 of 176
 Saudi ArabiaWestern Asia4/4
 - 70 of 176
 MongoliaEastern Asia4/4
 - 71 of 176
 ArgentinaSouth America4/4
 - 72 of 176
 Antigua and BarbudaCaribbean2/4
 - =73 of 176
 IranSouthern Asia3/4
 - =73 of 176
 VietnamSouth-eastern Asia4/4
 - 75 of 176
 ParaguaySouth America4/4
 - 76 of 176
 BelizeCentral America3/4
 - =77 of 176
 ColombiaSouth America4/4
 - =77 of 176
 GrenadaCaribbean2/4
 - 79 of 176
 MaldivesSouthern Asia2/4
 - =80 of 176
 PeruSouth America4/4
 - =80 of 176
 Trinidad and TobagoCaribbean4/4
 - 82 of 176
 KenyaEastern Africa4/4
 - 83 of 176
 UkraineEastern Europe4/4
 - 84 of 176
 QatarWestern Asia3/4
 - 85 of 176
 Saint Vincent and the GrenadinesCaribbean2/4
 - 86 of 176
 IndiaSouthern Asia4/4
 - 87 of 176
 KuwaitWestern Asia4/4
 - =88 of 176
 El SalvadorCentral America4/4
 - =88 of 176
 Sri LankaSouthern Asia4/4
 - 90 of 176
 EcuadorSouth America4/4
 - 91 of 176SamoaPolynesia2/4
- 92 of 176
 OmanWestern Asia3/4
 - 93 of 176
 JamaicaCaribbean3/4
 - 94 of 176
 SurinameSouth America2/4
 - 95 of 176
 GuatemalaCentral America4/4
 - 96 of 176
 BarbadosCaribbean2/4
 - 97 of 176
 NepalSouthern Asia4/4
 - 98 of 176
 MoldovaEastern Europe4/4
 - 99 of 176
 AzerbaijanWestern Asia4/4
 - 100 of 176NamibiaSouthern Africa4/4
- 101 of 176
 South AfricaSouthern Africa4/4
 - 102 of 176
 LebanonWestern Asia3/4
 - 103 of 176TunisiaNorthern Africa4/4
- 104 of 176
 JordanWestern Asia4/4
 - 105 of 176
 BotswanaSouthern Africa4/4
 - 106 of 176
 KyrgyzstanCentral Asia4/4
 - 107 of 176
 PhilippinesSouth-eastern Asia4/4
 - 108 of 176
 VenezuelaSouth America2/4
 - 109 of 176
 AlbaniaSouthern Europe4/4
 - =110 of 176GabonMiddle Africa4/4
- =110 of 176
 IndonesiaSouth-eastern Asia4/4
 - 112 of 176
 EswatiniSouthern Africa4/4
 - 113 of 176
 BoliviaSouth America4/4
 - 114 of 176TogoWestern Africa4/4
- 115 of 176
 HondurasCentral America4/4
 - 116 of 176
 CameroonMiddle Africa4/4
 - 117 of 176
 BangladeshSouthern Asia4/4
 - 118 of 176
 UzbekistanCentral Asia4/4
 - 119 of 176
 NicaraguaCentral America4/4
 - =120 of 176
 GhanaWestern Africa4/4
 - =120 of 176
 SenegalWestern Africa4/4
 - 122 of 176
 UgandaEastern Africa4/4
 - 123 of 176
 MoroccoNorthern Africa4/4
 - 124 of 176
 BeninWestern Africa4/4
 - =125 of 176
 RwandaEastern Africa3/4
 - =125 of 176
 Solomon IslandsMelanesia2/4
 - 127 of 176
 Côte d’IvoireWestern Africa4/4
 - 128 of 176
 EgyptNorthern Africa4/4
 - 129 of 176
 Cabo VerdeWestern Africa2/4
 - 130 of 176
 TurkmenistanCentral Asia3/4
 - 131 of 176
 AfghanistanSouthern Asia2/4
 - =132 of 176
 LesothoSouthern Africa3/4
 - =132 of 176
 VanuatuMelanesia2/4
 - 134 of 176
 ComorosEastern Africa3/4
 - 135 of 176
 DjiboutiEastern Africa2/4
 - 136 of 176
 NigeriaWestern Africa4/4
 - 137 of 176
 AlgeriaNorthern Africa3/4
 - =138 of 176
 CambodiaSouth-eastern Asia4/4
 - =138 of 176
 LaosSouth-eastern Asia4/4
 - 140 of 176
 ZambiaEastern Africa4/4
 - 141 of 176
 TanzaniaEastern Africa4/4
 - 142 of 176
 Republic of the CongoMiddle Africa4/4
 - 143 of 176
 ZimbabweEastern Africa4/4
 - 144 of 176
 LiberiaWestern Africa4/4
 - 145 of 176
 AngolaMiddle Africa3/4
 - 146 of 176
 TongaPolynesia2/4
 - 147 of 176
 Papua New GuineaMelanesia3/4
 - 148 of 176
 EthiopiaEastern Africa4/4
 - 149 of 176
 São Tomé and PríncipeMiddle Africa2/4
 - 150 of 176
 Burkina FasoWestern Africa4/4
 - =151 of 176
 HaitiCaribbean2/4
 - =151 of 176
 LibyaNorthern Africa3/4
 - 153 of 176
 Equatorial GuineaMiddle Africa3/4
 - 154 of 176
 TajikistanCentral Asia4/4
 - 155 of 176
 MyanmarSouth-eastern Asia3/4
 - 156 of 176
 PalestineWestern Asia3/4
 - 157 of 176
 BurundiEastern Africa2/4
 - 158 of 176
 MaliWestern Africa4/4
 - 159 of 176
 PakistanSouthern Asia4/4
 - 160 of 176
 MauritaniaWestern Africa4/4
 - 161 of 176
 MalawiEastern Africa4/4
 - 162 of 176
 KiribatiMicronesia2/4
 - 163 of 176
 Sierra LeoneWestern Africa3/4
 - 164 of 176
 IraqWestern Asia4/4
 - 165 of 176
 MozambiqueEastern Africa4/4
 - 166 of 176
 NigerWestern Africa4/4
 - 167 of 176
 Timor-LesteSouth-eastern Asia2/4
 - =168 of 176
 GambiaWestern Africa3/4
 - =168 of 176
 Guinea-BissauWestern Africa2/4
 - 170 of 176
 GuineaWestern Africa4/4
 - 171 of 176
 MadagascarEastern Africa4/4
 - 172 of 176
 DR CongoMiddle Africa4/4
 - 173 of 176
 SudanNorthern Africa2/4
 - 174 of 176
 Central African RepublicMiddle Africa2/4
 - 175 of 176
 ChadMiddle Africa4/4
 - 176 of 176
 SomaliaEastern Africa2/4
48 countries measured in the index but not placed on economy & innovation
Each holds readings on too few of this topic’s key statistics to be placed. Their profiles still show every reading the publishers give.
- American Samoa
- Andorra
- Anguilla
- Aruba
- Bahamas
- Bermuda
- British Virgin Islands
- Cayman Islands
- Channel Islands
- Cook Islands
- Cuba
- Curaçao
- Dominica
- Eritrea
- Faroe Islands
- French Polynesia
- Gibraltar
- Greenland
- Guam
- Guyana
- Isle of Man
- Liechtenstein
- Macau
- Marshall Islands
- Micronesia
- Monaco
- Montserrat
- Nauru
- New Caledonia
- Niue
- North Korea
- Northern Mariana Islands
- Palau
- Puerto Rico
- Saint Kitts and Nevis
- Saint Martin
- San Marino
- Sint Maarten
- Somaliland
- South Sudan
- Syria
- Taiwan
- Turks and Caicos Islands
- Tuvalu
- United Arab Emirates
- United States Virgin Islands
- Vatican City
- Yemen
06Beyond the headline
A different story
The countries placed furthest above and below their overall position in the Country Index 2026. Both positions are compared as a share of their own field, because 50th of 193 and 50th of 174 are not the same showing.
Placed higher on Economy & Innovation than overall
07In records
Economy in records
One country at the extreme of a statistic under this topic, read from its newest edition. Where countries tie at the top, no record is named.
Most complex economy
1.729
on the Economic Complexity Index
Highest GDP per person
139,593
international $ at purchasing power parity
Most innovative economy
65.96
on WIPO’s 0–100 Global Innovation Index
08Latest editions
Who rose and fell in the published ranks
The biggest moves between each report’s two newest editions, in the publisher’s own ranks — reports under this topic that print a rank. A report whose field changed by more than 5% is left out.
Ranks as published by Growth Lab at Harvard University in the Economic Complexity Index: reference years 2023 (145 countries ranked) → 2024 (145 ranked), both from its 2026 report.
Improved most
rank before → after- Togo125 → 103+22
- Haiti122 → 101+21
- Afghanistan127 → 108+19
Declined most
rank before → after- Gabon102 → 137−35
- Tajikistan107 → 129−22
- Bahrain43 → 64−21
Ranks as published by Oxford Insights in the Government AI Readiness Index: the 2024 edition (188 countries ranked) → the 2025 edition (195 ranked).
Improved most
rank before → after- Tanzania139 → 93+46
- Côte d’Ivoire140 → 95+45
- Nepal150 → 106+44
Declined most
rank before → after Saint Kitts and Nevis102 → 170−68
- Grenada121 → 176−55
 Marshall Islands123 → 177−54
Ranks as published by UN Trade and Development (UNCTAD) in the Liner Shipping Connectivity Index: the 2025 edition (168 countries ranked) → the 2026 edition (167 ranked).
Improved most
rank before → after Syria108 → 89+19
- Cabo Verde163 → 147+16
- Cambodia86 → 71+15
Ranks as published by World Intellectual Property Organization in the Global Innovation Index: the 2024 edition (133 countries ranked) → the 2025 edition (139 ranked).
Declined most
rank before → after- Bosnia and Herzegovina80 → 92−12
- Mongolia67 → 78−11
- Bolivia100 → 111−11
09Context, no vote
Also measured under economy & innovation
40 more statistics on the same subject, published in full and deliberately given no vote — keeping them out is what stops the standing drifting toward whichever kind of statistic was imported most. Select a row for its leader and trend.
Regulatory QualityWorld Bank Group · 209 countries · 2025World Bank Group2092025
Current leader:
SingaporeWorld Bank Group · 27 editions, data 1996–2025
Crop Production IndexFAO · 195 countries · 2022FAO1952022
Current leader:
SenegalFood and Agriculture Organization of the United Nations (FAO) · 62 editions, data 1961–2022
Food Production IndexFAO · 195 countries · 2022FAO1952022
Current leader:
SenegalFood and Agriculture Organization of the United Nations (FAO) · 62 editions, data 1961–2022
Government AI Readiness IndexOxford Insights · 195 countries · 2025Oxford Insights1952025
Current leader:
United StatesOxford Insights · 6 editions, data 2020–2025
Livestock Production IndexFAO · 194 countries · 2022FAO1942022
Current leader:
MalawiFood and Agriculture Organization of the United Nations (FAO) · 62 editions, data 1961–2022
GDP GrowthWorld Bank Group · 186 countries · 2025World Bank Group1862025
Current leader:
 Guyana
World Bank Group · 65 editions, data 1961–2025
Digitally-Deliverable Services ExportsUNCTAD · 170 countries · 2024UNCTAD1702024
Current leader:
IrelandUN Trade and Development (UNCTAD) · 15 editions, data 2010–2024
Liner Shipping Connectivity IndexUNCTAD · 167 countries · 2026UNCTAD1672026
Current leader:
ChinaUN Trade and Development (UNCTAD) · 21 editions, data 2006–2026
Researchers per Million InhabitantsUIS · 145 countries · 2024UIS1452024
Current leader:
 Liechtenstein
UNESCO Institute for Statistics (UIS) · 1 edition
Global Innovation IndexWorld Intellectual Property Organization · 139 countries · 2025World Intellectual Property Organization1392025
Current leader:
SwitzerlandWorld Intellectual Property Organization · 4 editions, data 2022–2025
Logistics Performance IndexWorld Bank Group · 139 countries · 2023World Bank Group1392023
Current leader:
SingaporeWorld Bank Group · 7 editions, data 2007–2023
World Energy Trilemma IndexWorld Energy Council · 126 countries · 2023World Energy Council1262023
ICT Goods ExportsUNCTAD · 120 countries · 2024UNCTAD1202024
Current leader:
Hong KongUN Trade and Development (UNCTAD) · 25 editions, data 2000–2024
Adjusted Net SavingsWorld Bank Group · 118 countries · 2021World Bank Group1182021
Current leader:
BangladeshWorld Bank Group · 32 editions, data 1990–2021
ICT Services ExportsUNCTAD · 118 countries · 2024UNCTAD1182024
Current leader:
IrelandUN Trade and Development (UNCTAD) · 20 editions, data 2005–2024
External Debt Stocks (% of GNI)World Bank Group · 110 countries · 2024World Bank Group1102024
Most affected:
MozambiqueWorld Bank Group · 44 editions, data 1981–2024
Debt Service on External DebtWorld Bank Group · 109 countries · 2024World Bank Group1092024
Most affected:
El SalvadorWorld Bank Group · 43 editions, data 1982–2024
GNI per Capita (PPP)World Bank Group · 102 countries · 2025World Bank Group1022025
Current leader:
SingaporeWorld Bank Group · 32 editions, data 1994–2025
Research and Development SpendingUIS · 84 countries · 2023UIS842023
Current leader:
IsraelUNESCO Institute for Statistics (UIS) · 28 editions, data 1996–2023
Gini IndexWorld Bank Group · 60 countries · 2023World Bank Group602023
Most affected:
ColombiaWorld Bank Group · 22 editions, data 2002–2023
Income Share Held by Lowest 20%World Bank Group · 60 countries · 2023World Bank Group602023
Current leader:
IndiaWorld Bank Group · 22 editions, data 2002–2023
Income Share Held by Richest 10%World Bank Group · 60 countries · 2023World Bank Group602023
Most affected:
ColombiaWorld Bank Group · 22 editions, data 2002–2023
Palma RatioWorld Bank Group · 60 countries · 2023World Bank Group602023
Most affected:
ColombiaWorld Bank Group · 22 editions, data 2002–2023
Business Ready: Operational EfficiencyWorld Bank Group · 50 countries · 2024World Bank Group502024
Business Ready: Public ServicesWorld Bank Group · 50 countries · 2024World Bank Group502024
Business Ready: Regulatory FrameworkWorld Bank Group · 50 countries · 2024World Bank Group502024
Describing the shape of a country (14)
These have no better end — more is not better or worse, only different — so they could not place countries even as keys.
Foreign Direct Investment InflowsUNCTAD · 202 countries · 2025UNCTAD2022025
Highest:
 British Virgin Islands
UN Trade and Development (UNCTAD) · 36 editions, data 1990–2025
Total Natural Resources Rents (% of GDP)World Bank Group · 197 countries · 2021World Bank Group1972021
Agriculture, Forestry and Fishing Value Added (% of GDP)World Bank Group · 158 countries · 2025World Bank Group1582025
Industry Value Added including Construction (% of GDP)World Bank Group · 158 countries · 2025World Bank Group1582025
Gross Savings (% of GDP)World Bank Group · 146 countries · 2024World Bank Group1462024
Tariff Rate, Applied, Weighted Mean, All ProductsWorld Bank Group · 143 countries · 2022World Bank Group1432022
Highest:
 Bermuda
World Bank Group · 24 editions, data 1999–2022
Exports of Goods and Services (% of GDP)World Bank Group · 138 countries · 2025World Bank Group1382025
Highest:
Hong KongWorld Bank Group · 56 editions, data 1970–2025
Imports of Goods and Services (% of GDP)World Bank Group · 138 countries · 2025World Bank Group1382025
Highest:
Hong KongWorld Bank Group · 56 editions, data 1970–2025
Trade (% of GDP)World Bank Group · 138 countries · 2025World Bank Group1382025
Highest:
Hong KongWorld Bank Group · 56 editions, data 1970–2025
General Government ConsumptionWorld Bank Group · 132 countries · 2025World Bank Group1322025
Highest:
UkraineWorld Bank Group · 56 editions, data 1970–2025
Manufacturing Value Added (% of GDP)World Bank Group · 132 countries · 2025World Bank Group1322025
Highest:
 Puerto Rico
World Bank Group · 49 editions, data 1977–2025
Gross Capital Formation (% of GDP)World Bank Group · 131 countries · 2025World Bank Group1312025
Highest:
AlgeriaWorld Bank Group · 56 editions, data 1970–2025
Household ConsumptionWorld Bank Group · 131 countries · 2025World Bank Group1312025
Highest:
SomaliaWorld Bank Group · 56 editions, data 1970–2025
Container Port TrafficUNCTAD · 103 countries · 2024UNCTAD1032024
Highest:
ChinaUN Trade and Development (UNCTAD) · 15 editions, data 2010–2024

10Analysis
Charts and analysis on economy & innovation
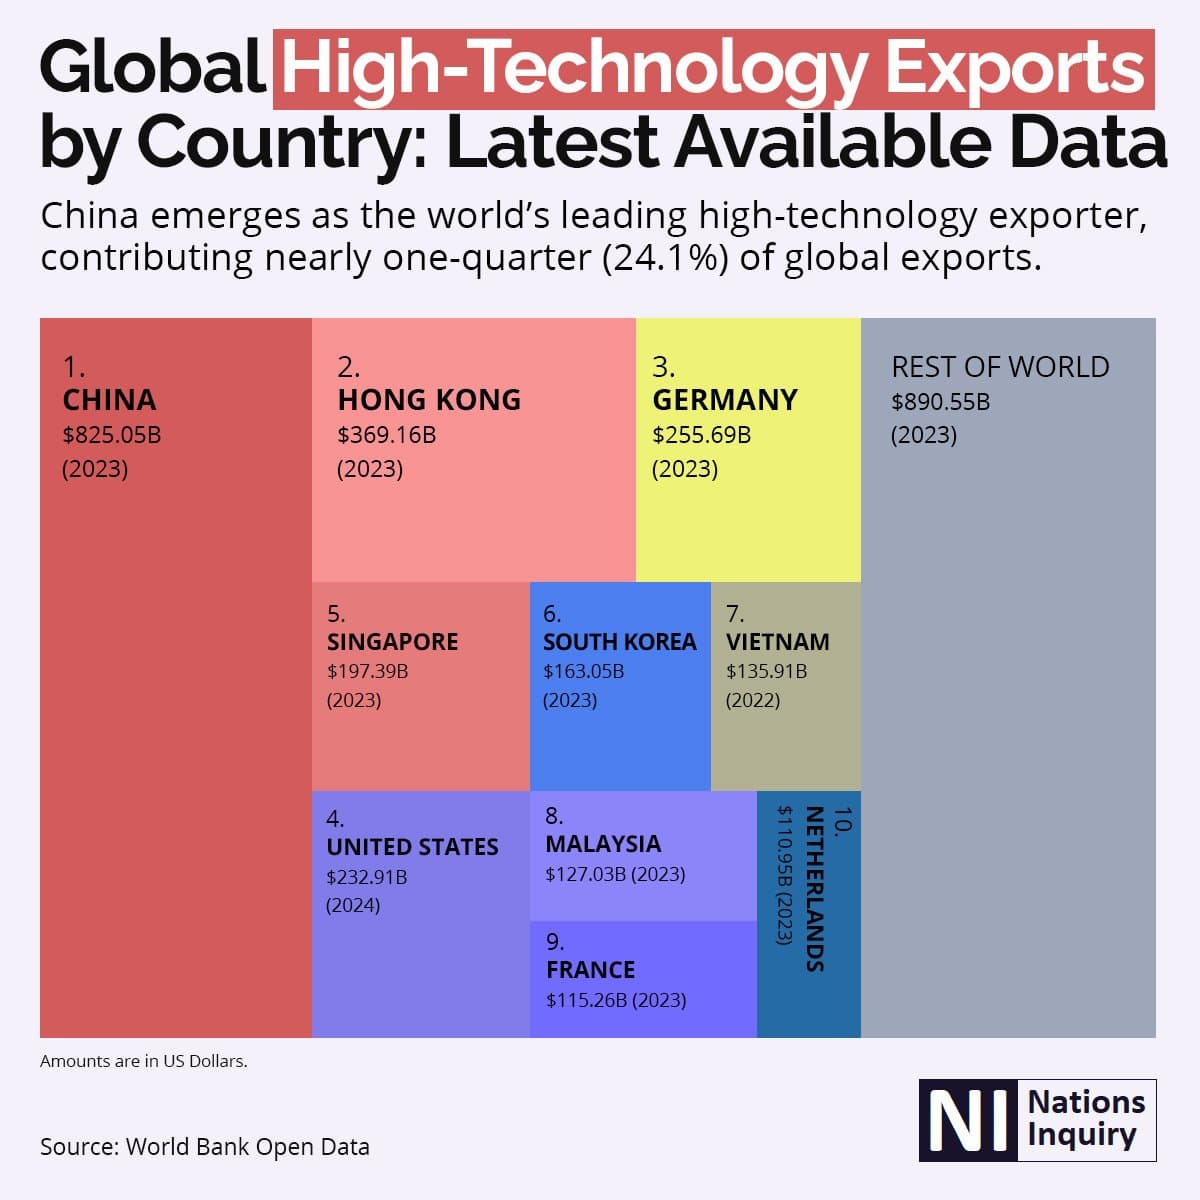
China Leads Global High-Technology Exports
The world’s ten largest high-technology exporters as a treemap, with the rest of the world beside them. Each country’s figure is its own most recent year, between 2022 and 2024.

India vs Pakistan 2025: Comparison of Hunger Index, Happiness, HDI, Rule of Law, Literacy & GDP
India and Pakistan on six published measures: hunger, happiness, human development, rule of law, literacy and GDP per capita. India is the better placed on five of them; Pakistan on one.

Countries in Asia with the highest average salaries 2024
Thirteen Asian countries by gross average monthly wage, each carrying its WORLD rank rather than an Asian one — so the numbers skip, from 11th place to 45th.
11Keep reading
Explore further
The most-read profiles, on Economy & Innovation
How Economy & Innovation relates to the other topics
- Moves most with: Development & Human CapitalCountries place very similarly on both. (0.90, 175 countries)
- Moves most with: Health & WellbeingCountries place very similarly on both. (0.87, 175 countries)
- Moves least with: Environment & SustainabilityCountries placed high on one tend to place low on the other. (-0.67, 170 countries)
Rank correlation of the two topics’ positions across the countries placed on both: 1 means the same order, 0 no link. Every pair of topics
The other topics
The full Country Index 2026- Governance & InstitutionsFirst: Denmark
- Work & LabourFirst: Iceland
- Education & KnowledgeFirst: South Korea
- Health & WellbeingFirst:
 San Marino
 - Development & Human CapitalFirst:
 Cook Islands
 - Environment & SustainabilityFirst: DR Congo
- Gender & EqualityFirst: Latvia
- Democracy & Civil LibertiesFirst: Norway
- Peace & SecurityFirst: Iceland
- Risk & ResilienceFirst: Liechtenstein
- Mobility & TradeFirst: Singapore
- Food & AgricultureFirst: Austria
- Poverty & InequalityFirst: Belarus
- Money & Public Finance
- EnergyFirst: Bhutan
- Digital & TechnologyFirst: India
- People & Population
- Every topic, side by side
12Method
Questions, method and sources
Which country is placed first on economy & innovation in the Country Index 2026?
Austria, of the 176 countries given a standing on Economy & Innovation. The standing is this site’s own, built from 4 key statistics by 8 publishers; it is not a rank any of those publishers printed.
Which country is placed last on economy & innovation?
Somalia, 176th of 176. A standing says how a country places against the others measured alongside it, so it moves when they move.
Which statistics decide the Economy & Innovation standing?
GDP per Capita (PPP), Firms with a Bank Loan or Line of Credit, Economic Complexity Index, Account Ownership at a Financial Institution. Each is read at one edition and turned into a place within its own field; the places are averaged with one vote each. The other 40 statistics on this topic are published as context and have no vote.
Why is a country not placed on economy & innovation?
A country needs readings on at least 2 of the 4 key statistics before it is placed. 48 countries in the Country Index fall short on this topic; every reading the publishers do give for them is still on their profiles.
Are these the publishers’ own rankings?
The underlying numbers and any printed ranks are the publishers’, reproduced without adjustment on each statistic’s page. The standing that combines them is this site’s, and the average it is ordered by is never published — only the position it produces.
How the Economy & Innovation standing is decided, step by step
A standing is a place in a list, not a mark out of anything. This one is part of the Country Index 2026, and it is worked out like this.
- A few key indicators decide it; the rest are context. 4 indicators on this topic are keys and 40 are charted alongside them without a vote. That split is the point: if every statistic voted, importing five more of one kind would quietly change what the topic is about.
- Each key is read at one edition. ⚠ The keys behind this standing do not all describe the same year — they run from 2024 to 2025, because publishers release on their own schedules. Read the standing as “how this country places now”, not as a snapshot of one year.
- Every country’s published value is turned into a place within that one key’s own field, and then expressed as a share of that field — how far down this key’s list the country sits, rather than how many countries are above it. Keys where a higher published number is worse (terrorism, hunger, disaster risk) are turned round first, so the good end is always the same end.
- Dividing by the field first is the whole reason this works. A place carries the size of its list inside it: 22nd of 44 and 108th of 215 are the same showing, and averaging the numbers 22 and 108 says loudly that they are not. Fields on this site run from about 44 countries to about 215, so averaging raw places would reward a country for happening to be measured in small ones. Dividing each place by its own field removes the size and leaves only the showing.
- The shares are averaged, plainly. One key, one vote — no key is weighted above another, because any weighting would be this site’s opinion presented as a measurement. Countries are then put in order by that average, and the average itself is never published. It is our arithmetic with nothing anchoring it, so printing it would invite it to be read as a measurement somebody made. The position it produces, the band, and the keys it was built from are all published instead — every one of them checkable against the tables on this page.
- A country needs 2 of this topic’s 4 keys — half, rounded up, and never fewer than 2. A standing built from one reading, printed beside one built from four, is two different things sharing a column heading. 176 countries clear the bar here.
- A key has to earn its vote every edition. It must measure at least 120 countries (below that it starts measuring who was surveyed rather than the world), it must not have more than 10% of its field tied at either end, and it must not repeat another key in the same topic — Spearman correlation above 0.92 counts as repeating. A topic needs at least 2 surviving keys to place anyone at all; this one has 4.
- A standing is relative, and the grouping is ours. It says where a country places against the others measured alongside it, so it moves when they move. The publishers listed on this page did not agree to be read together, and each measures its subject its own way: the underlying numbers are theirs, the ordering on top is this site’s — the same method as the rest of the Country Index, applied to one subject instead of all of them.
The key statistics and their licences
- GDP per Capita (PPP) — World Bank Group, CC BY 4.0
- Firms with a Bank Loan or Line of Credit — World Bank Group, CC BY 4.0
- Economic Complexity Index — Growth Lab at Harvard University, CC0 1.0
- Account Ownership at a Financial Institution — World Bank Group, CC BY 4.0
The other 40 statistics on this page come from 7 publishers, each named beside its numbers, with every edition and licence on the datasets pages.
The standing itself is part of the Country Index 2026, published under CC BY-SA 4.0.
Photographs
The countries placed highest, from their profiles: Wikimedia Commons, shown in greyscale, each used under the licence named.
- Austria — chensiyuan, CC BY-SA 4.0
- Japan — JurriaanH, CC BY-SA 3.0
- Germany — dronepicr, CC BY 2.0
Cite this page
Nations Inquiry (2026). Economy & Innovation: country standings, Country Index 2026. https://nationsinquiry.com/topics/economy