Dataset · EIA
Natural Gas Production
45 years, 1980–2024 · 209 countries
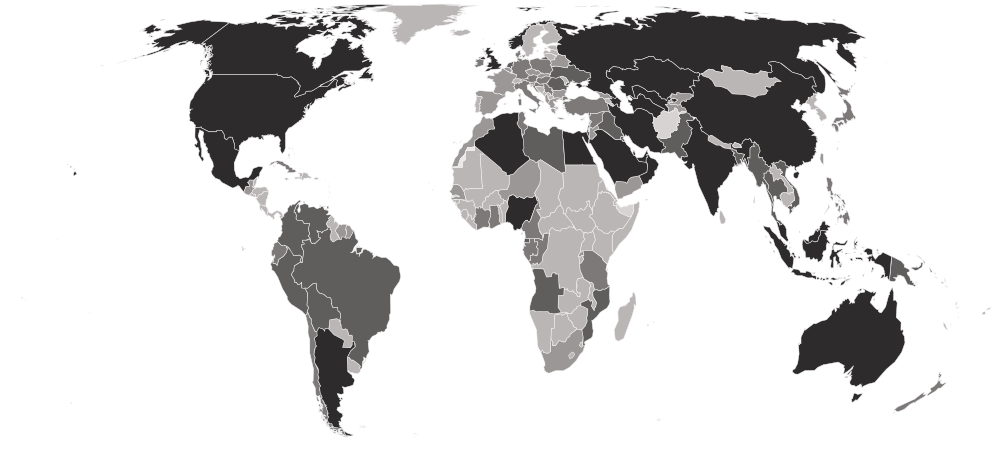
This is how much natural gas a country produces in a year, in billions of cubic metres. It is the companion to crude oil production, and it shows who supplies the gas that heats homes and fuels power stations worldwide.
This site holds every year from 1980 to 2024, read from EIA’s own data and stored exactly as published.
Natural Gas Production · the file
- Newest
- Natural Gas Production, 2024
- Held
- 45 years · 8,999 rows
- Licence
- Public domain or CC0
0145 years
Every year
Newest first. Each opens the full table for that year, and each downloads as a CSV.
| Year | Countries | Change | Read | Download |
|---|---|---|---|---|
| Natural Gas Production, 2024Newest | 209 | ±0 | September 29, 2026 | CSV |
| Natural Gas Production, 2023 | 209 | ±0 | September 29, 2026 | CSV |
| Natural Gas Production, 2022 | 209 | ±0 | September 29, 2026 | CSV |
| Natural Gas Production, 2021 | 209 | −1 | September 29, 2026 | CSV |
| Natural Gas Production, 2020 | 210 | ±0 | September 29, 2026 | CSV |
| Natural Gas Production, 2019 | 210 | ±0 | September 29, 2026 | CSV |
| Natural Gas Production, 2018 | 210 | ±0 | September 29, 2026 | CSV |
| Natural Gas Production, 2017 | 210 | ±0 | September 29, 2026 | CSV |
| Natural Gas Production, 2016 | 210 | ±0 | September 29, 2026 | CSV |
| Natural Gas Production, 2015 | 210 | ±0 | September 29, 2026 | CSV |
| Natural Gas Production, 2014 | 210 | ±0 | September 29, 2026 | CSV |
| Natural Gas Production, 2013 | 210 | ±0 | September 29, 2026 | CSV |
Show all 45 years
Every year in one file, one row per country per year: natural-gas-production-all-editions-nations-inquiry.csv
023 columns
What’s in the file
Every column, what it holds, how it is stored and what its values look like — what a reader needs before opening the file.
| Column | What it holds | Stored as | Range, 2024 | Distinct | Empty | Spread |
|---|---|---|---|---|---|---|
CountrycountryName | The country’s name, as this file spells it. | Text | — | 209 | 0 | |
ISO Codecountry_codeIdentifier | The ISO 3166-1 alpha-3 code, added by this site. Every table here joins on it. | Text · 3 letters | — | 209 | 0 | |
Dry natural gas produced (billion cubic metres)natural_gas_productionHeadline | The headline figure: Dry natural gas produced (billion cubic metres). | Number · up to 19 decimals | 0.00000113 share it1,069.43117 United Statesmiddle 0.00000 | 97 | 0 |
Profiled from the newest file. Range: the lowest and highest value, with the country holding it when only one does. Spread: countries in ten equal steps from lowest to highest. Neither end is better. The values describe a shape, not a score.
03210 countries across every year
Who is covered
How many countries each year holds, continent by continent, who joined and who left, and which places this site covers that the dataset never has.
| 2013 | 2014 | 2015 | 2016 | 2017 | 2018 | 2019 | 2020 | 2021 | 2022 | 2023 | 2024 | |
|---|---|---|---|---|---|---|---|---|---|---|---|---|
| Africa | 54 | 54 | 54 | 54 | 54 | 54 | 54 | 54 | 54 | 54 | 54 | 54 |
| Americas | 44 | 44 | 44 | 44 | 44 | 44 | 44 | 44 | 44 | 44 | 44 | 44 |
| Asia | 51 | 51 | 51 | 51 | 51 | 51 | 51 | 51 | 50 | 50 | 50 | 50 |
| Europe | 42 | 42 | 42 | 42 | 42 | 42 | 42 | 42 | 42 | 42 | 42 | 42 |
| Oceania | 19 | 19 | 19 | 19 | 19 | 19 | 19 | 19 | 19 | 19 | 19 | 19 |
| All | 210 | 210 | 210 | 210 | 210 | 210 | 210 | 210 | 209 | 209 | 209 | 209 |
The newest 12 of 45 years.
Who joined and who left
 − Afghanistan
 + South Sudan
 + Kosovo
 + Montenegro
 + Serbia
 + Timor-Leste
 + Palestine
 + Eritrea
 + Czechia
 + Slovakia
Not in this dataset · 15 places this site covers
EIA gives no figure for these in any year held here. It is the publisher’s choice of scope, and each place’s profile shows what is measured.











04Provenance
Where it comes from
The path from the publisher to this page, and what was checked and changed on the way.
1 · Publisher
U.S. Energy Information Administration (EIA)
2 · Their file
Natural Gas Production 2024
3 · Read by this site
September 29, 2026
Imported by a script that parses each figure and writes it down unrounded.4 · Stored as
45 files, one per year
Each downloads as a CSV, or every year together as natural-gas-production-all-editions-nations-inquiry.csv5 · Used on
Its statistic page, and every profile it measures
Precision
The headline is stored to 19 decimals, as published.
Rounded by this site
Never. Tables on screen may show fewer decimals; the files never do.
Changed by this site
Reshaped into one row per country: regional and income-group totals are left out, only the columns listed are kept, each row gets its ISO 3166 code, and some country names are brought to one spelling. No value is recalculated, rescaled or rounded.
From the U.S. Energy Information Administration’s International Energy Statistics, read from its public bulk download and stored as EIA publishes it.
05Reuse
Licence and credit
What the publisher’s licence lets you do, what it asks of you, and a credit line and citation ready to copy.
Licence · checked September 29, 2026
Public domain (U.S. government work)
- Share and redistribute it
- Adapt it and build on it
- Use it commercially
No conditions at all. Crediting the publisher is still the courteous thing to do.
In plain words
A work of the United States government, which has no copyright in the United States.
A credit line
Source: U.S. Energy Information Administration (EIA), Natural Gas Production, via Nations Inquiry.
Cite this dataset
U.S. Energy Information Administration (EIA). Natural Gas Production, 1980–2024 [data set]. As held by Nations Inquiry, https://nationsinquiry.com/datasets/natural-gas-production
The publisher’s own citation: Source: U.S. Energy Information Administration (Sep 2026). International Energy Statistics — Dry natural gas production (billion cubic metres).
Plain-language summary, not legal advice. The licence text is what binds.
06Where it is used
Around the site
Where these numbers appear on this site, and the datasets nearest to it.
Charted
Natural Gas Production by countryWho is highest, the map, the spread, who rose and fell, and the records.
Subjects
Near neighbours
- Carbon Intensity of ElectricityEmber · 25 held · 2000–2024
- Renewable Share of Electricity GenerationEmber · 25 held · 2000–2024
- World Energy Trilemma IndexWorld Energy Council · 1 held · 2023
07Questions
Natural Gas Production: questions and answers
What is the Natural Gas Production?
This is how much natural gas a country produces in a year, in billions of cubic metres. It is the companion to crude oil production, and it shows who supplies the gas that heats homes and fuels power stations worldwide.
Which years of the Natural Gas Production can I download?
All 45, from 1980 to 2024, each as a CSV file, or every year together in one CSV.
Does EIA rank countries on it?
No, and this site does not order it either. The files hold values only.
Can I use it commercially?
Yes, under Public domain, with credit to EIA. The licence text is linked on this page.