EIA · Natural Gas Production
Natural gas production by country
How much natural gas does a country produce?
Of the 209 countries compared in 2024, United States had the highest reading, 1,069.43117, and 113 countries shared the lowest reading, 0.00000. In the middle country the figure was 0.00000.
Share
Part ofEnergy
Natural gas production · 2024
Context statistic

Highest of 209United States
1,069.43117012024 · values only
The highest and the lowest
The three countries with the highest values of 209 compared, the three with the lowest, and the highest on each continent. This statistic has no better end, so no country is shown as leading.
- 1
- 2

- 3


02Every measured country
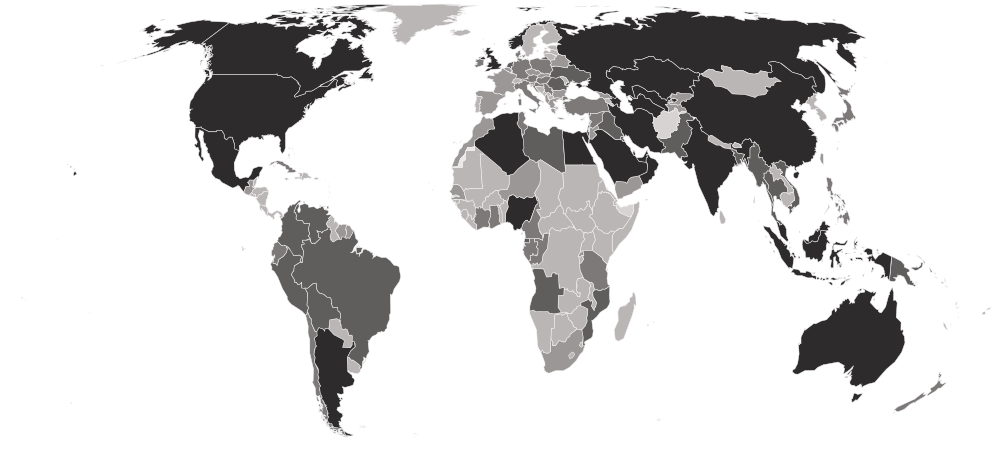
Natural gas production on a map
Each country is shaded by its value, in five groups holding the same number of countries. Hover a country for its value, or select it to open its profile. Below the map, each continent’s middle country.
Darker is a higher value. This statistic has no better end, so the shades describe size, not success.
- 0.00000
- 0.00199–0.22882
- 0.26619–5.20468
- 5.80001–26.98401
- 29.26409–1,069.43117
- No reading in 2024 (1 measured in an earlier edition)
- Asia
2.08090
the middle country, of 50 measured · 52 members
Iran279.0014617 share 0.00000
Highest and lowest reading in Asia.
- Europe
0.01381
the middle country, of 42 measured · 49 members
Russia642.0409717 share 0.00000
Highest and lowest reading in Europe.
- Africa
0.00000
the middle country, of 54 measured · 55 members
 Algeria98.80508
35 share 0.00000
Highest and lowest reading in Africa.
- Americas
0.00000
the middle country, of 44 measured · 48 members
United States1,069.4311728 share 0.00000
Highest and lowest reading in Americas.
- Oceania
0.00000
the middle country, of 19 measured · 21 members
 Australia152.17628
16 share 0.00000
Highest and lowest reading in Oceania.
- Every region
22 sub-regions, highest middle country first
- Central Asia
29.26409
the middle country, of 5 measured · 5 members
 Turkmenistan77.60007
 Tajikistan0.01804
Highest and lowest reading in Central Asia.
- Southern Asia
10.07230
the middle country, of 8 measured · 9 members
Iran279.001464 share 0.00000
Highest and lowest reading in Southern Asia.
- Western Asia
7.03503
the middle country, of 18 measured · 19 members
 Qatar169.95443
4 share 0.00000
Highest and lowest reading in Western Asia.
- Northern Africa
6.63570
the middle country, of 6 measured · 6 members
Algeria98.80508 Sudan0.00000
Highest and lowest reading in Northern Africa.
- South-eastern Asia
6.37155
the middle country, of 11 measured · 11 members
 Malaysia80.57765
4 share 0.00000
Highest and lowest reading in South-eastern Asia.
- South America
5.59125
the middle country, of 12 measured · 12 members
 Argentina46.78012
3 share 0.00000
Highest and lowest reading in South America.
- Eastern Europe
0.95269
the middle country, of 10 measured · 10 members
Russia642.04097 Moldova0.00000
Highest and lowest reading in Eastern Europe.
- Middle Africa
0.47735
the middle country, of 9 measured · 9 members
 Equatorial Guinea6.65087
4 share 0.00000
Highest and lowest reading in Middle Africa.
- Western Europe
0.01500
the middle country, of 7 measured · 9 members
 Netherlands9.68341
2 share 0.00000
Highest and lowest reading in Western Europe.
- Southern Europe
0.00100
the middle country, of 14 measured · 17 members
 Italy2.61968
7 share 0.00000
Highest and lowest reading in Southern Europe.
- Caribbean
0.00000
the middle country, of 20 measured · 24 members
 Trinidad and Tobago25.28675
17 share 0.00000
Highest and lowest reading in Caribbean.
- Central America
0.00000
the middle country, of 8 measured · 8 members
 Mexico31.28363
6 share 0.00000
Highest and lowest reading in Central America.
- Eastern Africa
0.00000
the middle country, of 18 measured · 19 members
 Mozambique12.16910
15 share 0.00000
Highest and lowest reading in Eastern Africa.
- Eastern Asia
0.00000
the middle country, of 8 measured · 8 members
 China258.44362
5 share 0.00000
Highest and lowest reading in Eastern Asia.
- Melanesia
0.00000
the middle country, of 5 measured · 5 members
 Papua New Guinea11.40710
4 share 0.00000
Highest and lowest reading in Melanesia.
- Micronesia
0.00000
the middle country, of 5 measured · 7 members
5 share 0.00000
5 share 0.00000
Highest and lowest reading in Micronesia.
- Northern Europe
0.00000
the middle country, of 11 measured · 13 members
 Norway130.91798
7 share 0.00000
Highest and lowest reading in Northern Europe.
- Polynesia
0.00000
the middle country, of 7 measured · 7 members
7 share 0.00000
7 share 0.00000
Highest and lowest reading in Polynesia.
- Southern Africa
0.00000
the middle country, of 5 measured · 5 members
 South Africa0.05799
4 share 0.00000
Highest and lowest reading in Southern Africa.
- Western Africa
0.00000
the middle country, of 16 measured · 16 members
 Nigeria39.08911
11 share 0.00000
Highest and lowest reading in Western Africa.
- Australia and New Zealand
2 of 2 measured — too few for a middle: Australia, New Zealand.
Australia152.17628 New Zealand3.34423
Highest and lowest reading in Australia and New Zealand.
- Northern America
4 of 4 measured — too few for a middle: Bermuda, Canada, Greenland, United States.
United States1,069.431172 share 0.00000
Highest and lowest reading in Northern America.
03The whole field at once
The spread
209 countries, one dot each, on one scale — further right is a higher value. Half the countries are above 0.00000; a quarter are above 3.34423, and a quarter below 0.00000. The bar in each row marks that continent’s middle country.
04All 210 ever measured
Every country
In order, highest value first. No rank or position is shown: too many countries share the same value for an order to mean anything. Neither end is better: this is the size of an industry, and most countries produce no gas and read zero. The figure is dry, marketed gas, so gas flared or pumped back into oil fields is not counted.
Showing 25 of 210 countries





















































































































































Values for 2024. The change column compares 2024 with 2023 only; the sparkline covers the recent editions.
051980–2024 · 45 editions
Over time
Each point is one year from 1980. Output rises as fields, pipelines and export terminals open and falls as fields deplete; sanctions and war can move it sharply in a single year.
- the middle country
- the middle half of countries
- the middle of the 178 countries measured every time
- each continent’s middle country
The same, year by year
| Year | Countries | Middle country | Middle half | Measured every time |
|---|---|---|---|---|
| 2024 | 209 | 0.00000 | 0.00000 – 3.34423 | 0.00000 |
| 2023 | 209 | 0.00000 | 0.00000 – 3.11569 | 0.00000 |
| 2022 | 209 | 0.00000 | 0.00000 – 3.20535 | 0.00000 |
| 2021 | 209 | 0.00000 | 0.00000 – 4.15979 | 0.00000 |
| 2020 | 210 | 0.00000 | 0.00000 – 3.99211 | 0.00000 |
| 2019 | 210 | 0.00000 | 0.00000 – 4.63809 | 0.00000 |
| 2018 | 210 | 0.00000 | 0.00000 – 4.45541 | 0.00000 |
| 2017 | 210 | 0.00000 | 0.00000 – 5.03930 | 0.00000 |
| 2016 | 210 | 0.00000 | 0.00000 – 4.34062 | 0.00000 |
| 2015 | 210 | 0.00000 | 0.00000 – 4.53854 | 0.00000 |
| 2014 | 210 | 0.00000 | 0.00000 – 4.86255 | 0.00000 |
| 2013 | 210 | 0.00000 | 0.00000 – 4.73079 | 0.00000 |
| 2012 | 210 | 0.00000 | 0.00000 – 4.32379 | 0.00000 |
| 2011 | 209 | 0.00000 | 0.00000 – 3.82004 | 0.00000 |
| 2010 | 209 | 0.00000 | 0.00000 – 3.52603 | 0.00000 |
| 2009 | 209 | 0.00000 | 0.00000 – 3.15003 | 0.00000 |
| 2008 | 209 | 0.00000 | 0.00000 – 2.97003 | 0.00000 |
| 2007 | 208 | 0.00000 | 0.00000 – 2.72753 | 0.00000 |
| 2006 | 208 | 0.00000 | 0.00000 – 2.52002 | 0.00000 |
| 2005 | 206 | 0.00000 | 0.00000 – 2.18252 | 0.00000 |
| 2004 | 206 | 0.00000 | 0.00000 – 2.01327 | 0.00000 |
| 2003 | 206 | 0.00000 | 0.00000 – 2.23277 | 0.00000 |
| 2002 | 205 | 0.00000 | 0.00000 – 2.15002 | 0.00000 |
| 2001 | 205 | 0.00000 | 0.00000 – 1.91002 | 0.00000 |
| 2000 | 205 | 0.00000 | 0.00000 – 1.80502 | 0.00000 |
| 1999 | 205 | 0.00000 | 0.00000 – 1.72002 | 0.00000 |
| 1998 | 205 | 0.00000 | 0.00000 – 1.76002 | 0.00000 |
| 1997 | 205 | 0.00000 | 0.00000 – 1.75002 | 0.00000 |
| 1996 | 204 | 0.00000 | 0.00000 – 1.81773 | 0.00000 |
| 1995 | 204 | 0.00000 | 0.00000 – 1.96257 | 0.00000 |
| 1994 | 204 | 0.00000 | 0.00000 – 1.94499 | 0.00000 |
| 1993 | 203 | 0.00000 | 0.00000 – 1.93154 | 0.00000 |
| 1992 | 201 | 0.00000 | 0.00000 – 1.82001 | 0.00000 |
| 1991 | 182 | 0.00000 | 0.00000 – 1.23466 | 0.00000 |
| 1990 | 181 | 0.00000 | 0.00000 – 1.86891 | 0.00000 |
| 1989 | 180 | 0.00000 | 0.00000 – 1.45124 | 0.00000 |
| 1988 | 180 | 0.00000 | 0.00000 – 1.09728 | 0.00000 |
| 1987 | 180 | 0.00000 | 0.00000 – 1.17515 | 0.00000 |
| 1986 | 180 | 0.00000 | 0.00000 – 1.11144 | 0.00000 |
| 1985 | 179 | 0.00000 | 0.00000 – 1.18931 | 0.00000 |
| 1984 | 179 | 0.00000 | 0.00000 – 0.96277 | 0.00000 |
| 1983 | 179 | 0.00000 | 0.00000 – 0.87782 | 0.00000 |
| 1982 | 179 | 0.00000 | 0.00000 – 0.92030 | 0.00000 |
| 1981 | 179 | 0.00000 | 0.00000 – 0.79287 | 0.00000 |
| 1980 | 179 | 0.00000 | 0.00000 – 0.63713 | 0.00000 |
062023 → 2024
Who rose and fell
The biggest changes in value between the two newest editions. Places are shown second, because they also move when other countries do.
Rose most
before → afterFell most
before → after Egypt57.43471 → 47.47230−9.96241
- Turkmenistan84.27665 → 77.60007−6.67658
- Algeria105.28310 → 98.80508−6.47802
 United Kingdom34.04229 → 30.81793−3.22436
- Mexico34.47724 → 31.28363−3.19361
209 countries were measured in both 2023 and 2024.
07Across every edition
Natural gas production in records
The extremes of the statistic. A record reached by more than one country names none of them.
Highest reading on record
1,070.46935
Dry natural gas produced (billion cubic metres)
Lowest reading on record
Reached 5213 times by 140 countries — shared, so no holder is named
0.00000
Dry natural gas produced (billion cubic metres)
Biggest rise between editions
+97.23129
774.19911 → 871.43040
Biggest fall between editions
−83.71524
732.63422 → 648.91898
Biggest change since first measured
+519.99603
549.43514 → 1,069.43117
Highest most often
29 of 45
editions, alone at the first-listed end
08The measure
About natural gas production
This is how much natural gas a country produces in a year, in billions of cubic metres. It is the companion to crude oil production, and it shows who supplies the gas that heats homes and fuels power stations worldwide.
What the number is: Dry natural gas produced (billion cubic metres).
09Where it fits
Connections
Its part in the Country Index, the statistics whose values line up most closely with it across countries, and others on the same subject.
In the Country Index
Context, with no vote
This statistic is published in full under Energy, but does not help decide any Country Index standing.
Moves with
Where natural gas production is higher, these tend to be higher too.
- Crude Oil ProductionEIA · 205 countries in commonρ 0.88
- Primary Energy ProductionEIA · 203 countries in commonρ 0.83
- Gas Share of Electricity GenerationEmber · 162 countries in commonρ 0.71
Moves against
Where natural gas production is higher, these tend to be lower.
- Net Official Development Assistance ReceivedOECD Development Assistance Committee · 127 countries in commonρ −0.63
- Foreign Value Added Share of Gross ExportsOECD · 80 countries in commonρ −0.55
- Outbound Mobility Ratio, TertiaryUIS · 113 countries in commonρ −0.42
Rank correlation (ρ, from −1 to 1) across countries, on each statistic’s newest edition, out of 384 statistics sharing at least 80 countries with this one. Two statistics that move together do not cause each other.
10Keep reading
Explore further
The subject
11Questions
Natural gas production: questions and answers
Which country has the highest natural gas production?
United States, at 1,069.43117, among the 209 countries compared in 2024.
Which country has the lowest natural gas production?
113 countries share the lowest reading, 0.00000, among the 209 compared in 2024, so no single country is named.
How many countries does the Natural Gas Production cover?
209 in 2024, and 210 at least once across all editions. The number measured varies from 179 to 210 between editions.
What is the world average natural gas production?
This site does not calculate a world average, which would depend on how countries are weighted. In the middle country of the 209 compared in 2024, the figure was 0.00000.
Is this U.S. Energy Information Administration (EIA)’s own ranking?
No ranking is shown. U.S. Energy Information Administration (EIA) publishes values only, and too many countries share the same value for an ordering to mean anything, so none is derived.
How often is the Natural Gas Production published?
This site holds 45 editions, describing 1980 to 2024.
Where does the data come from, and can I download it?
From U.S. Energy Information Administration (EIA), under Public domain (U.S. government work). From the U.S. Energy Information Administration’s International Energy Statistics, read from its public bulk download and stored as EIA publishes it. Every edition is on this site’s Datasets pages as a full table, and downloads as a CSV file with every value unrounded.
12Method
Sources, method and citation
Source
Natural Gas Production — U.S. Energy Information Administration (EIA)
From the U.S. Energy Information Administration’s International Energy Statistics, read from its public bulk download and stored as EIA publishes it.
Newest edition
Report year 2024Data year 2024
Cite the source as: Source: U.S. Energy Information Administration (Sep 2026). International Energy Statistics — Dry natural gas production (billion cubic metres).
Licence: Public domain (U.S. government work), checked 2026-09-29.
How this page reads the numbers
- No rank or position is shown: U.S. Energy Information Administration (EIA) publishes values only, and too many countries share the same value for an ordering to mean anything.
- This statistic has no better end, so the page describes higher and lower values and never calls a country a leader.
- A country is named at an end only when it holds that value alone. Where several share it, the page says how many and names none first.
- Values are stored exactly as published and trimmed only for display. “The middle country” is the median of the countries measured, not a world average.
The file itself, column by column — where it came from, what each column holds, and every edition as a CSV — is on its dataset page.
Cite this page
Nations Inquiry (2026). Natural gas production by country: Natural Gas Production, data from U.S. Energy Information Administration (EIA). https://nationsinquiry.com/statistics/natural-gas-production