Dataset · World Bank Group
Municipal Solid Waste Generation
Municipal Solid Waste Generation, 2026 compilation · 201 countries · 2 measures
This is how much household and similar waste each person generates a day, in kilograms — what homes, shops, offices and schools throw away, including litter and waste nobody collects. It is the World Bank's headline figure from What a Waste, its global snapshot of solid waste.
This site holds one edition, Municipal Solid Waste Generation, 2026 compilation, read from World Bank Group’s own data and stored exactly as published.
Municipal Solid Waste Generation · the file
- Newest
- Municipal Solid Waste Generation, 2026 compilation
- Held
- 1 edition · 201 rows
- Licence
- CC BY 4.0
01One edition
Every edition
Newest first. Each opens the full table for that edition, and each downloads as a CSV.
| Edition | Countries | Change | Read | Download |
|---|---|---|---|---|
| Municipal Solid Waste Generation, 2026 compilation | 201 | — | September 29, 2026 | CSV |
Every edition in one file, one row per country per edition: municipal-waste-all-editions-nations-inquiry.csv
026 columns
What’s in the file
Every column, what it holds, how it is stored and what its values look like — what a reader needs before opening the file.
| Column | What it holds | Stored as | Range, 2026 | Distinct | Empty | Spread |
|---|---|---|---|---|---|---|
CountrycountryName | The country’s name, as this file spells it. | Text | — | 201 | 0 | |
ISO Codecountry_codeIdentifier | The ISO 3166-1 alpha-3 code, added by this site. Every table here joins on it. | Text · 3 letters | — | 201 | 0 | |
Year reportedreference_yearReading year | The year this country’s reading describes. Readings from different years sit side by side. | Year | — | 14 | 0 | |
Municipal solid waste (kg per person per day)municipal_wasteHeadline | The headline figure: Municipal solid waste generated (kg per person per day). | Number · up to 18 decimals | 0.05769 Burkina Faso4.17607  British Virgin Islandsmiddle 0.96558 | 199 | 0 | |
Municipal solid waste (tonnes per year)waste_tonnesMeasure | Municipal solid waste generated in the country in the year reported, in tonnes. | Number · up to 12 decimals | 570 Nauru502,607,448  Chinamiddle 2,044,000 | 200 | 0 | |
Where it was measuredpoint_of_measurementLabel | Where in the waste chain the amount was weighed — at the household or business, at a transfer station, or at the landfill or plant — or Not stated. | Text | — | 7 | 1 |
Profiled from the newest file. Range: the lowest and highest value, with the country holding it when only one does. Spread: countries in ten equal steps from lowest to highest. A higher value is the worse result.
03201 countries across every edition
Who is covered
How many countries each edition holds, continent by continent, who joined and who left, and which places this site covers that the dataset never has.
| 2026 | |
|---|---|
| Africa | 39 |
| Americas | 45 |
| Asia | 50 |
| Europe | 48 |
| Oceania | 19 |
| All | 201 |
One edition, covering 201 countries.
Not in this dataset · 24 places this site covers
World Bank Group gives no figure for these in any edition held here. It is the publisher’s choice of scope, and each place’s profile shows what is measured.

















04Provenance
Where it comes from
The path from the publisher to this page, and what was checked and changed on the way.
1 · Publisher
World Bank Group
2 · Their file
What a Waste 3.0 — Municipal Solid Waste Generation
3 · Read by this site
September 29, 2026
Imported by a script that parses each figure and writes it down unrounded.4 · Stored as
1 file, one per edition
It downloads as a CSV: municipal-waste-all-editions-nations-inquiry.csv5 · Used on
Its statistic page, and every profile it measures
Precision
The headline is stored to 18 decimals, as published.
Rounded by this site
Never. Tables on screen may show fewer decimals; the files never do.
Changed by this site
Reshaped into one row per country: regional and income-group totals are left out, only the columns listed are kept, each row gets its ISO 3166 code, and some country names are brought to one spelling. No value is recalculated, rescaled or rounded.
From the World Bank's What a Waste 3.0 country dataset, published in March 2026. The Bank's modelled estimates for 2022 and its projections to 2050 are not used.
05Reuse
Licence and credit
What the publisher’s licence lets you do, what it asks of you, and a credit line and citation ready to copy.
Licence · checked September 29, 2026
- Share and redistribute it
- Adapt it and build on it
- Use it commercially
- Credit the publisher
- Say what you changed
Share, adapt and use commercially. Credit the publisher and say if you changed anything.
A credit line
Source: World Bank Group, Municipal Solid Waste Generation, via Nations Inquiry.
Cite this dataset
World Bank Group. Municipal Solid Waste Generation, Municipal Solid Waste Generation, 2026 compilation [data set]. As held by Nations Inquiry, https://nationsinquiry.com/datasets/municipal-waste
The publisher’s own citation: Cook, E., Ionkova, K., Bhada-Tata, P., Yadav, S., and Van Woerden, F. (2026). What a Waste 3.0: Global Snapshot of Solid Waste Management Toward Circularity until 2050. Country dataset (Excel). Washington, DC: World Bank Group.
Plain-language summary, not legal advice. The licence text is what binds.
06Where it is used
Around the site
Where these numbers appear on this site, and the datasets nearest to it.
Charted
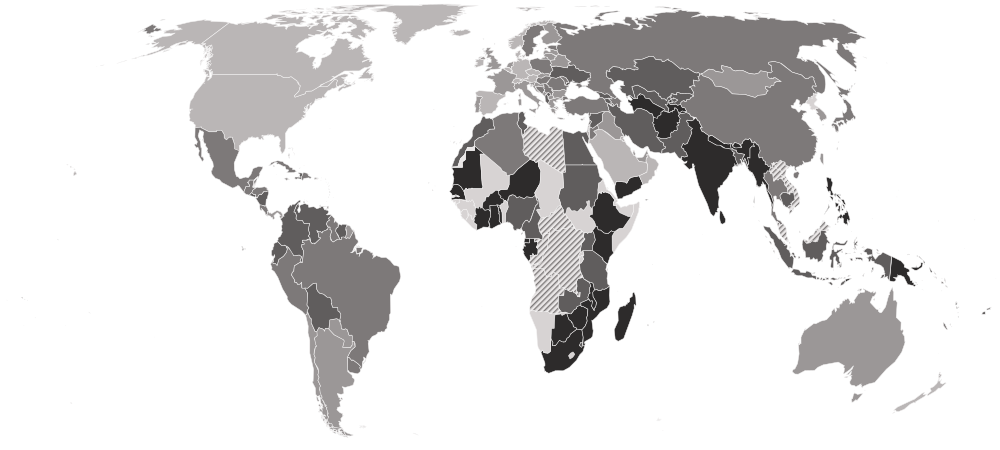
Municipal Solid Waste Generation by countryWho is highest, the map, the spread, who rose and fell, and the records.
Subjects
Near neighbours
- CO₂ Emissions per CapitaGlobal Carbon Project · 75 held · 1950–2024
- Ecological FootprintGlobal Footprint Network · 65 held · 1961–2025
- Water StressFAO · 24 held · 2000–2023
07Questions
Municipal Solid Waste Generation: questions and answers
What is the Municipal Solid Waste Generation?
This is how much household and similar waste each person generates a day, in kilograms — what homes, shops, offices and schools throw away, including litter and waste nobody collects. It is the World Bank's headline figure from What a Waste, its global snapshot of solid waste.
Which editions of the Municipal Solid Waste Generation can I download?
One: Municipal Solid Waste Generation, 2026 compilation, as a CSV file.
Does World Bank Group rank countries on it?
No. World Bank Group publishes values only. The positions shown on this site are derived by ordering the published values, and are labelled as ours.
Can I use it commercially?
Yes, under CC BY 4.0, with credit to World Bank Group. The licence text is linked on this page.