World Bank Group · Municipal Solid Waste Generation
Municipal waste per person by country
How much rubbish does each person throw away in a day?
Of the 183 countries compared in the 2026 edition, Burkina Faso had the lowest reading, 0.05769, and British Virgin Islands had the highest reading, 4.17607. In the middle country the figure was 0.97260. 18 readings from before 2016 are listed but not compared.
Share
Part ofEnvironment & Sustainability
Municipal waste per person · the 2026 edition
Context statistic

Lowest of 183Burkina Faso
0.0576901the 2026 edition · position · derived
Who leads
The three countries at the lowest end of 183 compared, the three at the other end, and the first on each continent.
 1
Photo: qiv derivative work: JamesA · CC BY-SA 2.0, greyscale
 2
Photo: Ferdinand Reus from Arnhem, Holland derivative work: Jjtkk · CC BY-SA 2.0, greyscale
 3
Photo: Bernard Gagnon derivative work: ויקיג'אנקי · CC BY-SA 3.0, greyscale

Highest in the 2026 edition
 British Virgin Islands4.17607
 Barbados3.83966
 Bahamas3.48318
Where a country sits says how it compares with the others measured, and nothing about why.
02Every measured country
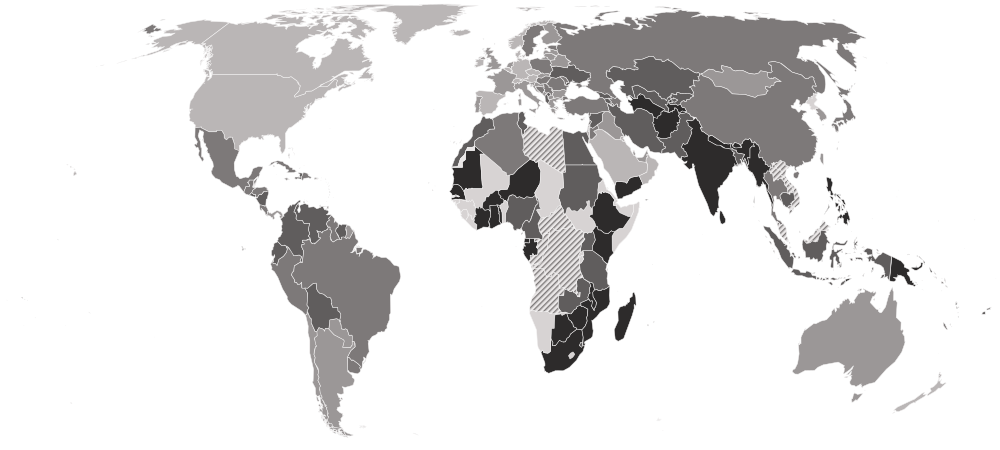
Municipal waste per person on a map
Each country is shaded by its value, in five groups holding the same number of countries. Hover a country for its value, or select it to open its profile. Below the map, each continent’s middle country.
Darker is a lower value — the better end.
- 1.53436–4.17607
- 1.16851–1.52918
- 0.81918–1.14346
- 0.50000–0.81112
- 0.05769–0.49715
- Hatched: a reading from before 2016, listed but not compared (18)
- No reading in the 2026 edition
- Africa
0.46644
the middle country, of 30 measured · 55 members
Burkina Faso0.05769 Mauritius1.01642
Lowest and highest reading in Africa.
- Oceania
0.74483
the middle country, of 18 measured · 21 members
 Nauru0.13425
 Palau2.00800
Lowest and highest reading in Oceania.
- Asia
0.88196
the middle country, of 47 measured · 52 members
 Nepal0.17074
 Bahrain2.82668
Lowest and highest reading in Asia.
- Americas
1.06782
the middle country, of 41 measured · 48 members
 Dominica0.53171British Virgin Islands4.17607
Lowest and highest reading in Americas.
- Europe
1.33378
the middle country, of 47 measured · 49 members
 Ukraine0.67362
 Monaco3.25006
Lowest and highest reading in Europe.
- Every region
22 sub-regions, lowest middle country first
- Western Africa
0.30632
the middle country, of 8 measured · 16 members
Burkina Faso0.05769 Nigeria0.56378
Lowest and highest reading in Western Africa.
- Southern Asia
0.39320
the middle country, of 9 measured · 9 members
Nepal0.17074 Maldives1.17045
Lowest and highest reading in Southern Asia.
- Polynesia
0.42177
the middle country, of 5 measured · 7 members
 Tonga0.24559
 American Samoa0.94000
Lowest and highest reading in Polynesia.
- Eastern Africa
0.44493
the middle country, of 11 measured · 19 members
 Ethiopia0.10401Mauritius1.01642
Lowest and highest reading in Eastern Africa.
- Melanesia
0.53000
the middle country, of 5 measured · 5 members
 Vanuatu0.39497
 New Caledonia1.07000
Lowest and highest reading in Melanesia.
- Central Asia
0.54003
the middle country, of 5 measured · 5 members
 Turkmenistan0.31941
 Kyrgyzstan0.76438
Lowest and highest reading in Central Asia.
- Northern Africa
0.64259
the middle country, of 5 measured · 6 members
 Sudan0.50000
 Algeria0.84665
Lowest and highest reading in Northern Africa.
- South-eastern Asia
0.66587
the middle country, of 8 measured · 11 members
 Myanmar0.39042
 Brunei1.84948
Lowest and highest reading in South-eastern Asia.
- South America
0.84624
the middle country, of 12 measured · 12 members
 Suriname0.61835
 Chile1.22017
Lowest and highest reading in South America.
- Central America
0.87664
the middle country, of 7 measured · 8 members
 Nicaragua0.62970
 Panama1.25014
Lowest and highest reading in Central America.
- Micronesia
0.98524
the middle country, of 6 measured · 7 members
Nauru0.13425Palau2.00800Lowest and highest reading in Micronesia.
- Eastern Europe
1.03946
the middle country, of 10 measured · 10 members
Ukraine0.67362 Czechia1.53436
Lowest and highest reading in Eastern Europe.
- Western Asia
1.13135
the middle country, of 18 measured · 19 members
 Yemen0.38201Bahrain2.82668
Lowest and highest reading in Western Asia.
- Caribbean
1.22422
the middle country, of 18 measured · 24 members
Dominica0.53171British Virgin Islands4.17607Lowest and highest reading in Caribbean.
- Southern Europe
1.33672
the middle country, of 16 measured · 17 members
 Albania0.72094
 Spain1.61257
Lowest and highest reading in Southern Europe.
- Eastern Asia
1.35750
the middle country, of 7 measured · 8 members
 Japan0.88196
 Hong Kong2.18870
Lowest and highest reading in Eastern Asia.
- Northern Europe
1.36159
the middle country, of 12 measured · 13 members
Channel Islands1.00000
 Norway2.11550
Lowest and highest reading in Northern Europe.
- Western Europe
1.87175
the middle country, of 9 measured · 9 members
 Netherlands1.28906Monaco3.25006
Lowest and highest reading in Western Europe.
- Australia and New Zealand
2 of 2 measured — too few for a middle: Australia, New Zealand.
 Australia1.47958
 New Zealand1.93004
Lowest and highest reading in Australia and New Zealand.
- Middle Africa
3 of 9 measured — too few for a middle: Cameroon, Equatorial Guinea, Gabon.
 Equatorial Guinea0.36709
 Cameroon0.60285
Lowest and highest reading in Middle Africa.
- Northern America
4 of 4 measured — too few for a middle: Bermuda, Canada, Greenland, United States.
 Greenland2.05205
 Bermuda3.10816
Lowest and highest reading in Northern America.
- Southern Africa
3 of 5 measured — too few for a middle: Botswana, Eswatini, South Africa.
 Botswana0.29337
 Eswatini0.56640
Lowest and highest reading in Southern Africa.
03The whole field at once
The spread
183 countries, one dot each, on one scale — further right is a higher value. Half the countries are above 0.97260; a quarter are above 1.38013, and a quarter below 0.55789. The bar in each row marks that continent’s middle country.
04All 201 ever measured
Every country
In order, highest value first — position 1 is the highest value, the way World Bank Group’s own tables read. “=” marks a position shared with another country. World Bank Group ranks nobody on this measure; the position is derived here by ordering the published values. Higher is worse. Richer countries and small islands with many visitors generate the most, and the lowest figures often reflect poverty rather than thrift. Countries weigh their waste at different points — at the household, at transfer stations or at the landfill — so small differences between them mean little.
Showing 25 of 201 countries




































































































































Values for the 2026 edition.
05In this edition
Municipal waste per person in records
The extremes of the statistic. A record reached by more than one country names none of them.
Highest reading
4.17607
Municipal solid waste generated (kg per person per day)
Lowest reading
0.05769
Municipal solid waste generated (kg per person per day)
06The measure
About municipal waste per person
This is how much household and similar waste each person generates a day, in kilograms — what homes, shops, offices and schools throw away, including litter and waste nobody collects. It is the World Bank's headline figure from What a Waste, its global snapshot of solid waste.
What the number is: Municipal solid waste generated (kg per person per day).
What it does not measure
It counts how much waste is generated, not what happens to it — whether it is collected, recycled, burned or dumped. It leaves out industrial, construction, mining and farm waste, and countries weigh it at different points in the chain.
07Where it fits
Connections
Its part in the Country Index, the statistics whose values line up most closely with it across countries, and others on the same subject.
In the Country Index
Context, with no vote
This statistic is published in full under Environment & Sustainability, but does not help decide any Country Index standing.
Moves with
Where municipal waste per person is higher, these tend to be higher too.
- GNI per Capita (PPP)World Bank Group · 82 countries in commonρ 0.84
- Actual Individual Consumption per Capita (PPP)World Bank Group · 144 countries in commonρ 0.83
- Comprehensive Wealth per CapitaWorld Bank Group · 129 countries in commonρ 0.82
Moves against
Where municipal waste per person is higher, these tend to be lower.
- Employment in AgricultureILO · 152 countries in commonρ −0.82
- Agriculture, Forestry and Fishing Value Added (% of GDP)World Bank Group · 132 countries in commonρ −0.79
- Vulnerable EmploymentKeyILO · 152 countries in commonρ −0.78
Rank correlation (ρ, from −1 to 1) across countries, on each statistic’s newest edition, out of 372 statistics sharing at least 80 countries with this one. Two statistics that move together do not cause each other.
08Keep reading
Explore further
The subject
The data, edition by edition
The countries at either end
More from World Bank Group
09Questions
Municipal waste per person: questions and answers
Which country has the lowest municipal waste per person?
Burkina Faso, at 0.05769, among the 183 countries compared in the 2026 edition.
Which country has the highest municipal waste per person?
British Virgin Islands, at 4.17607, among the 183 countries compared in the 2026 edition.
How many countries does the Municipal Solid Waste Generation cover?
183 in the 2026 edition, and 201 at least once across all editions.
What is the world average municipal waste per person?
This site does not calculate a world average, which would depend on how countries are weighted. In the middle country of the 183 compared in the 2026 edition, the figure was 0.97260.
Is this World Bank Group’s own ranking?
No. World Bank Group publishes the values but ranks nobody; the position on this page is derived by Nations Inquiry by ordering the published values, and equal values share a position.
How often is the Municipal Solid Waste Generation published?
This site holds one edition, describing 2026.
Where does the data come from, and can I download it?
From World Bank Group, under CC BY 4.0. From the World Bank's What a Waste 3.0 country dataset, published in March 2026. The Bank's modelled estimates for 2022 and its projections to 2050 are not used. Every edition is on this site’s Datasets pages as a full table, and downloads as a CSV file with every value unrounded.
10Method
Sources, method and citation
Source
Municipal Solid Waste Generation — World Bank Group
From the World Bank's What a Waste 3.0 country dataset, published in March 2026. The Bank's modelled estimates for 2022 and its projections to 2050 are not used.
Newest edition
Report year 2026Data year not recorded
Cite the source as: Cook, E., Ionkova, K., Bhada-Tata, P., Yadav, S., and Van Woerden, F. (2026). What a Waste 3.0: Global Snapshot of Solid Waste Management Toward Circularity until 2050. Country dataset (Excel). Washington, DC: World Bank Group.
Licence: CC BY 4.0, checked 2026-09-29.
How this page reads the numbers
- World Bank Group ranks nobody on this measure. The position is derived by Nations Inquiry by ordering the published values; equal values share a position.
- Which end is better follows the publisher’s own reading of the measure.
- A country is named at an end only when it holds that value alone. Where several share it, the page says how many and names none first.
- The file gives each country’s most recent reading, so the rows are from different years. Readings from before 2016 are listed but left out of every comparison on this page.
- Values are stored exactly as published and trimmed only for display. “The middle country” is the median of the countries measured, not a world average.
The file itself, column by column — where it came from, what each column holds, and every edition as a CSV — is on its dataset page.
Photographs
The countries at the top of this statistic, from their profiles: Wikimedia Commons, shown in greyscale, each used under the licence named.
Cite this page
Nations Inquiry (2026). Municipal waste per person by country: Municipal Solid Waste Generation, data from World Bank Group. https://nationsinquiry.com/statistics/municipal-waste