
Photo: Phelipemancheno · CC0 · via Wikimedia Commons, shown in greyscale
Topic 06 of 18 · Country Index 2026

Ecuador: Development & Human Capital
Is a country turning its resources into better lives?
Ecuador is placed 102nd of 196 countries on development & human capital in the Country Index 2026, from 3 of its 3 key statistics. Readings behind it: Social Protection Coverage 46.8 (2025); Maternal Mortality Ratio 55.37 (2023).
Development & Human Capital
102nd
of 196 countries placed
Placed from 3 of 3 key statistics
01The evidence
The 3 key statistics that decide it
Only these place Ecuador on development & human capital — one vote each. Every value is the publisher’s own, read at the edition the Country Index 2026 used — or, for a survey-based key, each country’s latest reading; the grey ticks are every other country it was compared with, lowest on the left.
Key 2 of 3
Maternal Mortality Ratio
UN Maternal Mortality Estimation Inter-Agency Group (MMEIG)
Why it is a key: Whether a woman survives giving birth — the reach of a health system at the moment it is hardest to fake.
2023 edition · data for 2023 · CC BY 3.0 IGO
55.37
Maternal deaths per 100,000 live births
Lower is better
Ecuador: 55.37. Across the 195 countries in this edition, values run from 0.11 (Cook Islands) to 992.83 (Nigeria); the world median is 46.65.
- World median
- 46.65
- Best in South America
- 9.88 Chile
- Land neighbours
- Colombia 59.38 · Peru 51.45
Each grey tick is one of 195 countries in the 2023 edition.
Key 3 of 3
Human Development Index
UNDP Human Development Report Office
Why it is a key: The standard composite of health, schooling and income, carrying UNDP's own published rank.
2023 edition · data for 2023 · CC BY 3.0 IGO
0.777
HDI score (0–1)
Higher is better
Ranked 88th of 193 by UNDP Human Development Report Office
Ecuador: 0.777. Across the 193 countries in this edition, values run from 0.388 (South Sudan) to 0.972 (Iceland); the world median is 0.762.
- World median
- 0.762
- Best in South America
- 0.878 Chile
- Land neighbours
- Colombia 0.788 · Peru 0.794
Each grey tick is one of 193 countries in the 2023 edition.
02Over time
Which way Ecuador is moving
Each key’s published value, edition by edition, beside the world median. The Country Index 2026 is the first edition of the standing, so the standing itself has no history to chart yet.
Maternal Mortality Ratio
Maternal deaths per 100,000 live births · lower is better
EcuadorWorld median
Ecuador fell from 122.74 in 2000 to 55.37 in 2023; the world median went from 70.99 to 46.65.
Every year’s figures
Year Ecuador World median 2023 55.37 46.7 2022 68.73 53.0 2021 93.37 76.6 2020 91.50 56.0 2019 61.53 48.4 2018 60.93 49.3 2017 61.51 47.2 2016 64.71 50.6 2015 64.23 51.9 2014 64.88 52.8 2013 68.13 53.3 2012 72.44 54.6 2011 76.63 55.0 2010 79.71 56.1 2009 81.53 56.3 2008 83.24 55.8 2007 85.85 56.8 2006 90.03 58.1 2005 93.51 60.1 2004 96.85 63.0 2003 101.79 66.8 2002 109.32 66.0 2001 116.18 68.1 2000 122.74 71.0 Human Development Index
HDI score (0–1) · higher is better
EcuadorWorld median
Ecuador rose from 0.683 in 2000 to 0.777 in 2023; the world median went from 0.672 to 0.762.
Every year’s figures
Year Ecuador World median 2023 0.777 0.7620 2022 0.773 0.7610 2021 0.753 0.7450 2020 0.740 0.7425 2019 0.765 0.7515 2018 0.767 0.7520 2017 0.764 0.7480 2016 0.761 0.7500 2015 0.764 0.7430 2014 0.760 0.7410 2013 0.755 0.7390 2012 0.750 0.7350 2011 0.743 0.7250 2010 0.737 0.7250 2009 0.731 0.7220 2008 0.729 0.7180 2007 0.722 0.7100 2006 0.718 0.7045 2005 0.714 0.6960 2004 0.709 0.6960 2003 0.703 0.6910 2002 0.698 0.6845 2001 0.691 0.6770 2000 0.683 0.6720
03In context
Ecuador beside its neighbours
A position reads best beside the countries around it. Every position below is a place among all 196 countries on development & human capital, never a place within the region.
Ecuador and the countries it borders
The standing is each country’s place among all 196 placed on the topic; the other columns are the publishers’ own values, read at the edition the standing used.
| Country | Standing | Social Protection CoveragePopulation covered by at least one social protection benefit (%) | Maternal Mortality RatioMaternal deaths per 100,000 live births | Human Development IndexHDI score (0–1) |
|---|---|---|---|---|
 Colombia Colombia | 94th | 58.3 | 59.38 | 0.788 |
| Ecuador | 102nd | 46.8 | 55.37 | 0.777 |
 Peru Peru | 106th | 30.1 | 51.45 | 0.794 |
“—” means the publisher gives no reading for that country in that edition. A country needs readings on enough keys to be placed.
Across South America
Every country in the sub-region, by its place among all 196.

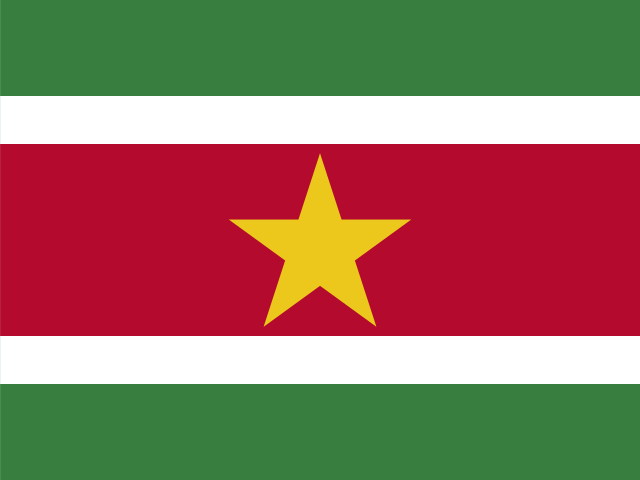
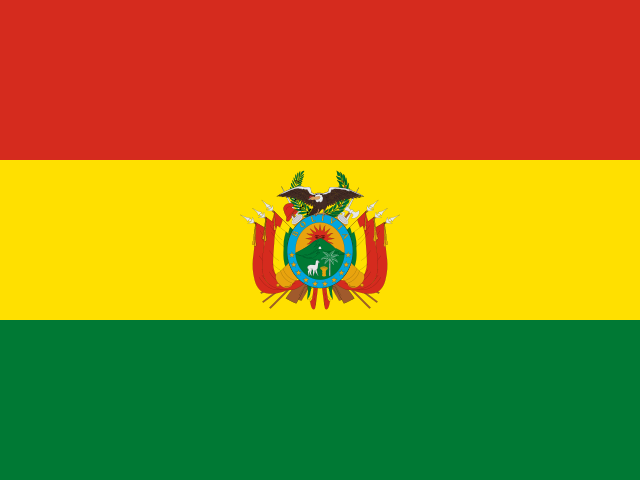

Placed either side on development & human capital
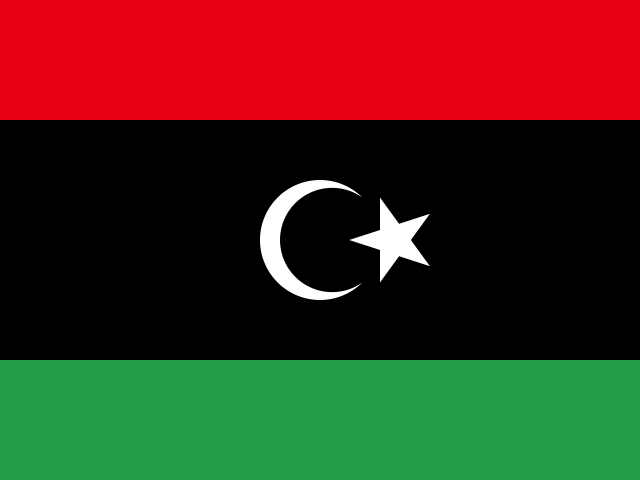
The countries immediately above and below Ecuador in the topic’s list.




04Context, no vote
Where Ecuador is ahead of the world, and behind
28 more statistics filed under development & human capital, published in full and deliberately given no vote in the standing. Select a row for the publisher, the rank and the links.
Ahead of the world median12
Statistics on which Ecuador does better than the middle country measured.
Gender Development IndexUNDP Human Development Report Office · 2023 · world median 0.9710.9980.971▲ Improved since 2013
Ecuador: 0.998 · world median 0.971 · Gender Development Index (1.000 = parity). UNDP Human Development Report Office, 2023 edition, data for 2023.
Published values in that edition run from 0.407 to 1.038; higher is better.
Position 6th of 184 — derived here by ordering the published values, 1st = best. The publisher ranks no country on this.
Global Multidimensional Poverty IndexOPHI · 2025 · world median 0.0390.0080.039No real change since 2018
Ecuador: 0.008 · world median 0.039 · MPI (0–1). Oxford Poverty and Human Development Initiative (OPHI), 2025 edition, data for 2025.
Published values in that edition run from 0 to 0.517; lower is better.
Position 82nd of 109 — derived here by ordering the published values, 1st = worst. The publisher ranks no country on this.
Planetary pressures-adjusted HDIUNDP Human Development Report Office · 2023 · world median 0.6780.7350.678▲ Improved since 2013
Ecuador: 0.735 · world median 0.678 · PHDI (0–1). UNDP Human Development Report Office, 2023 edition, data for 2023.
Published values in that edition run from 0.276 to 0.827; higher is better.
Position 41st of 156 — derived here by ordering the published values, 1st = best. The publisher ranks no country on this.
Statistical Performance IndicatorsWorld Bank Group · 2024 · world median 69.379.8669.3▼ Worsened since 2016
Ecuador: 79.86 · world median 69.3 · SPI overall score (0–100). World Bank Group, 2024 edition, data for 2024.
Published values in that edition run from 27.12 to 94.14; higher is better.
Position 66th of 188 — derived here by ordering the published values, 1st = best. The publisher ranks no country on this.
Cereal YieldFAO · 2023 · world median 3,0724,0253,072▲ Improved since 2013
Ecuador: 4,025 · world median 3,072 · Cereal yield (kg per hectare). Food and Agriculture Organization of the United Nations (FAO), 2023 edition, data for 2023.
Published values in that edition run from 23 to 29,147; higher is better.
Position 63rd of 179 — derived here by ordering the published values, 1st = best. The publisher ranks no country on this.
Expected Years of SchoolingUNDP Human Development Report Office · 2023 · world median 13.3414.8513.34No real change since 2013
Ecuador: 14.85 · world median 13.34 · Expected years of schooling. UNDP Human Development Report Office, 2023 edition, data for 2023.
Published values in that edition run from 5.635 to 21.69; higher is better.
Position 70th of 195 — derived here by ordering the published values, 1st = best. The publisher ranks no country on this.
Life Expectancy at BirthUN DESA Population Division · 2023 · world median 74.6377.3974.63No real change since 2013
Ecuador: 77.39 · world median 74.63 · Years a newborn would live at current death rates. UN DESA Population Division, 2023 edition, data for 2023.
Published values in that edition run from 54.46 to 86.37; higher is better.
Position 80th of 222 — derived here by ordering the published values, 1st = best. The publisher ranks no country on this.
Human Capital IndexWorld Bank Group · 2020 · world median 0.5640.5940.564▲ Improved since 2010
Ecuador: 0.594 · world median 0.564 · HCI score (0–1). World Bank Group, 2020 edition, data for 2020.
Published values in that edition run from 0.292 to 0.879; higher is better.
Position 74th of 172 — derived here by ordering the published values, 1st = best. The publisher ranks no country on this.
Inequality-adjusted Human Development IndexUNDP Human Development Report Office · 2023 · world median 0.6090.640.609No real change since 2013
Ecuador: 0.64 · world median 0.609 · IHDI (0–1). UNDP Human Development Report Office, 2023 edition, data for 2023.
Published values in that edition run from 0.226 to 0.923; higher is better.
Position 76th of 169 — derived here by ordering the published values, 1st = best. The publisher ranks no country on this.
Infant Mortality RateUN IGME · 2024 · world median 12.2610.9512.26▼ Worsened since 2014
Ecuador: 10.95 · world median 12.26 · Deaths before age one (per 1,000 live births). UN Inter-agency Group for Child Mortality Estimation (UN IGME), 2024 edition, data for 2024.
Published values in that edition run from 1.214 to 71.87; lower is better.
Position 111th of 200 — derived here by ordering the published values, 1st = worst. The publisher ranks no country on this.
Under-Five Mortality RateUN IGME · 2024 · world median 14.5412.8814.54No real change since 2014
Ecuador: 12.88 · world median 14.54 · Deaths before age five (per 1,000 live births). UN Inter-agency Group for Child Mortality Estimation (UN IGME), 2024 edition, data for 2024.
Published values in that edition run from 1.26 to 115.65; lower is better.
Position 110th of 200 — derived here by ordering the published values, 1st = worst. The publisher ranks no country on this.
Coefficient of Human InequalityUNDP Human Development Report Office · 2023 · world median 17.0517.0217.05No real change since 2013
Ecuador: 17.02 · world median 17.05 · Coefficient of Human Inequality (%). UNDP Human Development Report Office, 2023 edition, data for 2023.
Published values in that edition run from 4.865 to 43.08; lower is better.
Position 86th of 169 — derived here by ordering the published values, 1st = worst. The publisher ranks no country on this.
Behind the world median14
Statistics on which Ecuador does worse than the middle country measured.
GNI per Capita (PPP)World Bank Group · 2025 · world median 14,27314,25614,273▲ Improved since 2015
Ecuador: 14,256 · world median 14,273 · GNI per capita (constant 2021 international $, PPP). World Bank Group, 2025 edition, data for 2025.
Published values in that edition run from 1,181 to 116,633; higher is better.
Position 52nd of 102 — derived here by ordering the published values, 1st = best. The publisher ranks no country on this.
Gender Inequality IndexUNDP Human Development Report Office · 2023 · world median 0.3510.3580.351▲ Improved since 2013
Ecuador: 0.358 · world median 0.351 · GII (0 = full equality, 1 = maximum inequality). UNDP Human Development Report Office, 2023 edition, data for 2023.
Published values in that edition run from 0.003 to 0.838; lower is better.
Ranked 88th of 172 by UNDP Human Development Report Office.
Exclusive Breastfeeding Under Six MonthsUNICEF · 2024 · world median 40.7439.640.74No earlier reading
Ecuador: 39.6 · world median 40.74 · Infants under 6 months exclusively breastfed (%). UNICEF, 2024 edition, data for 2024.
Published values in that edition run from 3.497 to 83.3; higher is better.
Position 75th of 136 — derived here by ordering the published values, 1st = best. The publisher ranks no country on this.
GDP per Capita (PPP)World Bank Group · 2025 · world median 17,26514,31917,265▼ Worsened since 2015
Ecuador: 14,319 · world median 17,265 · GDP per capita (constant 2021 international $, PPP). World Bank Group, 2025 edition, data for 2025.
Published values in that edition run from 1,067 to 139,593; higher is better.
Position 105th of 185 — derived here by ordering the published values, 1st = best. The publisher ranks no country on this.
Stunting Prevalence in Children Under FiveUNICEF, WHO and World Bank Group (Joint Malnutrition Estimates) · 2024 · world median 13.817.4513.8No earlier reading
Ecuador: 17.45 · world median 13.8 · Children under 5 who are stunted (%). UNICEF, WHO and World Bank Group (Joint Malnutrition Estimates), 2024 edition, data for 2024.
Published values in that edition run from 0.518 to 52.8; lower is better.
Position 70th of 162 — derived here by ordering the published values, 1st = worst. The publisher ranks no country on this.
Mean Years of SchoolingUNDP Human Development Report Office · 2023 · world median 9.9338.979.933No real change since 2013
Ecuador: 8.97 · world median 9.933 · Mean years of schooling (adults 25+). UNDP Human Development Report Office, 2023 edition, data for 2023.
Published values in that edition run from 1.412 to 14.3; higher is better.
Position 113th of 193 — derived here by ordering the published values, 1st = best. The publisher ranks no country on this.
Account Ownership at a Financial InstitutionWorld Bank Group · 2024 · world median 72.8364.5172.83▼ Worsened since 2014
Ecuador: 64.51 · world median 72.83 · Adults with an account (% of population aged 15+). World Bank Group, 2024 edition, data for 2024.
Published values in that edition run from 14.83 to 99.85; higher is better.
Position 82nd of 139 — derived here by ordering the published values, 1st = best. The publisher ranks no country on this.
Child MarriageUNICEF · 2025 · world median 17.122.217.1No earlier reading
Ecuador: 22.2 · world median 17.1 · Women 20–24 married before 18 (%). UNICEF, 2025 edition, data for 2025.
Published values in that edition run from 0 to 76.3; lower is better.
Position 60th of 143 — derived here by ordering the published values, 1st = worst. The publisher ranks no country on this.
Access to ElectricityWorld Bank Group · 2024 · world median 10098.5100▼ Worsened since 2014
Ecuador: 98.5 · world median 100 · Population with electricity access (%). World Bank Group, 2024 edition, data for 2024.
Published values in that edition run from 5.4 to 100; higher is better.
Completeness of Birth RegistrationUNICEF · 2025 · world median 98.488.298.4No earlier reading
Ecuador: 88.2 · world median 98.4 · Children under 5 whose birth is registered (%). UNICEF, 2025 edition, data for 2025.
Published values in that edition run from 2.7 to 100; higher is better.
Prosperity GapWorld Bank Group · 2023 · world median 1.7543.2561.754▼ Worsened since 2013
Ecuador: 3.256 · world median 1.754 · Average factor incomes must rise by to reach $28 a day. World Bank Group, 2023 edition, data for 2023.
Published values in that edition run from 0.406 to 12.06; lower is better.
Position 17th of 60 — derived here by ordering the published values, 1st = worst. The publisher ranks no country on this.
Poverty Headcount Ratio at $8.30 a DayWorld Bank Group · 2023 · world median 7.8230.827.82▼ Worsened since 2013
Ecuador: 30.82 · world median 7.82 · Population below $8.30 a day, 2021 PPP (%). World Bank Group, 2023 edition, data for 2023.
Published values in that edition run from 0.07 to 93.58; lower is better.
Position 16th of 59 — derived here by ordering the published values, 1st = worst. The publisher ranks no country on this.
Poverty Headcount Ratio at $3.00 a DayWorld Bank Group · 2023 · world median 0.934.680.93▼ Worsened since 2013
Ecuador: 4.68 · world median 0.93 · Population below $3.00 a day, 2021 PPP (%). World Bank Group, 2023 edition, data for 2023.
Published values in that edition run from 0 to 54.36; lower is better.
Position 11th of 58 — derived here by ordering the published values, 1st = worst. The publisher ranks no country on this.
Poverty Gap at $3.00 a DayWorld Bank Group · 2023 · world median 0.3451.470.345▼ Worsened since 2013
Ecuador: 1.47 · world median 0.345 · Poverty gap at $3.00 a day, 2021 PPP (%). World Bank Group, 2023 edition, data for 2023.
Published values in that edition run from 0 to 19.95; lower is better.
Position 10th of 59 — derived here by ordering the published values, 1st = worst. The publisher ranks no country on this.
No better end2
These describe the shape of a country — more is not better or worse, only different — so they are never ahead or behind.
Manufacturing Value Added (% of GDP)World Bank Group · 2025 · world median 11.2613.2411.26Moved since 2015
Ecuador: 13.24 · world median 11.26 · Manufacturing value added (% of GDP). World Bank Group, 2025 edition, data for 2025.
Published values in that edition run from 0.481 to 43.97.
Position 49th of 132 — derived here by ordering the published values, counted from the highest value. The publisher ranks no country on this.
Net Official Development Assistance ReceivedOECD Development Assistance Committee · 2023 · world median 2.5790.472.579Moved since 2013
Ecuador: 0.47 · world median 2.579 · Net ODA received (% of GNI). OECD Development Assistance Committee, 2023 edition, data for 2023.
Published values in that edition run from -0.001 to 101.78.
Position 102nd of 130 — derived here by ordering the published values, counted from the highest value. The publisher ranks no country on this.
No current reading for Ecuador
Children with Functional Difficulties, Country Policy and Institutional Assessment and Violent Discipline of Children. Listed rather than hidden, so the page can be checked against it.
05Country Index 2026
Development & Human Capital among Ecuador’s 16 topics
Development & Human Capital is Ecuador’s 9th best-placed topic of 16. Strongest first; each marker sits at the position divided by that topic’s field, so fields of different sizes compare fairly.
- Energyjoint 41st of 1933/3 keys
- Environment & Sustainabilityjoint 41st of 1812/3 keys
- Work & Labour46th of 1824/4 keys
- Gender & Equality58th of 1834/4 keys
- Education & Knowledge64th of 1713/4 keys
- Digital & Technology86th of 1983/3 keys
- Economy & Innovation90th of 1764/4 keys
- Health & Wellbeing104th of 2004/4 keys
- Development & Human Capital102nd of 1963/3 keys
- Governance & Institutions103rd of 1944/4 keys
- Democracy & Civil Liberties115th of 1983/3 keys
- Food & Agriculture103rd of 1754/4 keys
- Mobility & Trade97th of 1472/3 keys
- Peace & Security134th of 1774/4 keys
- Poverty & Inequality129th of 1592/2 keys
- Risk & Resilience172nd of 1923/3 keys
06The top of the list
Who leads on development & human capital
The three countries placed highest of 196, and the leaders Ecuador can most readily be measured against.
 1
1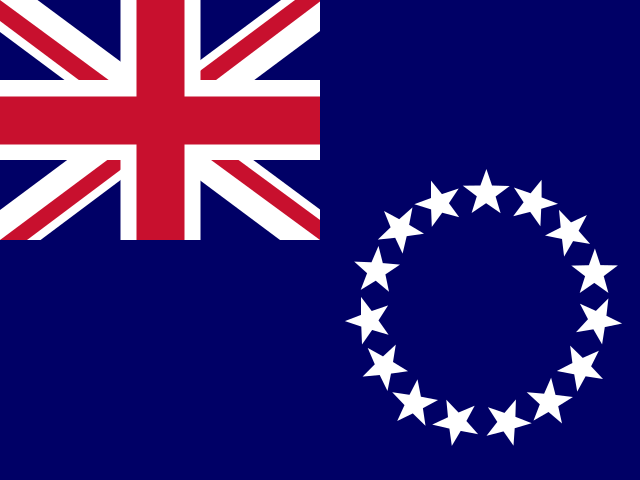 Cook Islands
Polynesia
1st of 196 · 2 of 3 keys
Photo: Benedict Adam · CC BY 2.0, greyscale
 2
2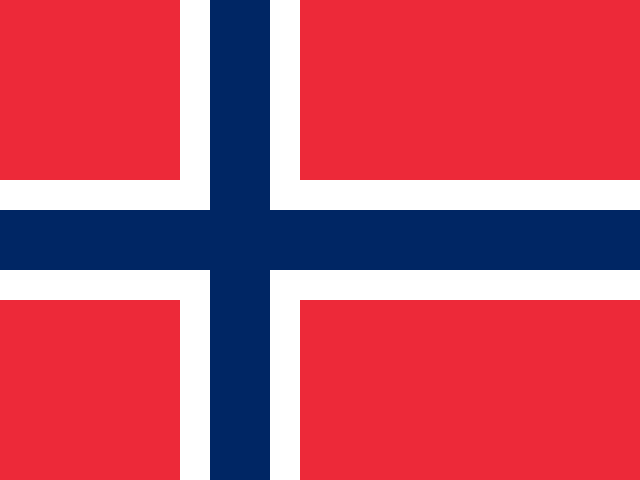 Norway
Northern Europe
2nd of 196 · 3 of 3 keys
Photo: Ximonic , Simo Räsänen · CC BY-SA 3.0, greyscale
 3
3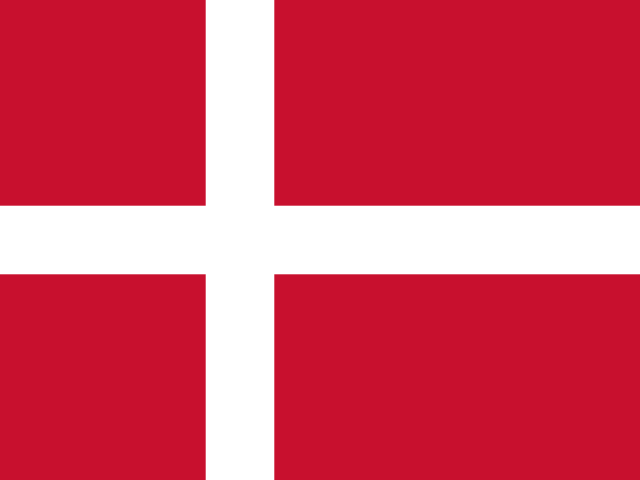 Denmark
Northern Europe
3rd of 196 · 3 of 3 keys
Photo: User:Aconcagua · CC BY-SA 3.0, greyscale
Placed highest nearby
Highest in Americas
 Canada27th3/3 keys
Highest in South America
 Uruguay45th3/3 keys
This page
Ecuador102nd3/3 keys
Positions out of 196 placed on the topic. A country needs readings on enough keys to be placed, and the top of the list is often held on fewer of them.
07Analysis
Charts and analysis about Ecuador and development & human capital

On development & human capital
Global Hunger Index 2025: Countries with the Most Alarming Hunger Crisis
Thirteen countries scored across four editions — 2000, 2008, 2016 and 2025 — and five the report could not score at all. DR Congo and South Sudan share 121st place on 37.5.

On development & human capital
India vs Pakistan 2025: Comparison of Hunger Index, Happiness, HDI, Rule of Law, Literacy & GDP
India and Pakistan on six published measures: hunger, happiness, human development, rule of law, literacy and GDP per capita. India is the better placed on five of them; Pakistan on one.
08Questions
Ecuador on development & human capital: questions answered
Every answer is built from the numbers on this page, so none can say something the page does not.
How does Ecuador rank on development & human capital?
Ecuador is placed 102nd of 196 countries on Development & Human Capital in the Country Index 2026, from 3 of its 3 key statistics (Social Protection Coverage, Maternal Mortality Ratio and Human Development Index). The position is this site’s ordering of published statistics, not a rank any publisher printed.
What is the latest Social Protection Coverage figure for Ecuador?
46.8 in 2025 (population covered by at least one social protection benefit (%)), according to International Labour Organization (ILO). The world median in the same edition was 52.1.
What is the latest Maternal Mortality Ratio figure for Ecuador?
55.37 in 2023 (maternal deaths per 100,000 live births), according to UN Maternal Mortality Estimation Inter-Agency Group (MMEIG). The world median in the same edition was 46.65.
How does Ecuador compare with Colombia on development & human capital?
Colombia is placed 94th of 196, and Ecuador 102nd. Social Protection Coverage: Colombia 58.3, Ecuador 46.8; Maternal Mortality Ratio: Colombia 59.38, Ecuador 55.37; Human Development Index: Colombia 0.788, Ecuador 0.777.
How have Ecuador’s development & human capital figures changed?
Maternal Mortality Ratio fell from 122.74 in 2000 to 55.37 in 2023; Human Development Index rose from 0.683 in 2000 to 0.777 in 2023.
Which development & human capital statistics are missing for Ecuador?
No current reading is published for Ecuador on Children with Functional Difficulties, Country Policy and Institutional Assessment and Violent Discipline of Children. They are listed rather than hidden, so the evidence on the page can be checked against it.
09Keep reading
Explore further
Ecuador, topic by topic
- Governance & Institutions103rd of 194
- Economy & Innovation90th of 176
- Work & Labour46th of 182
- Education & Knowledge64th of 171
- Health & Wellbeing104th of 200
- Environment & Sustainability=41st of 181
- Gender & Equality58th of 183
- Democracy & Civil Liberties115th of 198
- Peace & Security134th of 177
- Risk & Resilience172nd of 192
- Mobility & Trade97th of 147
- Food & Agriculture103rd of 175
- Poverty & Inequality129th of 159
- Energy=41st of 193
- Digital & Technology86th of 198
- The full Ecuador profile
Nearby, on development & human capital
The key statistics, for every country
10Method
Method, sources and how to cite
What this topic does not measure
Poverty lines, inequality and aid received are published here as context rather than as keys, often because they cover fewer countries or are measured too rarely. Development is also not the same as economic size or growth, which belong to Economy & Innovation.
How the Development & Human Capital standing is decided, step by step
A standing is a place in a list, not a mark out of anything. This one is part of the Country Index 2026, and it is worked out like this.
- A few key indicators decide it; the rest are context. 3 indicators on this topic are keys and 31 are charted alongside them without a vote. That split is the point: if every statistic voted, importing five more of one kind would quietly change what the topic is about.
- Each key is read at one edition. ⚠ The keys behind this standing do not all describe the same year — they run from 2023 to 2025, because publishers release on their own schedules. Read the standing as “how this country places now”, not as a snapshot of one year.
- Every country’s published value is turned into a place within that one key’s own field, and then expressed as a share of that field — how far down this key’s list the country sits, rather than how many countries are above it. Keys where a higher published number is worse (terrorism, hunger, disaster risk) are turned round first, so the good end is always the same end.
- Dividing by the field first is the whole reason this works. A place carries the size of its list inside it: 22nd of 44 and 108th of 215 are the same showing, and averaging the numbers 22 and 108 says loudly that they are not. Fields on this site run from about 44 countries to about 215, so averaging raw places would reward a country for happening to be measured in small ones. Dividing each place by its own field removes the size and leaves only the showing.
- The shares are averaged, plainly. One key, one vote — no key is weighted above another, because any weighting would be this site’s opinion presented as a measurement. Countries are then put in order by that average, and the average itself is never published. It is our arithmetic with nothing anchoring it, so printing it would invite it to be read as a measurement somebody made. The position it produces, the band, and the keys it was built from are all published instead — every one of them checkable against the tables on this page.
- A country needs 2 of this topic’s 3 keys — half, rounded up, and never fewer than 2. A standing built from one reading, printed beside one built from four, is two different things sharing a column heading. 196 countries clear the bar here.
- A key has to earn its vote every edition. It must measure at least 120 countries (below that it starts measuring who was surveyed rather than the world), it must not have more than 10% of its field tied at either end, and it must not repeat another key in the same topic — Spearman correlation above 0.92 counts as repeating. A topic needs at least 2 surviving keys to place anyone at all; this one has 3.
- A standing is relative, and the grouping is ours. It says where a country places against the others measured alongside it, so it moves when they move. The publishers listed on this page did not agree to be read together, and each measures its subject its own way: the underlying numbers are theirs, the ordering on top is this site’s — the same method as the rest of the Country Index, applied to one subject instead of all of them.
The key statistics and their licences
- Social Protection Coverage — International Labour Organization (ILO), CC BY 4.0
- Maternal Mortality Ratio — UN Maternal Mortality Estimation Inter-Agency Group (MMEIG), CC BY 3.0 IGO
- Human Development Index — UNDP Human Development Report Office, CC BY 3.0 IGO
The other 28 statistics on this page come from 9 publishers, each named beside its numbers, with every edition and licence on the datasets pages.
The standing itself is part of the Country Index 2026, published under CC BY-SA 4.0.
Photographs
Ecuador’s banner and the countries placed highest, from their profiles: Wikimedia Commons, shown in greyscale, each used under the licence named.
- Ecuador (banner) — Phelipemancheno, CC0
- Cook Islands — Benedict Adam, CC BY 2.0
- Norway — Ximonic , Simo Räsänen, CC BY-SA 3.0
- Denmark — User:Aconcagua, CC BY-SA 3.0
Cite this page
Nations Inquiry (2026). Ecuador: Development & Human Capital — standing and statistics, Country Index 2026. https://nationsinquiry.com/countries/ecuador/development