UNDP Human Development Report Office · Expected Years of Schooling
Expected years of schooling by country
How many years of education can a child starting school today expect?
Monaco placed first of the 195 countries compared in 2023, at 21.687, and South Sudan last, at 5.635. In the middle country the figure was 13.336. Among the 170 countries measured in every edition since 1990, the middle one moved from 10.634 to 13.668.
Expected years of schooling · 2023
Context statistic
Highest of 195Monaco
21.687012023 · position · derived
Who leads
The three countries at the highest end of 195 compared, the three at the other end, and the first on each continent.
 1
1Photo: Martin Weber derivative work: Jjtkk · CC BY-SA 3.0, greyscale
 2
2Photo: User:Ggia derivative work: Jjtkk · CC BY-SA 3.0, greyscale
 3
3Photo: tiimta · CC BY-SA 3.0, greyscale
Lowest in 2023
- 195
 South Sudan5.635
 - 194
 Djibouti6.207
 - 193
 Mali7.011
Positions out of 195. Where a country sits says how it compares with the others measured, and nothing about why.
02Every measured country
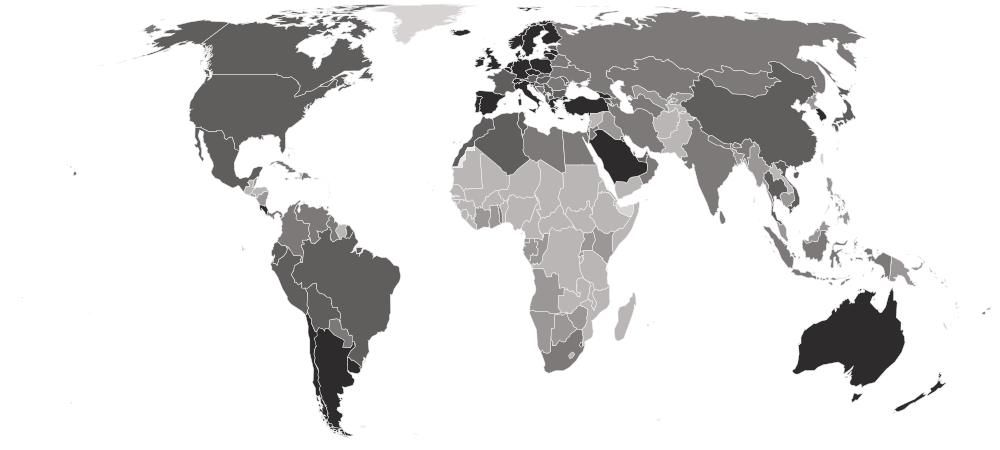
Expected years of schooling on a map
Each country is shaded by its value, in five groups holding the same number of countries. Hover a country for its value, or select it to open its profile. Below the map, each continent’s middle country.
Darker is a higher value — the better end.
- 5.635–11.021
- 11.057–12.857
- 12.910–14.358
- 14.384–16.348
- 16.350–21.687
- No reading in 2023
- Europe
16.348
the middle country, of 43 measured · 49 members
Monaco21.687 Bosnia and Herzegovina13.164
Highest and lowest reading in Europe.
- Americas
14.238
the middle country, of 35 measured · 48 members
 Argentina18.831
 Honduras10.162
Highest and lowest reading in Americas.
- Asia
13.241
the middle country, of 49 measured · 52 members
 Türkiye19.831
 Syria7.419
Highest and lowest reading in Asia.
- Oceania
12.640
the middle country, of 14 measured · 21 members
 Australia20.655
 Solomon Islands11.313
Highest and lowest reading in Oceania.
- Africa
10.949
the middle country, of 54 measured · 55 members
 Seychelles18.225South Sudan5.635
Highest and lowest reading in Africa.
- Every region
22 sub-regions, highest middle country first
- Northern Europe
18.748
the middle country, of 10 measured · 13 members
 Finland19.494
 Estonia15.968
Highest and lowest reading in Northern Europe.
- Western Europe
16.668
the middle country, of 9 measured · 9 members
Monaco21.687 Luxembourg14.358
Highest and lowest reading in Western Europe.
- Southern Europe
15.723
the middle country, of 14 measured · 17 members
 Greece20.846Bosnia and Herzegovina13.164
Highest and lowest reading in Southern Europe.
- Eastern Asia
15.495
the middle country, of 6 measured · 8 members
 Hong Kong16.896
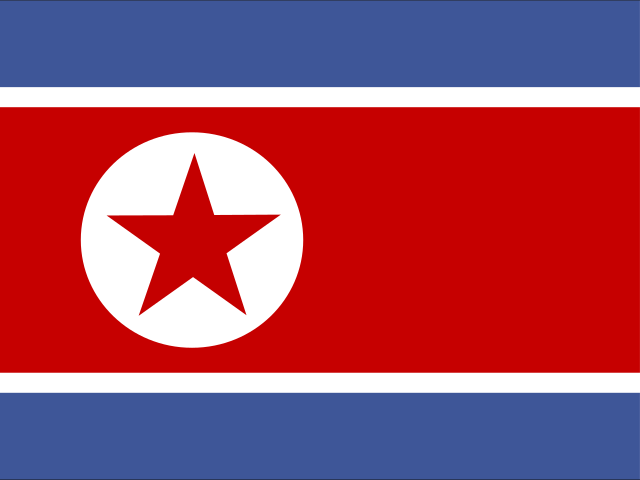 North Korea12.202
Highest and lowest reading in Eastern Asia.
- South America
14.881
the middle country, of 12 measured · 12 members
Argentina18.831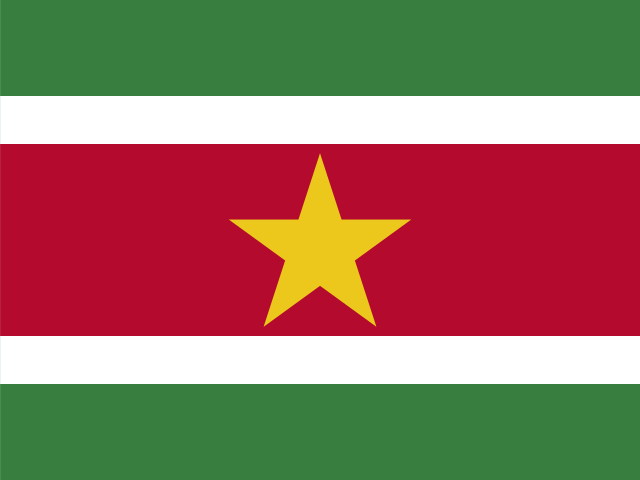 Suriname10.959
Highest and lowest reading in South America.
- Eastern Europe
14.793
the middle country, of 10 measured · 10 members
 Czechia16.794
 Russia13.185
Highest and lowest reading in Eastern Europe.
- Caribbean
14.151
the middle country, of 13 measured · 24 members
 Saint Kitts and Nevis18.407
 Haiti10.896
Highest and lowest reading in Caribbean.
- Western Asia
13.912
the middle country, of 18 measured · 19 members
Türkiye19.831Syria7.419Highest and lowest reading in Western Asia.
- Northern Africa
13.900
the middle country, of 6 measured · 6 members
 Algeria15.495
 Sudan8.620
Highest and lowest reading in Northern Africa.
- South-eastern Asia
13.253
the middle country, of 11 measured · 11 members
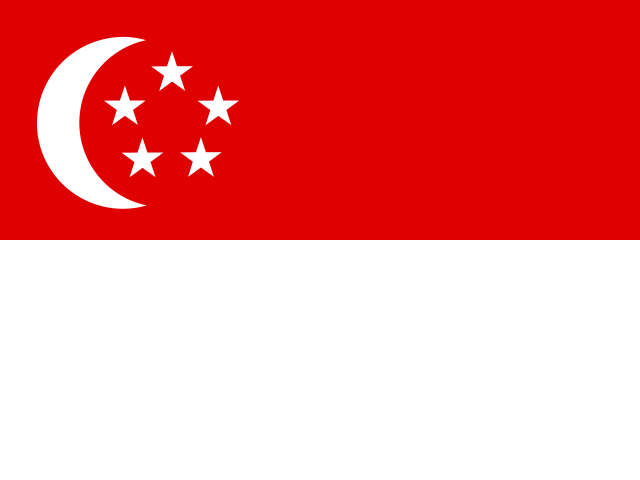 Singapore16.742
 Laos9.605
Highest and lowest reading in South-eastern Asia.
- Southern Asia
12.955
the middle country, of 9 measured · 9 members
 Iran13.968
 Pakistan7.895
Highest and lowest reading in Southern Asia.
- Micronesia
12.843
the middle country, of 5 measured · 7 members
 Marshall Islands16.386
 Micronesia11.540
Highest and lowest reading in Micronesia.
- Central Asia
12.714
the middle country, of 5 measured · 5 members
 Kazakhstan14.009
 Tajikistan10.850
Highest and lowest reading in Central Asia.
- Middle Africa
12.168
the middle country, of 9 measured · 9 members
 São Tomé and Príncipe12.857
 Central African Republic7.436
Highest and lowest reading in Middle Africa.
- Southern Africa
11.785
the middle country, of 5 measured · 5 members
 Eswatini15.246
 Lesotho10.987
Highest and lowest reading in Southern Africa.
- Central America
11.747
the middle country, of 8 measured · 8 members
 Costa Rica16.350Honduras10.162
Highest and lowest reading in Central America.
- Western Africa
10.420
the middle country, of 16 measured · 16 members
 Togo13.096Mali7.011
Highest and lowest reading in Western Africa.
- Eastern Africa
10.375
the middle country, of 18 measured · 19 members
Seychelles18.225South Sudan5.635Highest and lowest reading in Eastern Africa.
- Australia and New Zealand
2 of 2 measured — too few for a middle: Australia, New Zealand.
Australia20.655 New Zealand19.300
Highest and lowest reading in Australia and New Zealand.
- Melanesia
4 of 5 measured — too few for a middle: Fiji, Papua New Guinea, Solomon Islands, Vanuatu.
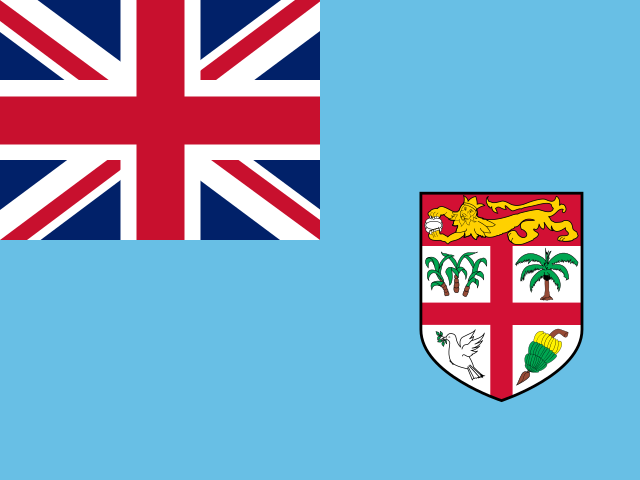 Fiji13.849Solomon Islands11.313
Highest and lowest reading in Melanesia.
- Northern America
2 of 4 measured — too few for a middle: Canada, United States.
 United States15.923
 Canada15.888
Highest and lowest reading in Northern America.
- Polynesia
3 of 7 measured — too few for a middle: Samoa, Tonga, Tuvalu.
 Tonga17.787
 Tuvalu12.375
Highest and lowest reading in Polynesia.
03The whole field at once
The spread
195 countries, one dot each, on one scale — further right is a higher value. Half the countries are above 13.336; a quarter are above 15.896, and a quarter below 11.507. The bar in each row marks that continent’s middle country.
04All 195 ever measured
Every country
In order, highest value first. “=” marks a position shared with another country. UNDP Human Development Report Office ranks nobody on this measure; the position is derived here by ordering the published values. Read it beside mean years of schooling: a country that has recently widened access scores well here long before its adults’ schooling catches up, and the gap between the two says how far that change still has to travel.
Showing 25 of 195 countries
















































































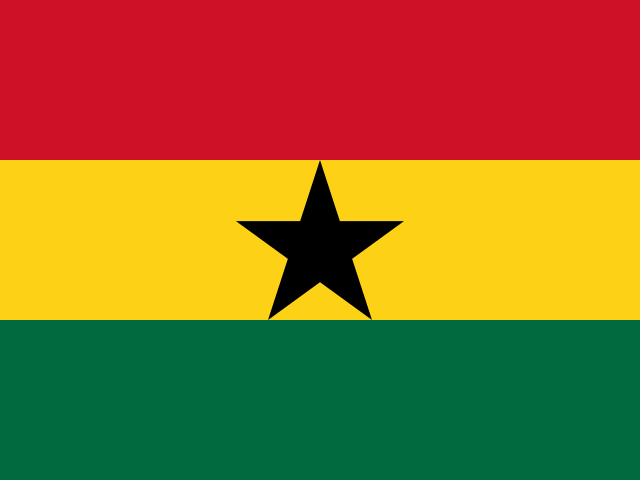


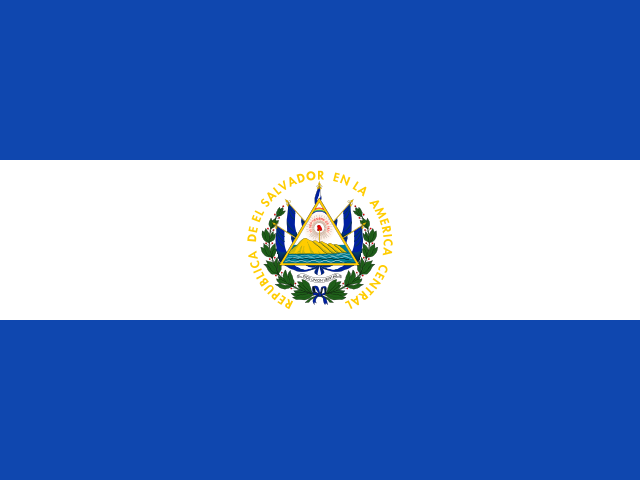





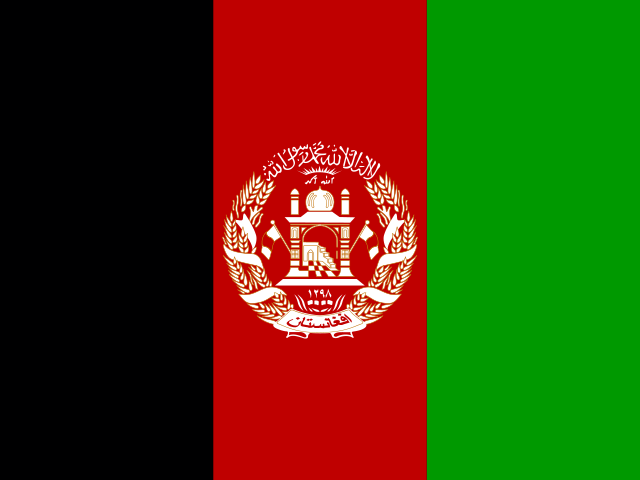








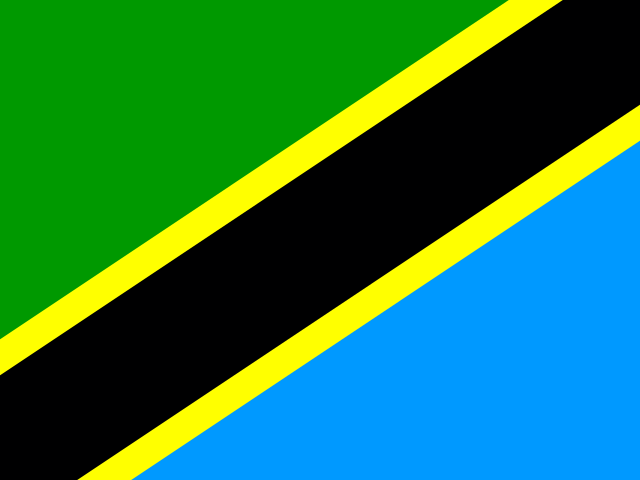




Values for 2023. The change column compares 2023 with 2022 only; the sparkline covers the recent editions.
051990–2023 · 34 reference years
Over time
Each point is a reference year recalculated in the 2025 Human Development Report on one method, so the line can be read across its whole length. It is a projection of current enrolment, not a record of what anyone completed.
- the middle country
- the middle half of countries
- the middle of the 170 countries measured every time
- each continent’s middle country
The same, year by year
| Year | Countries | Middle country | Middle half | Measured every time |
|---|---|---|---|---|
| 2023 | 195 | 13.336 | 11.507 – 15.896 | 13.668 |
| 2022 | 195 | 13.294 | 11.489 – 15.896 | 13.517 |
| 2021 | 194 | 13.303 | 11.518 – 15.838 | 13.438 |
| 2020 | 194 | 13.307 | 11.498 – 15.673 | 13.445 |
| 2019 | 194 | 13.462 | 11.480 – 15.604 | 13.582 |
| 2018 | 194 | 13.580 | 11.481 – 15.600 | 13.662 |
| 2017 | 194 | 13.533 | 11.450 – 15.516 | 13.687 |
| 2016 | 194 | 13.549 | 11.393 – 15.320 | 13.591 |
| 2015 | 194 | 13.395 | 11.183 – 15.409 | 13.506 |
| 2014 | 194 | 13.252 | 11.218 – 15.410 | 13.305 |
| 2013 | 194 | 13.217 | 11.074 – 15.238 | 13.300 |
| 2012 | 194 | 13.217 | 11.026 – 15.125 | 13.276 |
| 2011 | 194 | 13.043 | 10.999 – 15.150 | 13.183 |
| 2010 | 194 | 12.915 | 10.821 – 15.106 | 13.029 |
| 2009 | 191 | 12.818 | 10.678 – 14.867 | 12.861 |
| 2008 | 191 | 12.568 | 10.419 – 14.850 | 12.722 |
| 2007 | 191 | 12.416 | 10.299 – 14.655 | 12.576 |
| 2006 | 190 | 12.225 | 10.211 – 14.557 | 12.392 |
| 2005 | 190 | 12.035 | 10.046 – 14.372 | 12.167 |
| 2004 | 185 | 11.939 | 9.910 – 14.298 | 11.995 |
| 2003 | 185 | 11.810 | 9.707 – 14.126 | 11.913 |
| 2002 | 185 | 11.739 | 9.403 – 13.899 | 11.758 |
| 2001 | 184 | 11.605 | 8.984 – 13.566 | 11.641 |
| 2000 | 184 | 11.477 | 9.016 – 13.433 | 11.520 |
| 1999 | 174 | 11.377 | 8.438 – 13.203 | 11.452 |
| 1998 | 173 | 11.252 | 8.356 – 12.981 | 11.268 |
| 1997 | 173 | 11.061 | 8.253 – 12.612 | 11.065 |
| 1996 | 173 | 10.933 | 8.150 – 12.614 | 10.954 |
| 1995 | 173 | 10.814 | 8.091 – 12.442 | 10.817 |
| 1994 | 170 | 10.635 | 7.909 – 12.240 | 10.635 |
| 1993 | 170 | 10.644 | 7.933 – 12.025 | 10.644 |
| 1992 | 170 | 10.666 | 7.940 – 12.258 | 10.666 |
| 1991 | 170 | 10.725 | 7.838 – 12.421 | 10.725 |
| 1990 | 170 | 10.634 | 7.595 – 12.524 | 10.634 |
062022 → 2023
Who rose and fell
The biggest changes in value between the two newest editions — reference years recalculated in one report, not two separate publications. Places are shown second, because they also move when other countries do.
Improved most
before → after Andorra12.784 → 14.543 · 118th → 75th+1.759
 Nepal12.464 → 13.754 · 127th → 92nd+1.291
 Côte d’Ivoire10.206 → 11.411 · 171st → 151st+1.205
 United Arab Emirates14.908 → 15.602 · 68th → 53rd+0.694
 Morocco14.594 → 15.075 · 75th → 65th+0.481
195 countries were measured in both 2022 and 2023.
07Across every edition
Expected years of schooling in records
The extremes of the statistic. A record reached by more than one country names none of them.
Highest reading on record
23.248
Expected years of schooling
Lowest reading on record
1.942
Expected years of schooling
Biggest improvement between editions
+3.645
6.838 → 10.483
Biggest decline between editions
−3.860
12.257 → 8.397
Most improved since first measured
+10.909
8.922 → 19.831
At the top most often
29 of 34
editions, alone at the first-listed end
08The measure
About expected years of schooling
Expected years of schooling is how many years of education a child starting school today can expect to receive, if current enrolment rates hold for the rest of their schooling. It is the forward-looking half of the Human Development Index’s education dimension, published by UNDP.
What the number is: Expected years of schooling.
09Where it fits
Connections
Its part in the Country Index, the statistics whose values line up most closely with it across countries, and others on the same subject.
In the Country Index
Context, with no vote
This statistic is published in full under Education & Knowledge and Development & Human Capital, but does not help decide any Country Index standing.
Education & KnowledgeDevelopment & Human CapitalWhich statistics vote, and why
Moves with
Where expected years of schooling is higher, these tend to be higher too.
- Human Development IndexKeyUNDP Human Development Report Office · 193 countries in commonρ 0.90
- Inequality-adjusted Human Development IndexUNDP Human Development Report Office · 169 countries in commonρ 0.88
- GNI per Capita (PPP)World Bank Group · 101 countries in commonρ 0.87
Moves against
Where expected years of schooling is higher, these tend to be lower.
- Gender Inequality IndexUNDP Human Development Report Office · 172 countries in commonρ −0.84
- Informal Employment RateILO · 96 countries in commonρ −0.81
- Learning PovertyWorld Bank Group and UNESCO Institute for Statistics · 106 countries in commonρ −0.81
Rank correlation (ρ, from −1 to 1) across countries, on each statistic’s newest edition, out of 190 statistics sharing at least 80 countries with this one. Two statistics that move together do not cause each other.
10Keep reading
Explore further
11Questions
Expected years of schooling: questions and answers
Which country has the highest expected years of schooling?
Monaco, at 21.687, among the 195 countries compared in 2023.
Which country has the lowest expected years of schooling?
South Sudan, at 5.635, among the 195 countries compared in 2023.
How many countries does the Expected Years of Schooling cover?
195 in 2023. The number measured varies from 170 to 195 between editions.
What is the world average expected years of schooling?
This site does not calculate a world average, which would depend on how countries are weighted. In the middle country of the 195 compared in 2023, the figure was 13.336.
Is this UNDP Human Development Report Office’s own ranking?
No. UNDP Human Development Report Office publishes the values but ranks nobody; the position on this page is derived by Nations Inquiry by ordering the published values, and equal values share a position.
How often is the Expected Years of Schooling published?
This site holds 34 reference years, 1990–2023, all recalculated in UNDP Human Development Report Office’s 2025 report on one method — not 34 separate publications.
Where does the data come from, and can I download it?
From UNDP Human Development Report Office, under CC BY 3.0 IGO. From UNDP’s Human Development Report composite-indices file. The 34 reference years come from one report, not 34 publications. UNDP publishes no rank for this figure. Every edition is on this site’s Datasets pages as a full table, and downloads as a CSV file with every value unrounded.
12Method
Sources, method and citation
Source
Expected Years of Schooling — UNDP Human Development Report Office
From UNDP’s Human Development Report composite-indices file. The 34 reference years come from one report, not 34 publications. UNDP publishes no rank for this figure.
Newest edition
Report year 2023Data year 2023
Cite the source as: UNDP. Human Development Report. New York: United Nations Development Programme.
Licence: CC BY 3.0 IGO, checked 2026-09-05.
How this page reads the numbers
- UNDP Human Development Report Office ranks nobody on this measure. The position is derived by Nations Inquiry by ordering the published values; equal values share a position.
- Which end is better follows the publisher’s own reading of the measure.
- A country is named at an end only when it holds that value alone. Where several share it, the page says how many and names none first.
- Values are stored exactly as published and trimmed only for display. “The middle country” is the median of the countries measured, not a world average.
The file itself, column by column — where it came from, what each column holds, and every edition as a CSV — is on its dataset page.
Photographs
The countries at the top of this statistic, from their profiles: Wikimedia Commons, shown in greyscale, each used under the licence named.
- Monaco — Martin Weber derivative work: Jjtkk, CC BY-SA 3.0
- Greece — User:Ggia derivative work: Jjtkk, CC BY-SA 3.0
- Australia — tiimta, CC BY-SA 3.0
Cite this page
Nations Inquiry (2026). Expected years of schooling by country: Expected Years of Schooling, data from UNDP Human Development Report Office. https://nationsinquiry.com/statistics/expected-years-schooling