Loading…
UN IGME · Under-Five Mortality Rate
Under-five mortality rate by country
How many children die before their fifth birthday?
Of the 200 countries compared in 2024, San Marino had the lowest reading, 1.260, and Nigeria had the highest reading, 115.649. In the middle country the figure was 14.539. Among the 81 countries measured in every edition since 1952, the middle one moved from 141.050 to 12.905.
Under-five mortality rate · 2024
Key statistic · Health & Wellbeing

Lowest of 200San Marino
1.260012024 · position · derived
Who leads
The three countries at the lowest end of 200 compared, the three at the other end, and the first on each continent.
 1
1Photo: Matl derivative work: Jjtkk · CC BY-SA 3.0, greyscale
 2
2Photo: Andrus Uuetalu derivative work: Jjtkk · CC BY-SA 3.0 ee, greyscale
 3
3Photo: Michal Osmenda from Brussels, Belgium · CC BY-SA 2.0, greyscale
Lowest on each continent
- Africa
 Libya9.765
 - Americas
- Asia
 Japan2.434
 - EuropeSan Marino1.260
- Oceania
 Australia3.607
 - Every region
02Every measured country
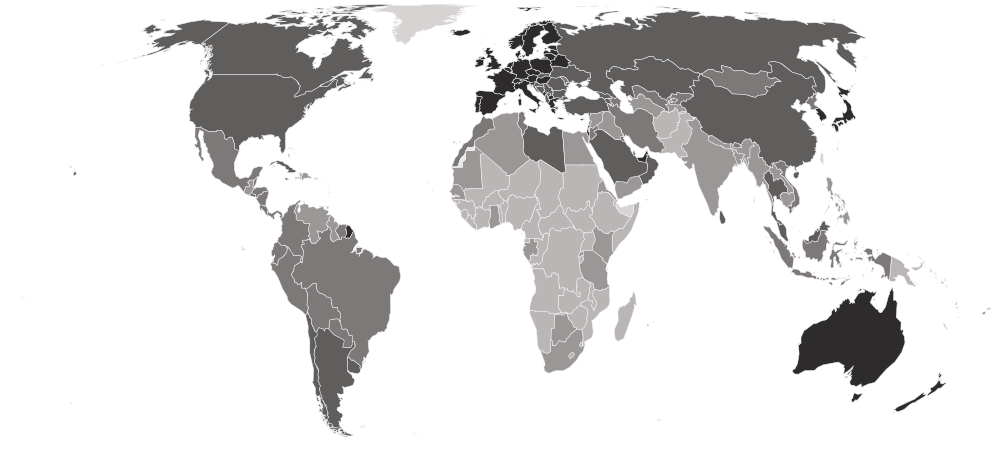
Under-five mortality rate on a map
Each country is shaded by its value, in five groups holding the same number of countries. Hover a country for its value, or select it to open its profile. Below the map, each continent’s middle country.
Darker is a lower value — the better end.
- 39.112–115.649
- 17.960–39.005
- 10.407–17.887
- 5.173–10.284
- 1.260–4.979
- No reading in 2024
- Europe
3.711
the middle country, of 43 measured · 49 members
San Marino1.260 Moldova16.460
Lowest and highest reading in Europe.
- Americas
12.884
the middle country, of 39 measured · 48 members
 Turks and Caicos Islands4.653
 Haiti52.753
Lowest and highest reading in Americas.
- Asia
13.385
the middle country, of 48 measured · 52 members
Japan2.434 Pakistan55.959
Lowest and highest reading in Asia.
- Oceania
19.594
the middle country, of 16 measured · 21 members
Australia3.607 Kiribati53.094
Lowest and highest reading in Oceania.
- Africa
48.538
the middle country, of 54 measured · 55 members
Libya9.765 Nigeria115.649
Lowest and highest reading in Africa.
- Every region
22 sub-regions, lowest middle country first
- Northern Europe
2.660
the middle country, of 10 measured · 13 members
 Estonia2.016
 United Kingdom4.680
Lowest and highest reading in Northern Europe.
- Southern Europe
3.228
the middle country, of 15 measured · 17 members
San Marino1.260 Albania9.227
Lowest and highest reading in Southern Europe.
- Western Europe
3.716
the middle country, of 8 measured · 9 members
 Luxembourg2.182
 France4.343
Lowest and highest reading in Western Europe.
- Eastern Europe
5.454
the middle country, of 10 measured · 10 members
 Belarus2.331Moldova16.460
Lowest and highest reading in Eastern Europe.
- Eastern Asia
5.724
the middle country, of 5 measured · 8 members
Japan2.434 North Korea16.666
Lowest and highest reading in Eastern Asia.
- Western Asia
9.596
the middle country, of 18 measured · 19 members
 Israel3.340
 Yemen38.143
Lowest and highest reading in Western Asia.
- Caribbean
12.376
the middle country, of 17 measured · 24 members
Turks and Caicos Islands4.653Haiti52.753Lowest and highest reading in Caribbean.
- Central America
12.855
the middle country, of 8 measured · 8 members
 El Salvador10.047
 Guatemala20.509
Lowest and highest reading in Central America.
- South America
13.561
the middle country, of 12 measured · 12 members
 Chile6.753
 Guyana25.210
Lowest and highest reading in South America.
- Polynesia
14.862
the middle country, of 5 measured · 7 members
 Tonga9.513
 Niue23.793
Lowest and highest reading in Polynesia.
- Central Asia
16.782
the middle country, of 5 measured · 5 members
 Kazakhstan9.437
 Turkmenistan39.005
Lowest and highest reading in Central Asia.
- South-eastern Asia
17.688
the middle country, of 11 measured · 11 members
 Singapore2.680
 Timor-Leste47.622
Lowest and highest reading in South-eastern Asia.
- Northern Africa
18.686
the middle country, of 6 measured · 6 members
Libya9.765 Sudan61.602
Lowest and highest reading in Northern Africa.
- Micronesia
22.422
the middle country, of 5 measured · 7 members
 Nauru8.261Kiribati53.094
Lowest and highest reading in Micronesia.
- Southern Asia
25.117
the middle country, of 9 measured · 9 members
 Maldives5.439Pakistan55.959
Lowest and highest reading in Southern Asia.
- Southern Africa
39.461
the middle country, of 5 measured · 5 members
 Botswana33.311
 Lesotho59.957
Lowest and highest reading in Southern Africa.
- Eastern Africa
47.711
the middle country, of 18 measured · 19 members
 Seychelles13.959
 Somalia101.066
Lowest and highest reading in Eastern Africa.
- Middle Africa
64.838
the middle country, of 9 measured · 9 members
 São Tomé and Príncipe13.554
 Chad97.258
Lowest and highest reading in Middle Africa.
- Western Africa
70.159
the middle country, of 16 measured · 16 members
 Cabo Verde11.139Nigeria115.649
Lowest and highest reading in Western Africa.
- Australia and New Zealand
2 of 2 measured — too few for a middle: Australia, New Zealand.
Australia3.607 New Zealand4.738
Lowest and highest reading in Australia and New Zealand.
- Melanesia
4 of 5 measured — too few for a middle: Fiji, Papua New Guinea, Solomon Islands, Vanuatu.
 Vanuatu17.144
 Papua New Guinea39.383
Lowest and highest reading in Melanesia.
- Northern America
2 of 4 measured — too few for a middle: Canada, United States.
 Canada5.427
 United States6.472
Lowest and highest reading in Northern America.
03The whole field at once
The spread
200 countries, one dot each, on one scale — further right is a higher value. Half the countries are above 14.539; a quarter are above 36.041, and a quarter below 5.884. The bar in each row marks that continent’s middle country.
04All 200 ever measured
Every country
In order, highest value first — position 1 is the highest value, the way UN IGME’s own tables read. “=” marks a position shared with another country. UN Inter-agency Group for Child Mortality Estimation (UN IGME) ranks nobody on this measure; the position is derived here by ordering the published values. The estimates carry full precision, so 200 economies hold 200 distinct values in 2024 and nothing ties.
Showing 25 of 200 countries













































































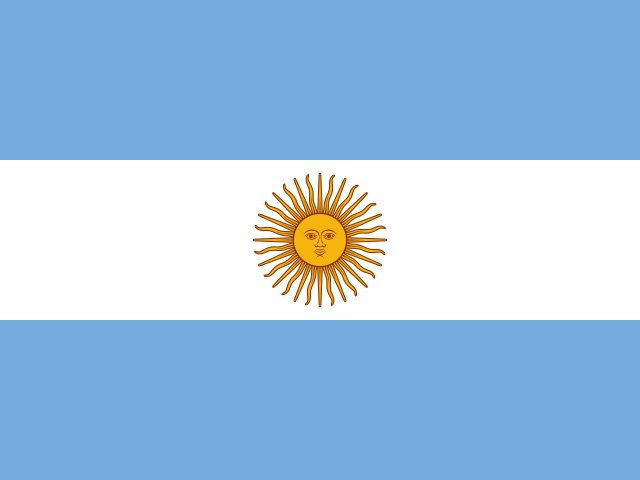





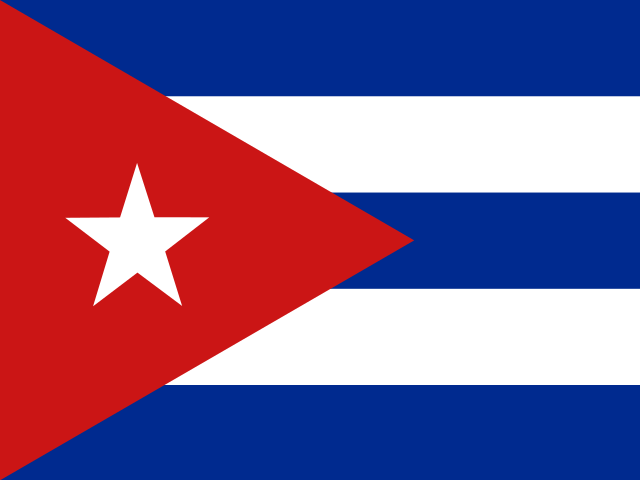







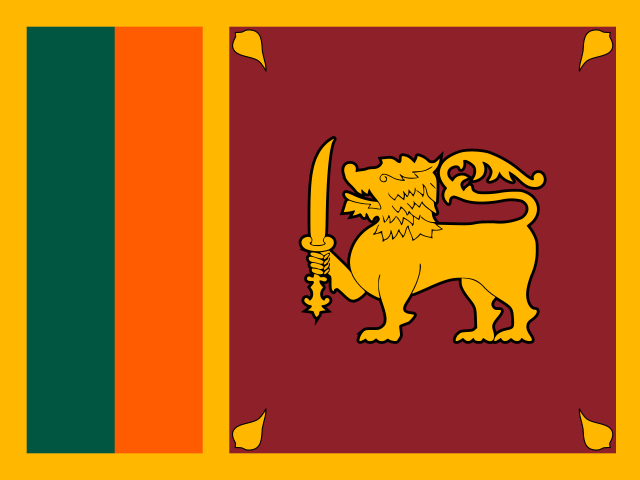




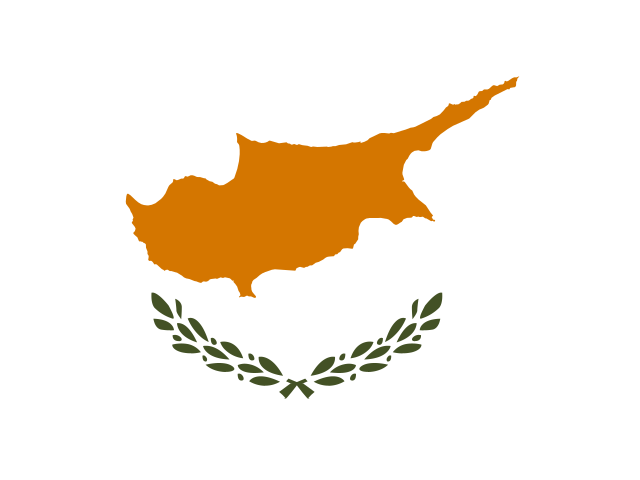


























Values for 2024. The change column compares 2024 with 2023 only; the sparkline covers the recent editions.
051952–2024 · 73 reference years
Over time
Each point is one year — 1952 to 2024, the longest continuous series on this site. These are modelled estimates fitted to whatever censuses, surveys and vital registration a country has, which is why every country has a figure for every year and why each carries published uncertainty bounds.
- the middle country
- the middle half of countries
- the middle of the 81 countries measured every time
- each continent’s middle country
The same, year by year
| Year | Countries | Middle country | Middle half | Measured every time |
|---|---|---|---|---|
| 2024 | 200 | 14.539 | 5.884 – 36.041 | 12.905 |
| 2023 | 200 | 15.239 | 6.086 – 37.423 | 13.302 |
| 2022 | 200 | 14.654 | 6.195 – 37.100 | 13.716 |
| 2021 | 200 | 15.073 | 6.413 – 38.440 | 14.116 |
| 2020 | 200 | 15.311 | 6.499 – 39.731 | 14.303 |
| 2019 | 200 | 15.696 | 6.804 – 41.042 | 14.325 |
| 2018 | 200 | 16.280 | 6.955 – 42.341 | 14.787 |
| 2017 | 200 | 16.785 | 7.271 – 43.449 | 14.714 |
| 2016 | 200 | 17.546 | 7.606 – 44.834 | 14.960 |
| 2015 | 200 | 17.855 | 7.868 – 46.461 | 15.453 |
| 2014 | 200 | 18.282 | 8.085 – 48.116 | 15.956 |
| 2013 | 200 | 18.742 | 8.231 – 49.492 | 16.496 |
| 2012 | 200 | 18.843 | 8.429 – 51.676 | 16.420 |
| 2011 | 200 | 18.975 | 8.609 – 53.146 | 16.030 |
| 2010 | 200 | 19.198 | 8.787 – 55.064 | 15.674 |
| 2009 | 200 | 20.792 | 8.998 – 57.319 | 17.104 |
| 2008 | 200 | 20.736 | 9.354 – 59.308 | 15.226 |
| 2007 | 200 | 21.789 | 9.526 – 62.254 | 15.852 |
| 2006 | 200 | 22.760 | 9.856 – 65.004 | 16.525 |
| 2005 | 200 | 23.957 | 10.480 – 68.274 | 17.248 |
| 2004 | 200 | 25.925 | 10.917 – 71.496 | 18.469 |
| 2003 | 200 | 26.928 | 11.244 – 75.852 | 18.441 |
| 2002 | 200 | 28.012 | 11.592 – 77.458 | 18.425 |
| 2001 | 200 | 29.052 | 12.049 – 80.419 | 18.440 |
| 2000 | 200 | 30.432 | 12.722 – 85.337 | 18.663 |
| 1999 | 200 | 31.566 | 13.237 – 91.241 | 19.473 |
| 1998 | 200 | 33.353 | 14.039 – 94.111 | 20.332 |
| 1997 | 200 | 34.933 | 14.246 – 97.527 | 21.224 |
| 1996 | 200 | 36.499 | 14.779 – 99.983 | 22.047 |
| 1995 | 200 | 37.876 | 15.332 – 104.292 | 22.700 |
| 1994 | 200 | 38.304 | 15.660 – 103.087 | 23.183 |
| 1993 | 200 | 40.591 | 16.784 – 106.580 | 23.487 |
| 1992 | 200 | 42.093 | 17.273 – 107.375 | 23.639 |
| 1991 | 200 | 42.849 | 17.472 – 105.670 | 23.724 |
| 1990 | 200 | 44.830 | 18.023 – 106.740 | 23.769 |
| 1989 | 200 | 47.203 | 18.189 – 111.161 | 25.233 |
| 1988 | 200 | 49.281 | 19.032 – 116.257 | 25.012 |
| 1987 | 200 | 51.934 | 20.420 – 118.132 | 25.815 |
| 1986 | 200 | 53.416 | 21.186 – 119.734 | 27.292 |
| 1985 | 200 | 55.077 | 21.987 – 121.929 | 28.501 |
| 1984 | 192 | 57.598 | 23.185 – 125.159 | 29.963 |
| 1983 | 189 | 60.013 | 24.754 – 130.577 | 31.512 |
| 1982 | 188 | 65.277 | 26.352 – 142.101 | 33.087 |
| 1981 | 185 | 63.606 | 26.951 – 143.127 | 35.930 |
| 1980 | 182 | 70.068 | 29.262 – 151.184 | 37.460 |
| 1979 | 181 | 71.629 | 30.291 – 154.326 | 38.794 |
| 1978 | 180 | 72.631 | 31.625 – 155.346 | 40.449 |
| 1977 | 177 | 74.344 | 33.616 – 153.518 | 42.359 |
| 1976 | 176 | 76.692 | 35.009 – 163.674 | 45.991 |
| 1975 | 174 | 78.495 | 36.570 – 159.997 | 50.854 |
| 1974 | 170 | 80.653 | 38.690 – 163.643 | 54.734 |
| 1973 | 168 | 81.456 | 40.791 – 170.045 | 55.614 |
| 1972 | 167 | 83.507 | 43.331 – 181.830 | 59.351 |
| 1971 | 165 | 85.624 | 45.538 – 187.475 | 63.337 |
| 1970 | 160 | 93.155 | 48.683 – 192.560 | 68.219 |
| 1969 | 159 | 94.451 | 50.988 – 192.691 | 71.318 |
| 1968 | 154 | 98.133 | 52.843 – 198.058 | 73.141 |
| 1967 | 149 | 103.880 | 55.524 – 202.425 | 75.843 |
| 1966 | 146 | 103.706 | 56.770 – 206.378 | 78.087 |
| 1965 | 145 | 102.947 | 54.081 – 207.438 | 80.682 |
| 1964 | 143 | 119.102 | 56.647 – 210.555 | 83.008 |
| 1963 | 140 | 119.514 | 57.547 – 211.163 | 86.147 |
| 1962 | 137 | 123.206 | 56.100 – 212.343 | 90.086 |
| 1961 | 135 | 128.498 | 56.053 – 214.141 | 93.739 |
| 1960 | 134 | 136.120 | 56.849 – 218.490 | 96.150 |
| 1959 | 131 | 139.480 | 59.362 – 224.886 | 101.787 |
| 1958 | 126 | 140.486 | 61.169 – 230.777 | 106.853 |
| 1957 | 118 | 151.502 | 78.738 – 239.864 | 112.877 |
| 1956 | 115 | 152.792 | 81.708 – 242.281 | 122.242 |
| 1955 | 105 | 152.596 | 67.982 – 237.400 | 127.277 |
| 1954 | 97 | 149.917 | 66.242 – 243.138 | 130.903 |
| 1953 | 89 | 144.387 | 69.811 – 243.124 | 135.089 |
| 1952 | 81 | 141.050 | 66.542 – 246.297 | 141.050 |
062023 → 2024
Who rose and fell
The biggest changes in value between the two newest editions — reference years recalculated in one report, not two separate publications. Places are shown second, because they also move when other countries do.
Improved most
before → afterWorsened most
before → after Bosnia and Herzegovina6.037 → 6.905 · 151st → 144th+0.868
 Lebanon16.987 → 17.601 · 91st → 84th+0.614
 Croatia5.091 → 5.646 · 160th → 154th+0.555
 Zimbabwe64.198 → 64.661 · 18th → 17th+0.463
 Romania6.873 → 7.311 · 143rd → 143rd+0.438
200 countries were measured in both 2023 and 2024.
07Across every edition
Under-five mortality rate in records
The extremes of the statistic. A record reached by more than one country names none of them.
Highest reading on record
780.939
Deaths before age five (per 1,000 live births)
Lowest reading on record
1.260
Deaths before age five (per 1,000 live births)
Biggest improvement between editions
−475.259
780.939 → 305.680
Biggest decline between editions
+423.105
357.834 → 780.939
Most improved since first measured
−516.590
535.000 → 18.410
At the top most often
36 of 73
editions, alone at the first-listed end
08The measure
About under-five mortality rate
The under-five mortality rate is how many children out of every thousand born alive die before their fifth birthday. It is the single measure that most cleanly separates the 1950s from now: the worst reading in the file is 781 per 1,000 and the best is 1.26.
What the number is: Deaths before age five (per 1,000 live births).
What it does not measure
It counts deaths, not the health of the children who survive; stunting and other measures of child health are published on this site as context.
09Where it fits
Connections
Its part in the Country Index, the statistics whose values line up most closely with it across countries, and others on the same subject.
In the Country Index
A key statistic for Health & Wellbeing
“Deaths before a fifth birthday, the most widely used summary of whether a health system reaches people.”
- Edition used
- 2024 (data 2024)
- Countries
- 200
- Licence
- CC BY 3.0 IGO
Moves with
Where under-five mortality rate is higher, these tend to be higher too.
- Infant Mortality RateUN IGME · 200 countries in commonρ 1.00
- Gender Inequality IndexUNDP Human Development Report Office · 172 countries in commonρ 0.92
- Coefficient of Human InequalityUNDP Human Development Report Office · 168 countries in commonρ 0.89
Moves against
Where under-five mortality rate is higher, these tend to be lower.
- Inequality-adjusted Human Development IndexUNDP Human Development Report Office · 168 countries in commonρ −0.93
- Human Capital IndexWorld Bank Group · 170 countries in commonρ −0.93
- Life Expectancy at BirthKeyUN DESA Population Division · 200 countries in commonρ −0.91
Rank correlation (ρ, from −1 to 1) across countries, on each statistic’s newest edition, out of 189 statistics sharing at least 80 countries with this one. Two statistics that move together do not cause each other.
10Analysis
Charts and analysis on under-five mortality rate

11Keep reading
Explore further
The countries at either end
More from UN IGME
12Questions
Under-five mortality rate: questions and answers
Which country has the lowest under-five mortality rate?
San Marino, at 1.260, among the 200 countries compared in 2024.
Which country has the highest under-five mortality rate?
Nigeria, at 115.649, among the 200 countries compared in 2024.
How many countries does the Under-Five Mortality Rate cover?
200 in 2024. The number measured varies from 81 to 200 between editions.
What is the world average under-five mortality rate?
This site does not calculate a world average, which would depend on how countries are weighted. In the middle country of the 200 compared in 2024, the figure was 14.539.
Is this UN Inter-agency Group for Child Mortality Estimation (UN IGME)’s own ranking?
No. UN Inter-agency Group for Child Mortality Estimation (UN IGME) publishes the values but ranks nobody; the position on this page is derived by Nations Inquiry by ordering the published values, and equal values share a position.
How often is the Under-Five Mortality Rate published?
This site holds 73 reference years, 1952–2024, all recalculated in UN Inter-agency Group for Child Mortality Estimation (UN IGME)’s 2025 report on one method — not 73 separate publications.
Where does the data come from, and can I download it?
From UN Inter-agency Group for Child Mortality Estimation (UN IGME), under CC BY 3.0 IGO. From the UN Inter-agency Group for Child Mortality Estimation, read out of UNICEF’s own SDMX warehouse (CME_MRY0T4) rather than the World Bank’s copy, which rounds to one decimal and manufactured ties in every edition. Every edition is on this site’s Datasets pages as a full table, and downloads as a CSV file with every value unrounded.
13Method
Sources, method and citation
Source
Under-Five Mortality Rate — UN Inter-agency Group for Child Mortality Estimation (UN IGME)
From the UN Inter-agency Group for Child Mortality Estimation, read out of UNICEF’s own SDMX warehouse (CME_MRY0T4) rather than the World Bank’s copy, which rounds to one decimal and manufactured ties in every edition.
Newest edition
Report year 2024Data year 2024
Cite the source as: UN Inter-agency Group for Child Mortality Estimation. Levels and Trends in Child Mortality. New York: UNICEF.
Licence: CC BY 3.0 IGO, checked 2026-09-09.
How this page reads the numbers
- UN Inter-agency Group for Child Mortality Estimation (UN IGME) ranks nobody on this measure. The position is derived by Nations Inquiry by ordering the published values; equal values share a position.
- Which end is better follows the publisher’s own reading of the measure.
- A country is named at an end only when it holds that value alone. Where several share it, the page says how many and names none first.
- Values are stored exactly as published and trimmed only for display. “The middle country” is the median of the countries measured, not a world average.
The file itself, column by column — where it came from, what each column holds, and every edition as a CSV — is on its dataset page.
Photographs
The countries at the top of this statistic, from their profiles: Wikimedia Commons, shown in greyscale, each used under the licence named.
- San Marino — Matl derivative work: Jjtkk, CC BY-SA 3.0
- Estonia — Andrus Uuetalu derivative work: Jjtkk, CC BY-SA 3.0 ee
- Luxembourg — Michal Osmenda from Brussels, Belgium, CC BY-SA 2.0
Cite this page
Nations Inquiry (2026). Under-five mortality rate by country: Under-Five Mortality Rate, data from UN Inter-agency Group for Child Mortality Estimation (UN IGME). https://nationsinquiry.com/statistics/under-five-mortality