Loading…
UN DESA Population Division · Life Expectancy at Birth
Life expectancy by country
How long can a newborn expect to live?
Monaco placed first of the 222 countries compared in 2023, at 86.372, and Nigeria last, at 54.462. In the middle country the figure was 74.630. Among the 222 countries measured in every edition since 1950, the middle one moved from 48.548 to 74.630.
Life expectancy · 2023
Key statistic · Health & Wellbeing

Highest of 222Monaco
86.372012023 · position · derived
Who leads
The three countries at the highest end of 222 compared, the three at the other end, and the first on each continent.
 1
1Photo: Martin Weber derivative work: Jjtkk · CC BY-SA 3.0, greyscale
 2
2Photo: Matl derivative work: Jjtkk · CC BY-SA 3.0, greyscale
 3
3Photo: Base64 and Derivative work by Globe-trotter · CC BY-SA 3.0, greyscale
02Every measured country
Life expectancy on a map
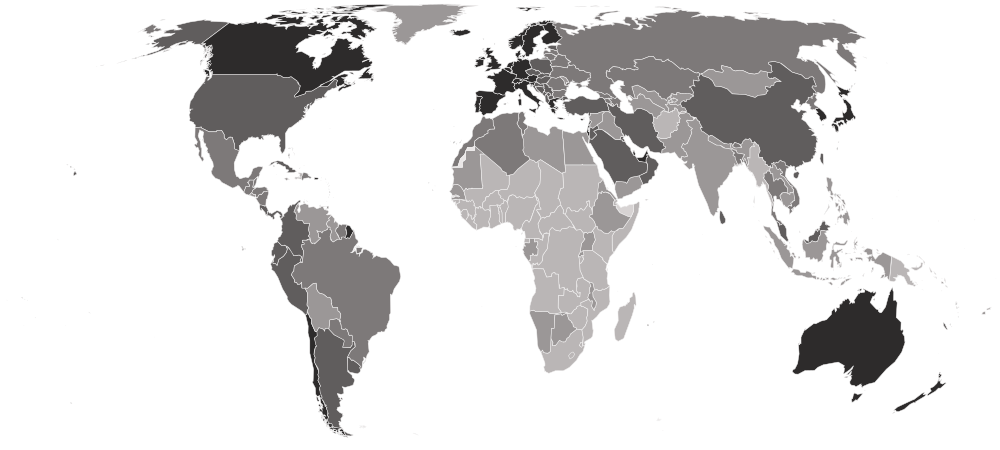
Each country is shaded by its value, in five groups holding the same number of countries. Hover a country for its value, or select it to open its profile. Below the map, each continent’s middle country.
Darker is a higher value — the better end.
- 54.462–67.198
- 67.315–72.514
- 72.602–76.508
- 76.657–80.999
- 81.041–86.372
- No reading in 2023
- Europe
81.491
the middle country, of 48 measured · 49 members
Monaco86.372 Moldova71.199
Highest and lowest reading in Europe.
- Americas
76.013
the middle country, of 48 measured · 48 members
 Canada82.630
 Haiti64.936
Highest and lowest reading in Americas.
- Asia
74.672
the middle country, of 51 measured · 52 members
 Hong Kong85.511
 Palestine65.170
Highest and lowest reading in Asia.
- Oceania
71.477
the middle country, of 21 measured · 21 members
 French Polynesia84.070
 Nauru62.109
Highest and lowest reading in Oceania.
- Africa
65.635
the middle country, of 54 measured · 55 members
 Tunisia76.508
 Nigeria54.462
Highest and lowest reading in Africa.
- Every region
22 sub-regions, highest middle country first
- Western Europe
82.229
the middle country, of 9 measured · 9 members
Monaco86.372 Germany81.378
Highest and lowest reading in Western Europe.
- Southern Europe
81.857
the middle country, of 17 measured · 17 members
 San Marino85.706
 Serbia76.769
Highest and lowest reading in Southern Europe.
- Eastern Asia
81.817
the middle country, of 8 measured · 8 members
Hong Kong85.511 Mongolia71.734
Highest and lowest reading in Eastern Asia.
- Northern Europe
81.606
the middle country, of 12 measured · 13 members
 Norway83.308
 Lithuania76.025
Highest and lowest reading in Northern Europe.
- Western Asia
77.816
the middle country, of 18 measured · 19 members
 United Arab Emirates82.909Palestine65.170
Highest and lowest reading in Western Asia.
- South America
76.620
the middle country, of 12 measured · 12 members
 Chile81.167
 Bolivia68.581
Highest and lowest reading in South America.
- Caribbean
76.182
the middle country, of 24 measured · 24 members
 Puerto Rico81.690Haiti64.936
Highest and lowest reading in Caribbean.
- Eastern Europe
75.787
the middle country, of 10 measured · 10 members
 Czechia79.834Moldova71.199
Highest and lowest reading in Eastern Europe.
- Central America
74.256
the middle country, of 8 measured · 8 members
 Costa Rica80.800
 El Salvador72.099
Highest and lowest reading in Central America.
- Northern Africa
73.473
the middle country, of 6 measured · 6 members
Tunisia76.508 Sudan66.331
Highest and lowest reading in Northern Africa.
- Southern Asia
72.975
the middle country, of 9 measured · 9 members
 Maldives81.041
 Afghanistan66.035
Highest and lowest reading in Southern Asia.
- Polynesia
72.852
the middle country, of 7 measured · 7 members
French Polynesia84.070 Tuvalu67.105
Highest and lowest reading in Polynesia.
- Central Asia
71.790
the middle country, of 5 measured · 5 members
 Kazakhstan74.402
 Turkmenistan70.073
Highest and lowest reading in Central Asia.
- South-eastern Asia
71.146
the middle country, of 11 measured · 11 members
 Singapore83.736
 Myanmar66.889
Highest and lowest reading in South-eastern Asia.
- Melanesia
70.528
the middle country, of 5 measured · 5 members
 New Caledonia78.766
 Papua New Guinea66.134
Highest and lowest reading in Melanesia.
- Micronesia
67.198
the middle country, of 7 measured · 7 members
 Northern Mariana Islands78.808Nauru62.109
Highest and lowest reading in Micronesia.
- Eastern Africa
66.563
the middle country, of 18 measured · 19 members
 Mauritius74.926
 South Sudan57.617
Highest and lowest reading in Eastern Africa.
- Southern Africa
66.139
the middle country, of 5 measured · 5 members
 Botswana69.163
 Lesotho57.375
Highest and lowest reading in Southern Africa.
- Middle Africa
63.707
the middle country, of 9 measured · 9 members
 São Tomé and Príncipe69.718
 Chad55.069
Highest and lowest reading in Middle Africa.
- Western Africa
62.053
the middle country, of 16 measured · 16 members
 Cabo Verde76.059Nigeria54.462
Highest and lowest reading in Western Africa.
- Australia and New Zealand
2 of 2 measured — too few for a middle: Australia, New Zealand.
 Australia83.923
 New Zealand82.088
Highest and lowest reading in Australia and New Zealand.
- Northern America
4 of 4 measured — too few for a middle: Bermuda, Canada, Greenland, United States.
Canada82.630 Greenland70.055
Highest and lowest reading in Northern America.
03The whole field at once
The spread
222 countries, one dot each, on one scale — further right is a higher value. Half the countries are above 74.630; a quarter are above 79.310, and a quarter below 68.592. The bar in each row marks that continent’s middle country.
04All 222 ever measured
Every country
In order, highest value first. “=” marks a position shared with another country. UN DESA Population Division ranks nobody on this measure; the position is derived here by ordering the published values. The trap at the top of this table is that a few very small states lead it, and small populations make an estimate move on a handful of deaths. The trap at the bottom is reading a low figure as "most people die at that age" — much of the gap between countries is driven by deaths in the first five years, which pull the average down without describing what an adult can expect.
Showing 25 of 222 countries



















































































































Values for 2023. The change column compares 2023 with 2022 only; the sparkline covers the recent editions.
051950–2023 · 74 editions
Over time
One point is one year's estimate. The line moves slowly in ordinary times and sharply in bad ones: because the measure applies today's death rates to a whole lifetime, a famine, a war or an epidemic cuts it hard and it recovers almost as fast afterwards. Rwanda's 1994 and Cambodia's 1977 are both visible here, and both are real.
- the middle country
- the middle half of countries
- the middle of the 222 countries measured every time
- each continent’s middle country
The same, year by year
| Year | Countries | Middle country | Middle half | Measured every time |
|---|---|---|---|---|
| 2023 | 222 | 74.630 | 68.592 – 79.310 | 74.630 |
| 2022 | 222 | 74.313 | 67.830 – 78.468 | 74.313 |
| 2021 | 222 | 72.433 | 66.697 – 77.366 | 72.433 |
| 2020 | 222 | 73.063 | 67.003 – 78.027 | 73.063 |
| 2019 | 222 | 74.196 | 67.413 – 78.708 | 74.196 |
| 2018 | 222 | 74.081 | 67.125 – 78.646 | 74.081 |
| 2017 | 222 | 74.029 | 67.059 – 78.509 | 74.029 |
| 2016 | 222 | 74.013 | 66.602 – 78.342 | 74.013 |
| 2015 | 222 | 73.783 | 66.365 – 78.033 | 73.783 |
| 2014 | 222 | 73.330 | 66.019 – 77.855 | 73.330 |
| 2013 | 222 | 73.386 | 65.730 – 77.798 | 73.386 |
| 2012 | 222 | 73.210 | 65.531 – 77.552 | 73.210 |
| 2011 | 222 | 73.003 | 65.265 – 77.592 | 73.003 |
| 2010 | 222 | 72.827 | 65.084 – 77.202 | 72.827 |
| 2009 | 222 | 72.426 | 65.020 – 76.958 | 72.426 |
| 2008 | 222 | 72.264 | 64.945 – 76.742 | 72.264 |
| 2007 | 222 | 72.113 | 64.532 – 76.622 | 72.113 |
| 2006 | 222 | 72.027 | 64.308 – 76.407 | 72.027 |
| 2005 | 222 | 71.876 | 64.113 – 76.148 | 71.876 |
| 2004 | 222 | 71.477 | 63.861 – 75.903 | 71.477 |
| 2003 | 222 | 71.409 | 63.566 – 75.463 | 71.409 |
| 2002 | 222 | 71.173 | 62.684 – 75.283 | 71.173 |
| 2001 | 222 | 70.926 | 62.315 – 75.102 | 70.926 |
| 2000 | 222 | 70.678 | 61.857 – 74.824 | 70.678 |
| 1999 | 222 | 70.245 | 61.514 – 74.543 | 70.245 |
| 1998 | 222 | 69.884 | 61.157 – 74.200 | 69.884 |
| 1997 | 222 | 69.746 | 60.764 – 73.903 | 69.746 |
| 1996 | 222 | 69.681 | 60.633 – 73.794 | 69.681 |
| 1995 | 222 | 69.358 | 60.533 – 73.463 | 69.358 |
| 1994 | 222 | 69.063 | 60.119 – 73.156 | 69.063 |
| 1993 | 222 | 68.839 | 59.682 – 73.075 | 68.839 |
| 1992 | 222 | 68.684 | 59.463 – 72.784 | 68.684 |
| 1991 | 222 | 69.019 | 59.883 – 72.649 | 69.019 |
| 1990 | 222 | 68.690 | 59.741 – 72.519 | 68.690 |
| 1989 | 222 | 68.218 | 59.631 – 72.474 | 68.218 |
| 1988 | 222 | 68.002 | 59.429 – 72.321 | 68.002 |
| 1987 | 222 | 67.808 | 59.441 – 72.182 | 67.808 |
| 1986 | 222 | 67.385 | 59.130 – 71.943 | 67.385 |
| 1985 | 222 | 66.826 | 58.872 – 71.601 | 66.826 |
| 1984 | 222 | 66.536 | 58.474 – 71.304 | 66.536 |
| 1983 | 222 | 66.205 | 57.926 – 71.089 | 66.205 |
| 1982 | 222 | 65.813 | 57.261 – 71.057 | 65.813 |
| 1981 | 222 | 65.445 | 56.950 – 70.933 | 65.445 |
| 1980 | 222 | 65.075 | 56.544 – 70.697 | 65.075 |
| 1979 | 222 | 64.905 | 55.894 – 70.663 | 64.905 |
| 1978 | 222 | 64.509 | 55.385 – 70.411 | 64.509 |
| 1977 | 222 | 64.150 | 55.493 – 70.195 | 64.150 |
| 1976 | 222 | 63.710 | 54.482 – 69.944 | 63.710 |
| 1975 | 222 | 63.337 | 54.351 – 69.769 | 63.337 |
| 1974 | 222 | 63.060 | 53.281 – 69.500 | 63.060 |
| 1973 | 222 | 62.754 | 52.989 – 69.308 | 62.754 |
| 1972 | 222 | 62.504 | 52.031 – 69.093 | 62.504 |
| 1971 | 222 | 61.762 | 51.796 – 68.793 | 61.762 |
| 1970 | 222 | 61.418 | 51.398 – 68.476 | 61.418 |
| 1969 | 222 | 61.055 | 51.311 – 68.039 | 61.055 |
| 1968 | 222 | 60.766 | 50.802 – 67.841 | 60.766 |
| 1967 | 222 | 60.297 | 50.135 – 67.405 | 60.297 |
| 1966 | 222 | 59.376 | 49.165 – 67.077 | 59.376 |
| 1965 | 222 | 59.090 | 48.433 – 66.725 | 59.090 |
| 1964 | 222 | 58.791 | 47.865 – 66.477 | 58.791 |
| 1963 | 222 | 58.322 | 47.196 – 66.194 | 58.322 |
| 1962 | 222 | 57.825 | 46.735 – 65.935 | 57.825 |
| 1961 | 222 | 57.246 | 45.940 – 65.494 | 57.246 |
| 1960 | 222 | 56.602 | 45.616 – 64.929 | 56.602 |
| 1959 | 222 | 56.064 | 44.802 – 64.616 | 56.064 |
| 1958 | 222 | 55.383 | 44.373 – 64.158 | 55.383 |
| 1957 | 222 | 54.335 | 43.723 – 63.165 | 54.335 |
| 1956 | 222 | 53.866 | 43.044 – 62.312 | 53.866 |
| 1955 | 222 | 53.018 | 42.609 – 61.733 | 53.018 |
| 1954 | 222 | 51.994 | 42.002 – 61.519 | 51.994 |
| 1953 | 222 | 51.115 | 41.490 – 60.847 | 51.115 |
| 1952 | 222 | 50.269 | 41.048 – 59.744 | 50.269 |
| 1951 | 222 | 49.540 | 40.351 – 58.987 | 49.540 |
| 1950 | 222 | 48.548 | 39.670 – 58.601 | 48.548 |
062022 → 2023
Who rose and fell
The biggest changes in value between the two newest editions. Places are shown second, because they also move when other countries do.
Improved most
before → after Central African Republic18.818 → 57.408 · 222nd → 219th+38.590
 Somalia53.932 → 58.816 · 221st → 217th+4.884
 Namibia64.190 → 67.385 · 195th → 174th+3.195
- United Arab Emirates80.487 → 82.909 · 41st → 21st+2.422
 Brunei72.917 → 75.327 · 123rd → 104th+2.409
Declined most
before → after- Palestine76.662 → 65.170 · 80th → 194th−11.492
 Libya74.462 → 69.339 · 110th → 160th−5.123
 Syria72.790 → 72.120 · 124th → 137th−0.670
 Dominican Republic74.211 → 73.720 · 113th → 119th−0.491
 Türkiye77.591 → 77.156 · 68th → 83rd−0.436
222 countries were measured in both 2022 and 2023.
07Across every edition
Life expectancy in records
The extremes of the statistic. A record reached by more than one country names none of them.
Highest reading on record
86.372
Years a newborn would live at current death rates
Lowest reading on record
10.989
Years a newborn would live at current death rates
Biggest improvement between editions
+38.590
18.818 → 57.408
Biggest decline between editions
−35.207
49.873 → 14.666
Most improved since first measured
+62.103
22.226 → 84.329
At the top most often
37 of 74
editions, alone at the first-listed end
08The measure
About life expectancy
Life expectancy at birth is the most widely used single summary of a population's health: how long a newborn would live if the death rates of today held for the whole of their life. It is not a forecast about any individual, and it is not a prediction — it is a snapshot of current mortality expressed as an age. The United Nations estimates it for every country on the same basis, which is what makes it comparable.
What the number is: Years a newborn would live at current death rates.
What it does not measure
It is a summary of today's death rates, not a forecast of how long any child will live, and it says nothing about how many of those years are lived in good health.
09Where it fits
Connections
Its part in the Country Index, the statistics whose values line up most closely with it across countries, and others on the same subject.
In the Country Index
A key statistic for Health & Wellbeing
“How long people actually live — the one measure of adult health on this site. Child mortality, which it correlates with, is a measure of a health system's reach in the first five years; this is the whole span.”
- Edition used
- 2023 (data 2023)
- Countries
- 222
- Licence
- CC BY 3.0 IGO
Moves with
Where life expectancy is higher, these tend to be higher too.
- Life Expectancy at Age 65UN DESA Population Division · 222 countries in commonρ 0.96
- Human Development IndexKeyUNDP Human Development Report Office · 193 countries in commonρ 0.91
- Inequality-adjusted Human Development IndexUNDP Human Development Report Office · 169 countries in commonρ 0.91
Moves against
Where life expectancy is higher, these tend to be lower.
- Under-Five Mortality RateKeyUN IGME · 200 countries in commonρ −0.91
- Infant Mortality RateUN IGME · 200 countries in commonρ −0.91
- Gender Inequality IndexUNDP Human Development Report Office · 172 countries in commonρ −0.89
Rank correlation (ρ, from −1 to 1) across countries, on each statistic’s newest edition, out of 190 statistics sharing at least 80 countries with this one. Two statistics that move together do not cause each other.
10Analysis
Charts and analysis on life expectancy

11Keep reading
Explore further
12Questions
Life expectancy: questions and answers
Which country has the highest life expectancy?
Monaco, at 86.372, among the 222 countries compared in 2023.
Which country has the lowest life expectancy?
Nigeria, at 54.462, among the 222 countries compared in 2023.
How many countries does the Life Expectancy at Birth cover?
222 in 2023.
What is the world average life expectancy?
This site does not calculate a world average, which would depend on how countries are weighted. In the middle country of the 222 compared in 2023, the figure was 74.630.
Is this UN DESA Population Division’s own ranking?
No. UN DESA Population Division publishes the values but ranks nobody; the position on this page is derived by Nations Inquiry by ordering the published values, and equal values share a position.
How often is the Life Expectancy at Birth published?
This site holds 74 editions, describing 1950 to 2023.
Where does the data come from, and can I download it?
From UN DESA Population Division, under CC BY 3.0 IGO. Read from the Population Division's own CSV download rather than from a redistributor, and stored to the four decimals the UN publishes. Projections are excluded: only years the UN has measured appear here. Every edition is on this site’s Datasets pages as a full table, and downloads as a CSV file with every value unrounded.
13Method
Sources, method and citation
Source
Life Expectancy at Birth — UN DESA Population Division
Read from the Population Division's own CSV download rather than from a redistributor, and stored to the four decimals the UN publishes. Projections are excluded: only years the UN has measured appear here.
Newest edition
Report year 2023Data year 2023
Cite the source as: United Nations, Department of Economic and Social Affairs, Population Division. World Population Prospects 2024. New York: United Nations.
Licence: CC BY 3.0 IGO, checked 2026-09-12.
How this page reads the numbers
- UN DESA Population Division ranks nobody on this measure. The position is derived by Nations Inquiry by ordering the published values; equal values share a position.
- Which end is better follows the publisher’s own reading of the measure.
- A country is named at an end only when it holds that value alone. Where several share it, the page says how many and names none first.
- Values are stored exactly as published and trimmed only for display. “The middle country” is the median of the countries measured, not a world average.
The file itself, column by column — where it came from, what each column holds, and every edition as a CSV — is on its dataset page.
Photographs
The countries at the top of this statistic, from their profiles: Wikimedia Commons, shown in greyscale, each used under the licence named.
- Monaco — Martin Weber derivative work: Jjtkk, CC BY-SA 3.0
- San Marino — Matl derivative work: Jjtkk, CC BY-SA 3.0
- Hong Kong — Base64 and Derivative work by Globe-trotter, CC BY-SA 3.0
Cite this page
Nations Inquiry (2026). Life expectancy by country: Life Expectancy at Birth, data from UN DESA Population Division. https://nationsinquiry.com/statistics/life-expectancy