World Bank Group · Adequacy of Social Protection and Labour Benefits
Adequacy of social protection benefits by country
How much are social protection benefits worth to the households that receive them?
Of the 94 countries compared in the 2023 edition, Laos had the highest reading, 90.857%, and Burundi had the lowest reading, 1.182%. In the middle country the figure was 17.163%. 29 readings from before 2013 are listed but not compared.
Share
Adequacy of social protection benefits · the 2023 edition
Context statistic

Highest of 94Laos
90.857%01the 2023 edition · values only
Who leads
The three countries at the highest end of 94 compared, the three at the other end, and the first on each continent.
 1
Photo: Tango7174 · CC BY-SA 4.0, greyscale
 2
Photo: Unknown author · CC BY 3.0, greyscale
 3
Photo: Ralf Lotys (Sicherlich) · CC BY 3.0, greyscale

Lowest in the 2023 edition
 Burundi1.182%
 Sierra Leone2.270%
 Azerbaijan2.575%
Where a country sits says how it compares with the others measured, and nothing about why.
Highest on each continent
- Africa
 South Africa50.326%
- Americas
 Brazil41.430%
- AsiaLaos90.857%
- Europe
 Poland64.986%
- Oceania
 Marshall Islands41.033%
3 of 21 measured
- Every region
02Every measured country
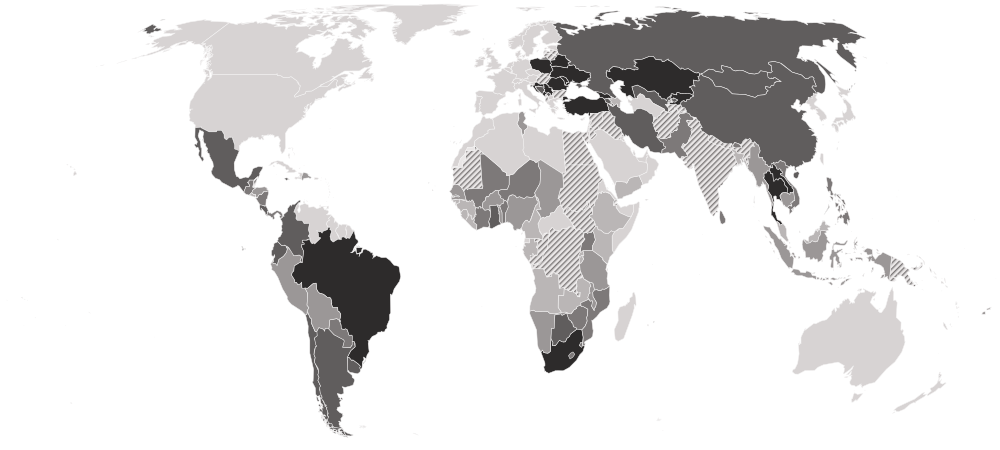
Adequacy of social protection benefits on a map
Each country is shaded by its value, in five groups holding the same number of countries. Hover a country for its value, or select it to open its profile. Below the map, each continent’s middle country.
Darker is a higher value — the better end.
- 1.182–8.249%
- 8.656–13.349%
- 13.574–24.949%
- 25.342–40.750%
- 41.033–90.857%
- Hatched: a reading from before 2013, listed but not compared (29)
- No reading in the 2023 edition
- Europe
50.777%
the middle country, of 11 measured · 49 members
Poland64.986% Kosovo30.152%
Highest and lowest reading in Europe.
- Americas
23.831%
the middle country, of 18 measured · 48 members
Brazil41.430% El Salvador6.250%
Highest and lowest reading in Americas.
- Asia
19.220%
the middle country, of 25 measured · 52 members
Laos90.857%Azerbaijan2.575%Highest and lowest reading in Asia.
- Africa
11.473%
the middle country, of 37 measured · 55 members
South Africa50.326%Burundi1.182%Highest and lowest reading in Africa.
- Oceania
3 of 21 measured — too few for a middle: Fiji, Kiribati, Marshall Islands.
Marshall Islands41.033% Kiribati8.885%
Highest and lowest reading in Oceania.
- Every region
17 sub-regions, highest middle country first
- Eastern Europe
51.973%
the middle country, of 6 measured · 10 members
Poland64.986% Russia31.368%
Highest and lowest reading in Eastern Europe.
- Southern Europe
41.827%
the middle country, of 5 measured · 17 members
 Serbia57.284%Kosovo30.152%
Highest and lowest reading in Southern Europe.
- South America
28.274%
the middle country, of 9 measured · 12 members
Brazil41.430% Peru8.973%
Highest and lowest reading in South America.
- Western Asia
24.748%
the middle country, of 6 measured · 19 members
 Türkiye44.496%Azerbaijan2.575%
Highest and lowest reading in Western Asia.
- Central America
20.423%
the middle country, of 7 measured · 8 members
 Costa Rica34.656%El Salvador6.250%
Highest and lowest reading in Central America.
- Southern Asia
18.169%
the middle country, of 6 measured · 9 members
 Iran25.779%
 Bangladesh2.875%
Highest and lowest reading in Southern Asia.
- Southern Africa
17.865%
the middle country, of 5 measured · 5 members
South Africa50.326% Namibia12.774%
Highest and lowest reading in Southern Africa.
- South-eastern Asia
13.057%
the middle country, of 8 measured · 11 members
Laos90.857% Malaysia7.695%
Highest and lowest reading in South-eastern Asia.
- Western Africa
12.857%
the middle country, of 14 measured · 16 members
 Ghana31.233%Sierra Leone2.270%
Highest and lowest reading in Western Africa.
- Eastern Africa
8.954%
the middle country, of 12 measured · 19 members
 Mauritius43.451%Burundi1.182%
Highest and lowest reading in Eastern Africa.
- Middle Africa
4.940%
the middle country, of 5 measured · 9 members
 Chad9.978%
 Gabon4.006%
Highest and lowest reading in Middle Africa.
- Caribbean
2 of 24 measured — too few for a middle: Dominican Republic, Jamaica.
 Jamaica27.687%
 Dominican Republic12.574%
Highest and lowest reading in Caribbean.
- Central Asia
3 of 5 measured — too few for a middle: Kazakhstan, Kyrgyzstan, Uzbekistan.
 Kazakhstan47.650%
 Uzbekistan27.302%
Highest and lowest reading in Central Asia.
- Eastern Asia
2 of 8 measured — too few for a middle: China, Mongolia.
 China36.830%
 Mongolia28.922%
Highest and lowest reading in Eastern Asia.
- Melanesia
1 of 5 measured — too few for a middle: Fiji.
 Fiji11.276%
Highest and lowest reading in Melanesia.
- Micronesia
2 of 7 measured — too few for a middle: Kiribati, Marshall Islands.
Marshall Islands41.033%Kiribati8.885%Highest and lowest reading in Micronesia.
- Northern Africa
1 of 6 measured — too few for a middle: Tunisia.
 Tunisia11.473%
Highest and lowest reading in Northern Africa.
03The whole field at once
The spread
94 countries, one dot each, on one scale — further right is a higher value. Half the countries are above 17.163%; a quarter are above 32.181%, and a quarter below 9.389%. The bar in each row marks that continent’s middle country.
04All 123 ever measured
Every country
In order, highest value first. No rank or position is shown: too many countries share the same value for an order to mean anything. It is measured against the recipients' own welfare, so the same benefit reads larger where the people receiving it are poorer. A survey also counts only the programmes it asks about, which differs between countries. For both reasons no position is shown; compare a country with its neighbours on coverage too.
Showing 25 of 123 countries






































































Values for the 2023 edition.
05In this edition
Adequacy of social protection benefits in records
The extremes of the statistic. A record reached by more than one country names none of them.
Highest reading
90.857%
Benefits received as a share of beneficiaries' total income or consumption (%)
Lowest reading
1.182%
Benefits received as a share of beneficiaries' total income or consumption (%)
06The measure
About adequacy of social protection benefits
Adequacy measures what social protection is worth to the households that receive it: the transfers they get — pensions, cash transfers, unemployment and labour-market benefits — as a share of their total income or consumption. Coverage says who is reached; adequacy says whether what they get makes a difference.
What the number is: Benefits received as a share of beneficiaries' total income or consumption (%).
07Where it fits
Connections
Its part in the Country Index, the statistics whose values line up most closely with it across countries, and others on the same subject.
In the Country Index
Context, with no vote
This statistic is published in full under Development & Human Capital and Poverty & Inequality, but does not help decide any Country Index standing.
Development & Human CapitalPoverty & InequalityWhich statistics vote, and why
Moves with
Where adequacy of social protection benefits is higher, these tend to be higher too.
- ND-GAIN Country IndexNotre Dame Global Adaptation Initiative (ND-GAIN), University of Notre Dame · 92 countries in commonρ 0.65
- Primary Energy Consumption per CapitaEIA · 93 countries in commonρ 0.65
- CO₂ Emissions per CapitaKeyGlobal Carbon Project · 94 countries in commonρ 0.64
Moves against
Where adequacy of social protection benefits is higher, these tend to be lower.
- Crude Birth RateUN DESA Population Division · 94 countries in commonρ −0.61
- Prevalence of UndernourishmentFAO · 84 countries in commonρ −0.61
- Population Under Age 15UN DESA Population Division · 94 countries in commonρ −0.60
Rank correlation (ρ, from −1 to 1) across countries, on each statistic’s newest edition, out of 264 statistics sharing at least 80 countries with this one. Two statistics that move together do not cause each other.
08Keep reading
Explore further
The data, edition by edition
The countries at either end
More from World Bank Group
- Able to Raise Emergency Funds Within 30 Days
- Access to Electricity
- Access to Electricity, Rural
- Account Ownership Among Women
- Account Ownership at a Financial Institution
- Actual Individual Consumption per Capita (PPP)
- Adjusted Net Savings
- Adults Who Experienced a Natural Disaster or Severe Weather
- All statistics
09Questions
Adequacy of social protection benefits: questions and answers
Which country has the highest adequacy of social protection benefits?
Laos, at 90.857%, among the 94 countries compared in the 2023 edition.
Which country has the lowest adequacy of social protection benefits?
Burundi, at 1.182%, among the 94 countries compared in the 2023 edition.
How many countries does the Adequacy of Social Protection and Labour Benefits cover?
94 in the 2023 edition, and 123 at least once across all editions.
What is the world average adequacy of social protection benefits?
This site does not calculate a world average, which would depend on how countries are weighted. In the middle country of the 94 compared in the 2023 edition, the figure was 17.163%.
Is this World Bank Group’s own ranking?
No ranking is shown. World Bank Group publishes values only, and too many countries share the same value for an ordering to mean anything, so none is derived.
How often is the Adequacy of Social Protection and Labour Benefits published?
This site holds one edition, describing 2023.
Where does the data come from, and can I download it?
From World Bank Group, under CC BY 4.0. The World Bank's ASPIRE database, through its indicator API (per_allsp.adq_pop_tot), computed from household surveys. Taken as one reading per country, because surveys are years apart. Every edition is on this site’s Datasets pages as a full table, and downloads as a CSV file with every value unrounded.
10Method
Sources, method and citation
Source
Adequacy of Social Protection and Labour Benefits — World Bank Group
The World Bank's ASPIRE database, through its indicator API (per_allsp.adq_pop_tot), computed from household surveys. Taken as one reading per country, because surveys are years apart.
Newest edition
Report year 2023Data year not recorded
Cite the source as: World Bank. ASPIRE: The Atlas of Social Protection — Indicators of Resilience and Equity. Washington, DC: World Bank Group.
Licence: CC BY 4.0, checked 2026-09-29.
How this page reads the numbers
- No rank or position is shown: World Bank Group publishes values only, and too many countries share the same value for an ordering to mean anything.
- Which end is better follows the publisher’s own reading of the measure.
- A country is named at an end only when it holds that value alone. Where several share it, the page says how many and names none first.
- The file gives each country’s most recent reading, so the rows are from different years. Readings from before 2013 are listed but left out of every comparison on this page.
- Values are stored exactly as published and trimmed only for display. “The middle country” is the median of the countries measured, not a world average.
The file itself, column by column — where it came from, what each column holds, and every edition as a CSV — is on its dataset page.
Photographs
The countries at the top of this statistic, from their profiles: Wikimedia Commons, shown in greyscale, each used under the licence named.
- Laos — Tango7174, CC BY-SA 4.0
- Thailand — Unknown author, CC BY 3.0
- Poland — Ralf Lotys (Sicherlich), CC BY 3.0
Cite this page
Nations Inquiry (2026). Adequacy of social protection benefits by country: Adequacy of Social Protection and Labour Benefits, data from World Bank Group. https://nationsinquiry.com/statistics/social-protection-adequacy