UNCTAD · Liner Shipping Connectivity Index
Liner Shipping Connectivity Index by country
How well connected are a country's ports to the world's container shipping?
China placed first of the 167 countries compared in 2026, at 1,319.457, and Turks and Caicos Islands last, at 4.130. In the middle country the figure was 56.208. Among the 153 countries measured in every edition since 2006, the middle one moved from 53.684 to 64.536.
Liner Shipping Connectivity Index · 2026
Key statistic · Mobility & Trade

Highest of 167China
1,319.457012026 · UNCTAD’s rank
Who leads
The three countries at the highest end of 167 compared, the three at the other end, and the first on each continent.
 1
1Photo: Seebeer Edited by Nicholasjf21 · Public domain, greyscale
 2
2Photo: Unknown author · CC BY-SA 2.0, greyscale
 3
3Photo: Khairul Nizam . · CC BY 2.0, greyscale

Lowest in 2026
- 175
 Turks and Caicos Islands4.130
 - 172
 Gibraltar5.453
 - 171
 Eritrea5.548
Ranks out of 175. Where a country sits says how it compares with the others measured, and nothing about why.
02Every measured country
Liner Shipping Connectivity Index on a map
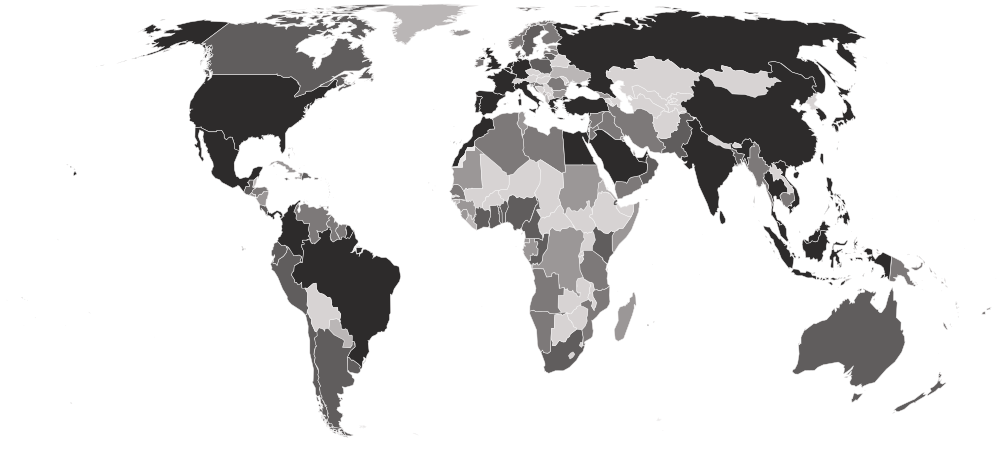
Each country is shaded by its value, in five groups holding the same number of countries. Hover a country for its value, or select it to open its profile. Below the map, each continent’s middle country.
Darker is a higher value — the better end.
- 4.130–21.904
- 22.838–36.057
- 37.114–77.872
- 78.051–161.547
- 164.218–1,319.457
- No reading in 2026 (6 measured in an earlier edition)
- Asia
124.596
the middle country, of 36 measured · 52 members
China1,319.457 Timor-Leste12.229
Highest and lowest reading in Asia.
- Europe
85.359
the middle country, of 30 measured · 49 members
 Spain416.606Gibraltar5.453
Highest and lowest reading in Europe.
- Africa
62.246
the middle country, of 38 measured · 55 members
 Egypt284.253Eritrea5.548
Highest and lowest reading in Africa.
- Americas
35.701
the middle country, of 44 measured · 48 members
 United States503.888Turks and Caicos Islands4.130
Highest and lowest reading in Americas.
- Oceania
26.328
the middle country, of 19 measured · 21 members
 Australia145.121
 Niue5.762
Highest and lowest reading in Oceania.
- Every region
21 sub-regions, highest middle country first
- Eastern Asia
415.708
the middle country, of 5 measured · 8 members
China1,319.457 Taiwan318.022
Highest and lowest reading in Eastern Asia.
- South-eastern Asia
223.632
the middle country, of 10 measured · 11 members
 Singapore617.634Timor-Leste12.229
Highest and lowest reading in South-eastern Asia.
- Southern Asia
119.815
the middle country, of 6 measured · 9 members
 India381.295
 Maldives14.471
Highest and lowest reading in Southern Asia.
- South America
106.630
the middle country, of 11 measured · 12 members
 Colombia210.358
 Paraguay8.714
Highest and lowest reading in South America.
- Southern Europe
97.868
the middle country, of 10 measured · 17 members
Spain416.606Gibraltar5.453Highest and lowest reading in Southern Europe.
- Central America
74.766
the middle country, of 8 measured · 8 members
 Panama220.292
 Belize17.365
Highest and lowest reading in Central America.
- Northern Africa
69.330
the middle country, of 6 measured · 6 members
Egypt284.253 Tunisia25.123
Highest and lowest reading in Northern Africa.
- Western Asia
64.536
the middle country, of 15 measured · 19 members
 Türkiye305.823
 Bahrain24.948
Highest and lowest reading in Western Asia.
- Northern Europe
61.476
the middle country, of 11 measured · 13 members
 United Kingdom387.626
 Faroe Islands20.576
Highest and lowest reading in Northern Europe.
- Eastern Africa
47.687
the middle country, of 10 measured · 19 members
 Djibouti88.030Eritrea5.548
Highest and lowest reading in Eastern Africa.
- Eastern Europe
45.605
the middle country, of 5 measured · 10 members
 Russia179.367
 Ukraine15.297
Highest and lowest reading in Eastern Europe.
- Melanesia
41.649
the middle country, of 5 measured · 5 members
 Papua New Guinea50.367
 Vanuatu24.493
Highest and lowest reading in Melanesia.
- Western Africa
36.057
the middle country, of 13 measured · 16 members
 Côte d’Ivoire142.596
 Guinea-Bissau13.785
Highest and lowest reading in Western Africa.
- Middle Africa
32.989
the middle country, of 7 measured · 9 members
 Cameroon107.371
 São Tomé and Príncipe13.496
Highest and lowest reading in Middle Africa.
- Polynesia
27.236
the middle country, of 6 measured · 7 members
 French Polynesia47.747Niue5.762
Highest and lowest reading in Polynesia.
- Caribbean
24.494
the middle country, of 21 measured · 24 members
 Dominican Republic131.969Turks and Caicos Islands4.130
Highest and lowest reading in Caribbean.
- Micronesia
15.301
the middle country, of 6 measured · 7 members
 Marshall Islands23.409
 Palau6.875
Highest and lowest reading in Micronesia.
- Australia and New Zealand
2 of 2 measured — too few for a middle: Australia, New Zealand.
Australia145.121 New Zealand88.241
Highest and lowest reading in Australia and New Zealand.
- Northern America
4 of 4 measured — too few for a middle: Bermuda, Canada, Greenland, United States.
United States503.888 Bermuda7.976
Highest and lowest reading in Northern America.
- Southern Africa
2 of 5 measured — too few for a middle: Namibia, South Africa.
 South Africa117.031
 Namibia70.367
Highest and lowest reading in Southern Africa.
- Western Europe
4 of 9 measured — too few for a middle: Belgium, France, Germany, Netherlands.
 Netherlands380.800
 France269.601
Highest and lowest reading in Western Europe.
03The whole field at once
The spread
167 countries, one dot each, on one scale — further right is a higher value. Half the countries are above 56.208; a quarter are above 124.698, and a quarter below 25.279. The bar in each row marks that continent’s middle country.
04All 173 ever measured
Every country
In order, highest value first. “=” marks a rank shared with another country. A landlocked country has no score at all rather than a zero, so this is a coastal-world table and the missing rows are geography rather than gaps in the data.
Showing 25 of 173 countries








































































































Values for 2026. The change column compares 2026 with 2025 only; the sparkline covers the recent editions.
052006–2026 · 21 editions
Over time
Each point is one year from 2006, taken from the last quarter UNCTAD published that year. Because the scale is pegged to one fixed quarter rather than re-based each year, a rising line means genuinely more shipping.
- the middle country
- the middle half of countries
- the middle of the 153 countries measured every time
- each continent’s middle country
The same, year by year
| Year | Countries | Middle country | Middle half | Measured every time |
|---|---|---|---|---|
| 2026 | 167 | 56.208 | 25.279 – 124.698 | 64.536 |
| 2025 | 168 | 60.838 | 25.245 – 125.085 | 66.694 |
| 2024 | 168 | 55.224 | 25.109 – 114.923 | 60.465 |
| 2023 | 167 | 54.777 | 24.876 – 123.839 | 60.579 |
| 2022 | 167 | 51.487 | 23.433 – 112.107 | 59.578 |
| 2021 | 168 | 52.640 | 22.357 – 110.441 | 56.206 |
| 2020 | 171 | 47.855 | 23.360 – 111.581 | 57.460 |
| 2019 | 171 | 51.053 | 23.971 – 113.591 | 56.003 |
| 2018 | 170 | 52.032 | 23.902 – 114.491 | 59.303 |
| 2017 | 170 | 49.865 | 25.141 – 113.723 | 58.223 |
| 2016 | 170 | 48.087 | 24.665 – 112.997 | 56.049 |
| 2015 | 169 | 49.130 | 25.684 – 109.699 | 60.708 |
| 2014 | 170 | 48.075 | 25.398 – 111.091 | 57.976 |
| 2013 | 169 | 51.318 | 26.488 – 110.669 | 57.764 |
| 2012 | 170 | 47.436 | 25.090 – 108.390 | 53.751 |
| 2011 | 166 | 50.265 | 24.113 – 109.427 | 55.581 |
| 2010 | 166 | 50.513 | 22.006 – 112.029 | 55.108 |
| 2009 | 162 | 53.039 | 22.687 – 113.232 | 54.619 |
| 2008 | 163 | 51.676 | 23.085 – 113.539 | 56.022 |
| 2007 | 160 | 55.785 | 22.625 – 106.960 | 56.459 |
| 2006 | 161 | 52.255 | 22.671 – 108.587 | 53.684 |
062025 → 2026
Who rose and fell
The biggest changes in value between the two newest editions. Places are shown second, because they also move when other countries do.
Improved most
before → after Vietnam463.832 → 489.836 · 6th → 6th+26.003
 Syria33.925 → 48.714 · 108th → 89th+14.789
 Indonesia246.798 → 260.200 · 24th → 23rd+13.401
 Hong Kong337.401 → 349.929 · 13th → 12th+12.528
- South Africa106.189 → 117.031 · 53rd → 47th+10.842
Declined most
before → after United Arab Emirates319.551 → 190.026 · 15th → 28th−129.525
 Qatar91.545 → 34.360 · 57th → 104th−57.185
 Iraq82.997 → 41.937 · 63rd → 97th−41.060
- Bahrain64.289 → 24.948 · 80th → 130th−39.341
 Saudi Arabia237.458 → 207.867 · 25th → 26th−29.591
167 countries were measured in both 2025 and 2026. The field changed from 168 to 167 countries, so a place can move for reasons that have nothing to do with the country itself.
07Across every edition
Liner Shipping Connectivity Index in records
The extremes of the statistic. A record reached by more than one country names none of them.
Highest reading on record
1,319.457
LSCI (index, average Q1 2023 = 100)
Lowest reading on record
2.988
LSCI (index, average Q1 2023 = 100)
Biggest improvement between editions
+96.359
790.200 → 886.559
Biggest decline between editions
−129.525
319.551 → 190.026
Most improved since first measured
+570.073
749.385 → 1,319.457
At the top most often
21 of 21
editions, alone at the first-listed end
08The measure
About Liner Shipping Connectivity Index
UNCTAD’s Liner Shipping Connectivity Index measures how well plugged into the global container network a country’s ports are — the operators, services, vessels and capacity calling there. The scale is relative: 100 is the average economy in the first quarter of 2023, so China above 1,300 is an order of magnitude beyond it.
What the number is: LSCI (index, average Q1 2023 = 100).
What it does not measure
It measures connections to scheduled container services, not the volume a port handles, and it leaves out air freight and landlocked countries' road and rail links.
09Where it fits
Connections
Its part in the Country Index, the statistics whose values line up most closely with it across countries, and others on the same subject.
In the Country Index
A key statistic for Mobility & Trade
“How much of the world's container shipping actually calls at a country's ports — the infrastructure side of connectedness, where logistics performance is the paperwork side.”
- Edition used
- 2025 (data 2025)
- Countries
- 168
- Licence
- CC BY 3.0 IGO
Moves with
Where Liner Shipping Connectivity Index is higher, these tend to be higher too.
- Container Port TrafficUNCTAD · 103 countries in commonρ 0.94
- Total PopulationUN DESA Population Division · 167 countries in commonρ 0.72
- Government AI Readiness IndexKeyOxford Insights · 147 countries in commonρ 0.72
Moves against
Where Liner Shipping Connectivity Index is higher, these tend to be lower.
- Net Official Development Assistance ReceivedOECD Development Assistance Committee · 93 countries in commonρ −0.65
- Outbound Mobility Ratio, TertiaryUIS · 89 countries in commonρ −0.55
- Climate Vulnerability (ND-GAIN)KeyNotre Dame Global Adaptation Initiative (ND-GAIN), University of Notre Dame · 146 countries in commonρ −0.44
Rank correlation (ρ, from −1 to 1) across countries, on each statistic’s newest edition, out of 175 statistics sharing at least 80 countries with this one. Two statistics that move together do not cause each other.
10Keep reading
Explore further
The subject
The countries at either end
11Questions
Liner Shipping Connectivity Index: questions and answers
Which country has the highest Liner Shipping Connectivity Index?
China, at 1,319.457, among the 167 countries compared in 2026.
Which country has the lowest Liner Shipping Connectivity Index?
Turks and Caicos Islands, at 4.130, among the 167 countries compared in 2026.
How many countries does the Liner Shipping Connectivity Index cover?
167 in 2026, and 173 at least once across all editions. The number measured varies from 160 to 171 between editions.
What is the world average Liner Shipping Connectivity Index?
This site does not calculate a world average, which would depend on how countries are weighted. In the middle country of the 167 compared in 2026, the figure was 56.208.
Is this UN Trade and Development (UNCTAD)’s own ranking?
Yes. The rank shown is the one UN Trade and Development (UNCTAD) publishes.
How often is the Liner Shipping Connectivity Index published?
This site holds 21 editions, describing 2006 to 2026.
Where does the data come from, and can I download it?
From UN Trade and Development (UNCTAD), under CC BY 3.0 IGO. Read from UNCTAD’s own US.LSCI bulk file on UNCTADstat, which publishes the index and its rank every quarter. Every edition is on this site’s Datasets pages as a full table, and downloads as a CSV file with every value unrounded.
12Method
Sources, method and citation
Source
Liner Shipping Connectivity Index — UN Trade and Development (UNCTAD)
Read from UNCTAD’s own US.LSCI bulk file on UNCTADstat, which publishes the index and its rank every quarter.
Newest edition
Report year 2026Data year 2026
Cite the source as: UN Trade and Development (UNCTAD). Liner Shipping Connectivity Index. Geneva: UNCTAD Data Hub.
Licence: CC BY 3.0 IGO, checked 2026-09-12.
How this page reads the numbers
- The rank is UN Trade and Development (UNCTAD)’s own, as published.
- Which end is better follows the publisher’s own reading of the measure.
- A country is named at an end only when it holds that value alone. Where several share it, the page says how many and names none first.
- Values are stored exactly as published and trimmed only for display. “The middle country” is the median of the countries measured, not a world average.
The file itself, column by column — where it came from, what each column holds, and every edition as a CSV — is on its dataset page.
Photographs
The countries at the top of this statistic, from their profiles: Wikimedia Commons, shown in greyscale, each used under the licence named.
- China — Seebeer Edited by Nicholasjf21, Public domain
- South Korea — Unknown author, CC BY-SA 2.0
- Singapore — Khairul Nizam ., CC BY 2.0
Cite this page
Nations Inquiry (2026). Liner Shipping Connectivity Index by country: Liner Shipping Connectivity Index, data from UN Trade and Development (UNCTAD). https://nationsinquiry.com/statistics/liner-shipping-connectivity