Loading…

Photo: Tsy1980 · CC BY-SA 4.0 · via Wikimedia Commons, shown in greyscale

Portugal
Portugal places highest on Gender Development Index (top 1% worldwide) and lowest on Ecological Footprint (bottom 21%).
Portugal in the Nations Inquiry Country Index
At a glance
Population
10,430,738
people
since 1950
Land area
91,606
km²
since 1961
GDP per person
42,577
international $, PPP
since 1990
Life expectancy
82.36
years at birth
since 1950
Human development
0.89
HDI, 0–1
since 1990
Unemployment
6.164
% of the labour force
since 1991
The newest published figure for each, the year it describes and who published it, with a line showing how it has moved.
01The country
About Portugal
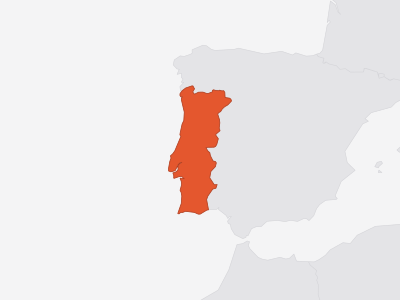
Key facts about Portugal
- Capital
- Lisbon
- Official languages
- Mirandese, Portuguese
- Currency
- euro (EUR)
- ISO code
- PRT · PT
- Domain · dialling
- .pt · +351
As Wikidata records them. Official languages are the least consistent — some countries list only a national language, others every regional one. Sources and licences.
02Country Index 2026
Where it stands, topic by topic
Strongest first. Each position is Portugal’s place among the countries with a standing on that topic, built from a few key statistics chosen to measure different things.
13thof 175
From 4 of 4 key statistics
18thof 193
From 3 of 3 key statistics
joint21stof 177
From 4 of 4 key statistics
26thof 200
From 4 of 4 key statistics
27thof 194
From 4 of 4 key statistics
joint26thof 183
From 4 of 4 key statistics
30thof 192
From 3 of 3 key statistics
32ndof 198
From 3 of 3 key statistics
34thof 196
From 3 of 3 key statistics
32ndof 176
From 4 of 4 key statistics
joint41stof 198
From 3 of 3 key statistics
31stof 147
From 3 of 3 key statistics
joint58thof 182
From 4 of 4 key statistics
52ndof 159
From 2 of 2 key statistics
124thof 181
From 3 of 3 key statistics
No standing — Portugal holds too few of this subject’s key statistics to be placed on it.
Each standing is built from a few key statistics chosen to measure different things. Select a subject for Portugal’s readings on it, or see every statistic held for Portugal in the table further down this page.
03Highs and lows
Where Portugal stands out
The two ends of its own record: every statistic on which Portugal sits within ten places of the best or worst in the world, plus its strongest and weakest readings overall. Each is turned into a percentile — its place among every country measured — which is what lets a hunger score and a press-freedom rank be compared at all.
Where Portugal does best13
In the top third of all countries measured. 12 are within ten places of the best in the world, in a field of at least 50 countries — marked with that place.
- 1stGender Development Indextop 1%
Position · derived 1st of 184 · 1 · 2023
world median 0.971 (better) · ▲ 12 pts since 2013
- 1stDeaths in Organized Violencetop 35%
Position · derived 59th of 59 · 1 = worst · 0 · 2025
world median 0
- 1st
Position · derived 104th of 104 · 1 = worst · 2.5 · 2023
world median 5.2 (better) · ▼ 3 pts since 2013
- 1st
Position · derived 1st of 190 · 100 · 2024
world median 81.25 (better)
- 2nd
Position · derived 2nd of 50 · 78.16 · 2024
world median 66.8 (better)
- 4th
Position · derived 4th of 50 · 69.53 · 2024
world median 50.13 (better)
- 4th
Position · derived 4th of 176 · 3.187 · 2025
world median 0.565 (better) · ▲ 11 pts since 2015
- 6thInformal Employment Ratetop 5%
Position · derived 92nd of 97 · 1 = worst · 2.328 · 2025
world median 36.83 (better)
- 7th
Position · derived 7th of 150 · 21.23 · 2024
world median 0.725 (better) · ▲ 10 pts since 2014
- 9th
- 9th
Position · derived 9th of 156 · 0.797 · 2023
world median 0.678 (better)
- 9th
Position · derived 132nd of 140 · 1 = worst · 9.5 · 2023
world median 25.2 (better)
Not ranked by the publisher · 45.36 · 2024
world median 5.769 (better)
Where Portugal struggles most5
In the bottom third of all countries measured.
- Ecological Footprintbottom 21%
Position · derived 27th of 126 · 1 = worst · 4.261 · 2025
world median 2.296 (worse) · ▼ 6 pts since 2015
- Youth Unemployment Ratebottom 25%
Position · derived 47th of 182 · 1 = worst · 20.22 · 2025
world median 12.83 (worse) · ▲ 8 pts since 2015
- GDP Growthbottom 26%
Position · derived 137th of 186 · 1.864 · 2025
world median 3.396 (worse) · ▼ 4 pts since 2015
- Adjusted Net Savingsbottom 26%
Position · derived 87th of 118 · 3.057 · 2021
world median 8.389 (worse) · ▲ 6 pts since 2011
Position · derived 48th of 174 · 1 = worst · 7.712 · 2025
world median 4.456 (worse)
A band is a place among the countries each publisher scores, so Portugal can move because other countries moved. See the Country Index for the full method.
04Over time
Which way it is moving
The published rank in widely quoted reports, edition by edition — each end with the size of that year’s field — and the statistics, not already named above, on which it has gained or lost the most ground.
Human Development Index
UNDP Human Development Report Office
48th
of 141 · 1990
40th
of 193 · 2023
Ranked in 34 of 34 editions
Corruption Perceptions Index
Transparency International
33rd
of 173 · 2012
46th
of 181 · 2025
Ranked in 14 of 14 editions
Gender Inequality Index
UNDP Human Development Report Office
22nd
of 79 · 1990
26th
of 172 · 2023
Ranked in 34 of 34 editions
Global Innovation Index
World Intellectual Property Organization
32nd
of 132 · 2022
31st
of 139 · 2025
Ranked in 4 of 4 editions
Economic Complexity Index
Growth Lab at Harvard University
44th
of 140 · 1995
41st
of 145 · 2024
Ranked in 30 of 30 editions
Government AI Readiness Index
Oxford Insights
27th
of 172 · 2020
28th
of 195 · 2025
Ranked in 6 of 6 editions
Gaining ground
Where Portugal has climbed against the rest of the world, in percentile points.
- Crop Production Index+40 pts since 2012
- Food Production Index+20 pts since 2012
- PISA Reading Performance+20 pts since 2012
Losing ground
Where Portugal has slipped against the rest of the world, in percentile points.
- Women's Political Empowerment Index-30 pts since 2015
- Government Internet Shutdowns-26 pts since 2015
- Internal Displacements by Disaster-26 pts since 2015
05In context
Portugal and its neighbours
A position reads best beside the countries around it. Every position below is a place in the world ranking of 178, not within the region.
Shares a land border with
Placed either side in the Country Index 2026




Across Southern Europe
Every country in the sub-region, by its position in the world (of 178 placed).
- 12
 Slovenia
 - 22Portugal
- 27
 Malta
Malta - =28
 Spain
Spain - 31
 Italy
Italy - 32
 Croatia
 - 41
 Greece
 - =48
 Albania
 - =48
 Serbia
 - =51
 North Macedonia
 - 55
 Montenegro
 - =63
 Bosnia and Herzegovina
 - —
 Andorranot placed
 - —
 Gibraltarnot placed
 - —
 Kosovonot placed
 - —
 San Marinonot placed
 - —
 Vatican Citynot placed
06The evidence
Every statistic we hold for Portugal
Grouped by topic. Each row gives the newest edition’s rank or position, the published value and the year the numbers describe — select a row for the world median, the best in the world and the trend.
Governance & Institutions30
Agriculture Orientation Index56th of 132position · derived0.36Agriculture orientation index (1.0 = spending matches sector size)2024
top 43% of 132 countries measured
Food and Agriculture Organization of the United Nations (FAO) · Agriculture orientation index (1.0 = spending matches sector size)
Portugal 0.36 · world median 0.305 (better)
Best in the world 5.38 (Singapore)
▼ -9 percentile points since 2014
Business Ready: Operational Efficiency14th of 50position · derived70.8Operational efficiency score (0–100)2024
top 27% of 50 countries measured
World Bank Group · Operational efficiency score (0–100)
Portugal 70.8 · world median 65.82 (better)
Best in the world 87.33 (Singapore)
No earlier reading to compare
Business Ready: Public Services4th of 50position · derived69.53Public services score (0–100)2024
top 6% of 50 countries measured
World Bank Group · Public services score (0–100)
Portugal 69.53 · world median 50.13 (better)
Best in the world 73.31 (Estonia)
No earlier reading to compare
Business Ready: Regulatory Framework2nd of 50position · derived78.16Regulatory framework score (0–100)2024
top 2% of 50 countries measured
World Bank Group · Regulatory framework score (0–100)
Portugal 78.16 · world median 66.8 (better)
Best in the world 78.34 (Hungary)
No earlier reading to compare
Central Bank Independence Indextop 14%0.796CBI index (0–1, where 1 is the most statutory independence)2023
top 14% of 191 countries measured
Ana Carolina Garriga, University of Essex · CBI index (0–1, where 1 is the most statutory independence)
Portugal 0.796 · world median 0.608
Highest 0.974 (Bosnia and Herzegovina)
No real change since 2013
Civic Space Ratings37th of 198position · derived81Civic space score (0–100)2025
top 19% of 198 countries measured
CIVICUS · Civic space score (0–100)
Portugal 81 · world median 50.46 (better)
Best in the world 100 (Kiribati)
No earlier reading to compare
Climate Readiness (ND-GAIN)35th of 192rank0.572ND-GAIN Readiness (0–1, where 1 is the most ready)2024
top 18% of 192 countries measured
Notre Dame Global Adaptation Initiative (ND-GAIN), University of Notre Dame · ND-GAIN Readiness (0–1, where 1 is the most ready)
Portugal 0.572 · world median 0.387 (better)
Best in the world 0.749 (Singapore)
▼ -3 percentile points since 2014
Completeness of Birth Registrationtop 14%100Children under 5 whose birth is registered (%)2025
top 14% of 185 countries measured
UNICEF · Children under 5 whose birth is registered (%)
Portugal 100 · world median 98.4 (better)
Best in the world 100 (53 countries tied)
No earlier reading to compare
Control of Corruption50th of 211position · derived0.772Control of Corruption (−2.5 to 2.5)2025
top 23% of 211 countries measured
World Bank Group · Control of Corruption (−2.5 to 2.5)
Portugal 0.772 · world median -0.197 (better)
Best in the world 2.259 (Denmark)
No real change since 2015
Corruption Perceptions Index46th of 181rank56CPI score (0–100, where 100 is very clean)2025
top 25% of 182 countries measured · 182 share 181 positions
Transparency International · CPI score (0–100, where 100 is very clean)
Portugal 56 · world median 39 (better)
Best in the world 89 (Denmark)
▼ -9 percentile points since 2015
General Government Consumption62nd of 132position · derived17.05General government final consumption expenditure (% of GDP)2025
top 47% of 132 countries measured
World Bank Group · General government final consumption expenditure (% of GDP)
Portugal 17.05 · world median 16.21
Highest 38.94 (Ukraine)
▼ -4 percentile points since 2015
Government AI Readiness Index28th of 195rank66.09AI readiness score (0–100)2025
top 14% of 195 countries measured
Oxford Insights · AI readiness score (0–100)
Portugal 66.09 · world median 40.19 (better)
Best in the world 88.36 (United States)
No real change since 2020
Government Effectiveness41st of 209position · derived1.022Governance estimate (−2.5 weak to 2.5 strong)2025
top 19% of 209 countries measured
World Bank Group · Governance estimate (−2.5 weak to 2.5 strong)
Portugal 1.022 · world median 0.101 (better)
Best in the world 2.092 (Singapore)
No real change since 2015
Government Funding per Primary Student12th of 68position · derived23.05Government funding per primary student (% of GDP per capita)2022
top 16% of 68 countries measured
UNESCO Institute for Statistics (UIS) · Government funding per primary student (% of GDP per capita)
Portugal 23.05 · world median 17.81 (better)
Best in the world 34.57 (South Korea)
▲ +3 percentile points since 2012
GovTech Maturity Index25th of 196position · derived0.9GTMI score (0–1)2025
top 12% of 196 countries measured
World Bank Group · GTMI score (0–1)
Portugal 0.9 · world median 0.63 (better)
Best in the world 0.997 (South Korea)
▲ +4 percentile points since 2022
Judicial Constraints on the Executive Index26th of 175position · derived0.919Judicial constraints on the executive index (0–1)2025
top 14% of 176 countries measured · 176 share 175 positions
V-Dem Institute, University of Gothenburg · Judicial constraints on the executive index (0–1)
Portugal 0.919 · world median 0.676 (better)
Best in the world 0.988 (Australia)
▼ -9 percentile points since 2015
Liberal Democracy Index26th of 176position · derived0.717Liberal democracy index (0–1)2025
top 14% of 176 countries measured
V-Dem Institute, University of Gothenburg · Liberal democracy index (0–1)
Portugal 0.717 · world median 0.353 (better)
Best in the world 0.884 (Denmark)
▼ -7 percentile points since 2015
Open Data Inventory9th of 168rank83ODIN overall score (0–100)2024
top 6% of 168 countries measured
Open Data Watch · ODIN overall score (0–100)
Portugal 83 · world median 59 (better)
Best in the world 90 (2 countries tied)
▲ +3 percentile points since 2016
Political Corruption Index138th of 176position · derived · 1 = worst0.166Political corruption index (0–1; higher = more corrupt)2025
top 21% of 176 countries measured
V-Dem Institute, University of Gothenburg · Political corruption index (0–1; higher = more corrupt)
Portugal 0.166 · world median 0.518 (better)
Best in the world 0.004 (Denmark)
▼ -6 percentile points since 2015
Public Sector Employment28th of 135position · derived26.92Public sector employment (% of total employment)2022
top 20% of 135 countries measured
World Bank Group · Public sector employment (% of total employment)
Portugal 26.92 · world median 15.01
Highest 47.1 (Maldives)
No earlier reading to compare
Public Sector Wage Bill48th of 168position · derived10.58Public sector wage bill (% of GDP)2022
top 28% of 168 countries measured
World Bank Group · Public sector wage bill (% of GDP)
Portugal 10.58 · world median 7.975
Highest 42.65 (Nauru)
▼ -10 percentile points since 2012
Regulatory Quality56th of 209position · derived0.561Regulatory Quality (−2.5 to 2.5)2025
top 26% of 209 countries measured
World Bank Group · Regulatory Quality (−2.5 to 2.5)
Portugal 0.561 · world median -0.093 (better)
Best in the world 2.113 (Singapore)
▼ -7 percentile points since 2015
Rule of Law36th of 211position · derived1.046Rule of Law estimate (−2.5 to 2.5)2025
top 17% of 211 countries measured
World Bank Group · Rule of Law estimate (−2.5 to 2.5)
Portugal 1.046 · world median -0.102 (better)
Best in the world 2.012 (Finland)
No real change since 2015
Statistical Performance Indicators15th of 188position · derived90.71SPI overall score (0–100)2024
top 7% of 188 countries measured
World Bank Group · SPI overall score (0–100)
Portugal 90.71 · world median 69.3 (better)
Best in the world 94.14 (Norway)
▼ -3 percentile points since 2016
Trade Union Density74th of 139position · derived15.29Employees who are trade union members (%)2020
bottom 47% of 139 countries measured
International Labour Organization (ILO) · Employees who are trade union members (%)
Portugal 15.29 · world median 16.68 (worse)
Best in the world 91.42 (Iceland)
No earlier reading to compare
V-Dem Electoral Democracy Index22nd of 176position · derived0.822Electoral democracy index (0–1)2025
top 12% of 176 countries measured
V-Dem Institute, University of Gothenburg · Electoral democracy index (0–1)
Portugal 0.822 · world median 0.497 (better)
Best in the world 0.913 (Denmark)
▼ -7 percentile points since 2015
Voice and Accountability20th of 206position · derived1.272Voice and Accountability estimate (−2.5 to 2.5)2025
top 9% of 206 countries measured
World Bank Group · Voice and Accountability estimate (−2.5 to 2.5)
Portugal 1.272 · world median -0.022 (better)
Best in the world 1.825 (Norway)
No real change since 2015
Women, Business and the Law1st of 190position · derived100WBL Index (0–100, where 100 is full legal parity)2024
top 3% of 190 countries measured
World Bank Group · WBL Index (0–100, where 100 is full legal parity)
Portugal 100 · world median 81.25 (better)
Best in the world 100 (14 countries tied)
No real change since 2014
Economy & Innovation36
Account Ownership at a Financial Institution34th of 139position · derived91.4Adults with an account (% of population aged 15+)2024
top 24% of 139 countries measured
World Bank Group · Adults with an account (% of population aged 15+)
Portugal 91.4 · world median 72.83 (better)
Best in the world 99.85 (Iceland)
No real change since 2014
Adjusted Net Savings87th of 118position · derived3.057Adjusted net savings, including particulate emission damage (% of GNI)2021
bottom 26% of 118 countries measured
World Bank Group · Adjusted net savings, including particulate emission damage (% of GNI)
Portugal 3.057 · world median 8.389 (worse)
Best in the world 32.18 (Bangladesh)
▲ +6 percentile points since 2011
Agriculture, Forestry and Fishing Value Added (% of GDP)127th of 158position · derived1.96Agriculture, forestry and fishing value added (% of GDP)2025
bottom 20% of 158 countries measured
World Bank Group · Agriculture, forestry and fishing value added (% of GDP)
Portugal 1.96 · world median 6.572
Highest 47.59 (Niger)
▼ -3 percentile points since 2015
Container Port Traffic37th of 103position · derived3,541,777Container port traffic (TEU, twenty-foot equivalent units)2024
top 35% of 103 countries measured
UN Trade and Development (UNCTAD) · Container port traffic (TEU, twenty-foot equivalent units)
Portugal 3,541,777 · world median 1,827,788
Highest 299,703,800 (China)
▼ -12 percentile points since 2014
Crop Production Index65th of 195position · derived113.88Crop production index (2014–2016 = 100)2022
top 33% of 195 countries measured
Food and Agriculture Organization of the United Nations (FAO) · Crop production index (2014–2016 = 100)
Portugal 113.88 · world median 106.23 (better)
Best in the world 189.93 (Senegal)
▲ +40 percentile points since 2012
Digitally-Deliverable Services Exports77th of 170position · derived27.97Digitally-deliverable services exports (% of services exports)2024
top 45% of 170 countries measured
UN Trade and Development (UNCTAD) · Digitally-deliverable services exports (% of services exports)
Portugal 27.97 · world median 25.42 (better)
Best in the world 87.15 (Ireland)
No real change since 2014
Economic Complexity Index41st of 145rank0.713ECI score (standardised, roughly −3 to +3)2024
top 28% of 145 countries measured
Growth Lab at Harvard University · ECI score (standardised, roughly −3 to +3)
Portugal 0.713 · world median 0.131 (better)
Best in the world 1.729 (Japan)
No real change since 2014
Exports of Goods and Services (% of GDP)50th of 138position · derived43.66Exports of goods and services (% of GDP)2025
top 36% of 138 countries measured
World Bank Group · Exports of goods and services (% of GDP)
Portugal 43.66 · world median 36.34
Highest 199.76 (Hong Kong)
▲ +3 percentile points since 2015
Firms with a Bank Loan or Line of Credit46th of 179position · derived48.24Firms with a bank loan or line of credit (%)2025
top 25% of 179 countries measured
World Bank Group · Firms with a bank loan or line of credit (%)
Portugal 48.24 · world median 35.95 (better)
Best in the world 88.52 (Israel)
No earlier reading to compare
Food Production Index83rd of 195position · derived110.34Food production index (2014–2016 = 100)2022
top 42% of 195 countries measured
Food and Agriculture Organization of the United Nations (FAO) · Food production index (2014–2016 = 100)
Portugal 110.34 · world median 106.08 (better)
Best in the world 177.49 (Senegal)
▲ +20 percentile points since 2012
Foreign Direct Investment Inflowstop 36%2.922FDI inflows (% of GDP)2025
top 36% of 202 countries measured
UN Trade and Development (UNCTAD) · FDI inflows (% of GDP)
Portugal 2.922 · world median 1.968
Highest 2,221 (British Virgin Islands)
▼ -6 percentile points since 2015
GDP Growth137th of 186position · derived1.864GDP growth (annual %)2025
bottom 26% of 186 countries measured
World Bank Group · GDP growth (annual %)
Portugal 1.864 · world median 3.396 (worse)
Best in the world 19.34 (Guyana)
▼ -4 percentile points since 2015
GDP per Capita (PPP)43rd of 185position · derived42,577GDP per capita (constant 2021 international $, PPP)2025
top 23% of 185 countries measured
World Bank Group · GDP per capita (constant 2021 international $, PPP)
Portugal 42,577 · world median 17,265 (better)
Best in the world 139,593 (Singapore)
No real change since 2015
Gini Index30th of 60position · derived · 1 = worst33.85Gini index (0 = perfect equality, 100 = perfect inequality)2023
bottom 49% of 60 countries measured
World Bank Group · Gini index (0 = perfect equality, 100 = perfect inequality)
Portugal 33.85 · world median 33.72 (worse)
Best in the world 23 (India)
No real change since 2013
Global Innovation Index31st of 139rank43.86GII score (0–100)2025
top 22% of 139 countries measured
World Intellectual Property Organization · GII score (0–100)
Portugal 43.86 · world median 28.52 (better)
Best in the world 65.96 (Switzerland)
No real change since 2022
GNI per Capita (PPP)19th of 102position · derived43,133GNI per capita (constant 2021 international $, PPP)2025
top 18% of 102 countries measured
World Bank Group · GNI per capita (constant 2021 international $, PPP)
Portugal 43,133 · world median 14,273 (better)
Best in the world 116,633 (Singapore)
▲ +8 percentile points since 2015
Gross Capital Formation (% of GDP)84th of 131position · derived21.04Gross capital formation (% of GDP)2025
bottom 36% of 131 countries measured
World Bank Group · Gross capital formation (% of GDP)
Portugal 21.04 · world median 22.93
Highest 45.27 (Algeria)
▲ +25 percentile points since 2015
Gross Savings (% of GDP)74th of 146position · derived21.99Gross savings (% of GDP)2024
bottom 50% of 146 countries measured
World Bank Group · Gross savings (% of GDP)
Portugal 21.99 · world median 22.06
Highest 47.82 (Macau)
▲ +24 percentile points since 2014
Household Consumption68th of 131position · derived61Household and NPISH final consumption expenditure (% of GDP)2025
bottom 48% of 131 countries measured
World Bank Group · Household and NPISH final consumption expenditure (% of GDP)
Portugal 61 · world median 62.04
Highest 133.34 (Somalia)
▼ -9 percentile points since 2015
ICT Goods Exports32nd of 119position · derived3.7ICT goods exports (% of total goods exports)2024
top 26% of 120 countries measured · 120 share 119 positions
UN Trade and Development (UNCTAD) · ICT goods exports (% of total goods exports)
Portugal 3.7 · world median 0.975 (better)
Best in the world 61.45 (Hong Kong)
▲ +5 percentile points since 2014
ICT Services Exports55th of 118position · derived8.005ICT services exports (% of services exports)2024
top 46% of 118 countries measured
UN Trade and Development (UNCTAD) · ICT services exports (% of services exports)
Portugal 8.005 · world median 7.474 (better)
Best in the world 56.25 (Ireland)
▲ +9 percentile points since 2014
Imports of Goods and Services (% of GDP)67th of 138position · derived42.74Imports of goods and services (% of GDP)2025
top 48% of 138 countries measured
World Bank Group · Imports of goods and services (% of GDP)
Portugal 42.74 · world median 41.72
Highest 196.89 (Hong Kong)
▲ +6 percentile points since 2015
Industry Value Added including Construction (% of GDP)122nd of 158position · derived18.25Industry, including construction, value added (% of GDP)2025
bottom 23% of 158 countries measured
World Bank Group · Industry, including construction, value added (% of GDP)
Portugal 18.25 · world median 24.65
Highest 75.09 (Guyana)
▼ -12 percentile points since 2015
Liner Shipping Connectivity Index32nd of 175rank169.49LSCI (index, average Q1 2023 = 100)2026
top 19% of 167 countries measured · 167 share 175 positions
UN Trade and Development (UNCTAD) · LSCI (index, average Q1 2023 = 100)
Portugal 169.49 · world median 56.21 (better)
Best in the world 1,319 (China)
No real change since 2016
Livestock Production Index106th of 194position · derived104.85Livestock production index (2014–2016 = 100)2022
bottom 46% of 194 countries measured
Food and Agriculture Organization of the United Nations (FAO) · Livestock production index (2014–2016 = 100)
Portugal 104.85 · world median 107.06 (worse)
Best in the world 190.08 (Malawi)
▼ -23 percentile points since 2012
Logistics Performance Index38th of 139rank3.4LPI score (1–5)2023
top 28% of 139 countries measured
World Bank Group · LPI score (1–5)
Portugal 3.4 · world median 2.9 (better)
Best in the world 4.3 (Singapore)
▼ -13 percentile points since 2014
Manufacturing Value Added (% of GDP)66th of 132position · derived11.3Manufacturing value added (% of GDP)2025
top 50% of 132 countries measured
World Bank Group · Manufacturing value added (% of GDP)
Portugal 11.3 · world median 11.26
Highest 43.97 (Puerto Rico)
▼ -10 percentile points since 2015
Palma Ratio29th of 60position · derived · 1 = worst1.353Palma ratio (income share of the richest 10% ÷ share of the poorest 40%)2023
bottom 47% of 60 countries measured
World Bank Group · Palma ratio (income share of the richest 10% ÷ share of the poorest 40%)
Portugal 1.353 · world median 1.332 (worse)
Best in the world 0.771 (Slovakia)
No real change since 2013
Research and Development Spending23rd of 84position · derived1.695Gross domestic expenditure on R&D (% of GDP)2023
top 27% of 84 countries measured
UNESCO Institute for Statistics (UIS) · Gross domestic expenditure on R&D (% of GDP)
Portugal 1.695 · world median 0.814 (better)
Best in the world 6.346 (Israel)
No real change since 2013
Researchers per Million Inhabitants12th of 145position · derived5,983Researchers per million inhabitants (full-time equivalent)2024
top 8% of 145 countries measured
UNESCO Institute for Statistics (UIS) · Researchers per million inhabitants (full-time equivalent)
Portugal 5,983 · world median 701.95 (better)
Best in the world 18,130 (Liechtenstein)
No earlier reading to compare
Tariff Rate, Applied, Weighted Mean, All Productsbottom 21%1.33Applied tariff rate, trade-weighted mean (%)2022
bottom 21% of 143 countries measured
World Bank Group · Applied tariff rate, trade-weighted mean (%)
Portugal 1.33 · world median 3.66
Highest 29.52 (Bermuda)
▲ +6 percentile points since 2012
Total Natural Resources Rents (% of GDP)139th of 180position · derived0.291Natural resources rents (% of GDP)2021
bottom 30% of 197 countries measured · 197 share 180 positions
World Bank Group · Natural resources rents (% of GDP)
Portugal 0.291 · world median 1.708
Highest 61.03 (Libya)
▲ +3 percentile points since 2011
Trade (% of GDP)62nd of 138position · derived86.4Exports plus imports (% of GDP)2025
top 45% of 138 countries measured
World Bank Group · Exports plus imports (% of GDP)
Portugal 86.4 · world median 79.68
Highest 396.65 (Hong Kong)
No real change since 2015
World Energy Trilemma Index17th of 99rank76.7Trilemma score (0–100)2023
top 16% of 126 countries measured · 126 share 99 positions
World Energy Council · Trilemma score (0–100)
Portugal 76.7 · world median 63.8 (better)
Best in the world 83.2 (Denmark)
No earlier reading to compare
Work & Labour19
Average Weekly Hours Worked150th of 182position · derived33.46Average weekly hours actually worked per employed person2025
bottom 18% of 182 countries measured
International Labour Organization (ILO) · Average weekly hours actually worked per employed person
Portugal 33.46 · world median 38.89
Highest 54.7 (Bhutan)
▼ -4 percentile points since 2015
Employment in Agriculture145th of 182position · derived2.776Employment in agriculture (% of total employment)2025
bottom 20% of 182 countries measured
International Labour Organization (ILO) · Employment in agriculture (% of total employment)
Portugal 2.776 · world median 14.38
Highest 85.34 (Burundi)
No real change since 2015
Employment in Industry46th of 182position · derived24.55Employment in industry (% of total employment)2025
top 25% of 182 countries measured
International Labour Organization (ILO) · Employment in industry (% of total employment)
Portugal 24.55 · world median 18.88
Highest 39.44 (Oman)
▲ +2 percentile points since 2015
Employment in Services47th of 182position · derived72.67Employment in services (% of total employment)2025
top 25% of 182 countries measured
International Labour Organization (ILO) · Employment in services (% of total employment)
Portugal 72.67 · world median 59.51
Highest 92.17 (Djibouti)
▼ -4 percentile points since 2015
Employment-to-Population Ratio116th of 182position · derived54.58Employed share of the population aged 15+ (%)2025
bottom 36% of 182 countries measured
International Labour Organization (ILO) · Employed share of the population aged 15+ (%)
Portugal 54.58 · world median 57.72 (worse)
Best in the world 86.9 (Qatar)
▲ +8 percentile points since 2015
Fatal Occupational Injuriesbottom 33%2.69Fatal occupational injuries per 100,000 workers2023
bottom 33% of 52 countries measured
International Labour Organization (ILO) · Fatal occupational injuries per 100,000 workers
Portugal 2.69 · world median 2.005 (worse)
Best in the world 0.12 (Belgium)
▼ -10 percentile points since 2013
Female Labour Force Participation Rate84th of 182position · derived54.63Women aged 15+ in the labour force (%)2025
top 46% of 182 countries measured
International Labour Organization (ILO) · Women aged 15+ in the labour force (%)
Portugal 54.63 · world median 53.36 (better)
Best in the world 82.91 (Madagascar)
No real change since 2015
Female Share of Senior and Middle Management32nd of 86position · derived38.65Women in senior and middle management (% of managers)2024
top 36% of 86 countries measured
International Labour Organization (ILO) · Women in senior and middle management (% of managers)
Portugal 38.65 · world median 35.86 (better)
Best in the world 56.69 (Nauru)
▲ +9 percentile points since 2014
Firms with a Female Top Manager92nd of 179position · derived19.08Firms with a female top manager (%)2025
bottom 49% of 179 countries measured
World Bank Group · Firms with a female top manager (%)
Portugal 19.08 · world median 19.16 (worse)
Best in the world 62.9 (Kiribati)
No earlier reading to compare
GDP per Person Employed40th of 168position · derived89,377GDP per person employed (constant 2021 international $)2025
top 23% of 168 countries measured
World Bank Group · GDP per person employed (constant 2021 international $)
Portugal 89,377 · world median 47,384 (better)
Best in the world 262,554 (Luxembourg)
No real change since 2015
Informal Employment Rate92nd of 97position · derived · 1 = worst2.328Informal employment (% of total employment)2025
top 5% of 97 countries measured
International Labour Organization (ILO) · Informal employment (% of total employment)
Portugal 2.328 · world median 36.83 (better)
Best in the world 0.857 (Hungary)
No earlier reading to compare
Labour Force Participation Rate116th of 182position · derived58.16Population aged 15+ in the labour force (%)2025
bottom 36% of 182 countries measured
International Labour Organization (ILO) · Population aged 15+ in the labour force (%)
Portugal 58.16 · world median 61.66 (worse)
Best in the world 87.01 (Qatar)
▲ +3 percentile points since 2015
Labour Productivity per Hour Worked39th of 182position · derived52.91Output per hour worked (constant 2021 international $ at PPP)2025
top 21% of 182 countries measured
International Labour Organization (ILO) · Output per hour worked (constant 2021 international $ at PPP)
Portugal 52.91 · world median 22.16 (better)
Best in the world 164.65 (Ireland)
No real change since 2015
Self-Employment Rate142nd of 182position · derived14.43Self-employed (% of total employment)2025
bottom 22% of 182 countries measured
International Labour Organization (ILO) · Self-employed (% of total employment)
Portugal 14.43 · world median 31.84
Highest 91.56 (Chad)
▼ -4 percentile points since 2015
Unemployment Rate70th of 182position · derived · 1 = worst6.164Unemployment (% of labour force)2025
bottom 38% of 182 countries measured
International Labour Organization (ILO) · Unemployment (% of labour force)
Portugal 6.164 · world median 5.084 (worse)
Best in the world 0.13 (Qatar)
▲ +19 percentile points since 2015
Vulnerable Employment145th of 182position · derived · 1 = worst9.657Vulnerable employment (% of total employment)2025
top 20% of 182 countries measured
International Labour Organization (ILO) · Vulnerable employment (% of total employment)
Portugal 9.657 · world median 28.67 (better)
Best in the world 0.456 (Qatar)
▲ +2 percentile points since 2015
Youth Not in Education, Employment or Training85th of 97position · derived · 1 = worst7.761Youth not in education, employment or training (%)2024
top 13% of 97 countries measured
International Labour Organization (ILO) · Youth not in education, employment or training (%)
Portugal 7.761 · world median 14.31 (better)
Best in the world 3.975 (Iceland)
▲ +15 percentile points since 2014
Youth Unemployment Rate47th of 182position · derived · 1 = worst20.22Unemployment, ages 15-24 (% of youth labour force)2025
bottom 25% of 182 countries measured
International Labour Organization (ILO) · Unemployment, ages 15-24 (% of youth labour force)
Portugal 20.22 · world median 12.83 (worse)
Best in the world 0.457 (Niger)
▲ +8 percentile points since 2015
Education & Knowledge16
Academic Freedom Index49th of 176position · derived0.826Academic freedom index (0–1)2025
top 27% of 176 countries measured
V-Dem Institute, University of Gothenburg · Academic freedom index (0–1)
Portugal 0.826 · world median 0.619 (better)
Best in the world 0.978 (Czechia)
▼ -23 percentile points since 2015
Adult Literacy Rate82nd of 172position · derived94.48Adults 15+ who can read and write (%)2024
top 47% of 172 countries measured
UNESCO Institute for Statistics (UIS) · Adults 15+ who can read and write (%)
Portugal 94.48 · world median 93.99 (better)
Best in the world 100 (3 countries tied)
No earlier reading to compare
Expected Years of Schooling20th of 195position · derived17.49Expected years of schooling2023
top 10% of 195 countries measured
UNDP Human Development Report Office · Expected years of schooling
Portugal 17.49 · world median 13.34 (better)
Best in the world 21.69 (Monaco)
▲ +4 percentile points since 2013
Female Share of Researcherstop 37%42.71Researchers who are women (% of headcount; 50 = parity)2024
top 37% of 153 countries measured
UNESCO Institute for Statistics (UIS) · Researchers who are women (% of headcount; 50 = parity)
Portugal 42.71 · world median 38.17
Highest 76.54 (Myanmar)
No earlier reading to compare
Harmonized Test Scores26th of 172position · derived508.51Harmonized test score (TIMSS-equivalent points; 300 = minimum, 625 = advanced attainment)2020
top 15% of 172 countries measured
World Bank Group · Harmonized test score (TIMSS-equivalent points; 300 = minimum, 625 = advanced attainment)
Portugal 508.51 · world median 414.32 (better)
Best in the world 575.27 (Singapore)
▲ +11 percentile points since 2010
Learning Poverty102nd of 125position · derived · 1 = worst7.97810-year-olds who cannot read and understand a simple text (%)2023
top 19% of 125 countries measured
World Bank Group and UNESCO Institute for Statistics · 10-year-olds who cannot read and understand a simple text (%)
Portugal 7.978 · world median 34.02 (better)
Best in the world 2.331 (Ireland)
No earlier reading to compare
Learning-Adjusted Years of School16th of 172position · derived11.31Learning-adjusted years of school (0–14)2020
top 9% of 172 countries measured
World Bank Group · Learning-adjusted years of school (0–14)
Portugal 11.31 · world median 7.941 (better)
Best in the world 12.81 (Singapore)
▲ +11 percentile points since 2010
Mean Years of Schooling99th of 193position · derived9.703Mean years of schooling (adults 25+)2023
bottom 49% of 193 countries measured
UNDP Human Development Report Office · Mean years of schooling (adults 25+)
Portugal 9.703 · world median 9.933 (worse)
Best in the world 14.3 (Germany)
No real change since 2013
Outbound Mobility Ratio, Tertiarybottom 39%3.867Outbound mobility ratio, tertiary (% of tertiary enrolment at home)2023
bottom 39% of 117 countries measured
UNESCO Institute for Statistics (UIS) · Outbound mobility ratio, tertiary (% of tertiary enrolment at home)
Portugal 3.867 · world median 5.279
Highest 1,724 (Cook Islands)
No real change since 2015
PISA Mathematics Performance29th of 79position · derived471.91Mean mathematics score2022
top 36% of 79 countries measured
OECD · Mean mathematics score
Portugal 471.91 · world median 442.09 (better)
Best in the world 574.66 (Singapore)
▲ +9 percentile points since 2012
PISA Reading Performance24th of 79position · derived476.59Mean reading score2022
top 29% of 79 countries measured
OECD · Mean reading score
Portugal 476.59 · world median 440.35 (better)
Best in the world 542.55 (Singapore)
▲ +20 percentile points since 2012
PISA Science Performance30th of 79position · derived484.37Mean science score2022
top 37% of 79 countries measured
OECD · Mean science score
Portugal 484.37 · world median 446.93 (better)
Best in the world 561.43 (Singapore)
▲ +17 percentile points since 2012
Primary Completion Rate45th of 165position · derived99.48Primary completion rate (%)2025
top 27% of 165 countries measured
UNESCO Institute for Statistics (UIS) · Primary completion rate (%)
Portugal 99.48 · world median 97.43 (better)
Best in the world 100 (5 countries tied)
▼ -4 percentile points since 2015
Upper Secondary Attainment62nd of 95position · derived46.35Adults 25+ who completed upper secondary or higher (%)2023
bottom 35% of 95 countries measured
UNESCO Institute for Statistics (UIS) · Adults 25+ who completed upper secondary or higher (%)
Portugal 46.35 · world median 65.76 (worse)
Best in the world 97.89 (Belarus)
▲ +13 percentile points since 2013
Upper Secondary Completion Rate54th of 164position · derived83.1Upper secondary completion rate (%)2025
top 33% of 164 countries measured
UNESCO Institute for Statistics (UIS) · Upper secondary completion rate (%)
Portugal 83.1 · world median 64.87 (better)
Best in the world 99.27 (South Korea)
▲ +4 percentile points since 2015
Youth Literacy Ratetop 29%99.4415–24 year-olds who can read and write (%)2024
top 29% of 174 countries measured
UNESCO Institute for Statistics (UIS) · 15–24 year-olds who can read and write (%)
Portugal 99.44 · world median 98.22 (better)
Best in the world 100 (6 countries tied)
No earlier reading to compare
Health & Wellbeing15
Births Attended by Skilled Health Staff12th of 86position · derived99.9Births attended by skilled health staff (%)2019
top 18% of 86 countries measured
UNICEF · Births attended by skilled health staff (%)
Portugal 99.9 · world median 98.8 (better)
Best in the world 100 (11 countries tied)
▼ -3 percentile points since 2011
Dietary Energy Supply15th of 155position · derived3,596Dietary energy supply (kcal per person per day)2024
top 9% of 155 countries measured
Food and Agriculture Organization of the United Nations (FAO) · Dietary energy supply (kcal per person per day)
Portugal 3,596 · world median 2,982 (better)
Best in the world 3,962 (United States)
No real change since 2014
Gender Inequality Index26th of 172rank0.076GII (0 = full equality, 1 = maximum inequality)2023
top 15% of 172 countries measured
UNDP Human Development Report Office · GII (0 = full equality, 1 = maximum inequality)
Portugal 0.076 · world median 0.351 (better)
Best in the world 0.003 (Denmark)
▼ -4 percentile points since 2013
Global Violent Deaths174th of 206position · derived · 1 = worst0.91Violent deaths per 100,000 people2021
top 17% of 209 countries measured · 209 share 206 positions
Small Arms Survey · Violent deaths per 100,000 people
Portugal 0.91 · world median 4.02 (better)
Best in the world 0 (4 countries tied)
No real change since 2011
Human Capital Index17th of 172position · derived0.769HCI score (0–1)2020
top 9% of 172 countries measured
World Bank Group · HCI score (0–1)
Portugal 0.769 · world median 0.564 (better)
Best in the world 0.879 (Singapore)
▲ +11 percentile points since 2010
Human Development Index40th of 193rank0.89HDI score (0–1)2023
top 20% of 193 countries measured
UNDP Human Development Report Office · HDI score (0–1)
Portugal 0.89 · world median 0.762 (better)
Best in the world 0.972 (Iceland)
No real change since 2013
Infant Mortality Rate179th of 200position · derived · 1 = worst2.669Deaths before age one (per 1,000 live births)2024
top 11% of 200 countries measured
UN Inter-agency Group for Child Mortality Estimation (UN IGME) · Deaths before age one (per 1,000 live births)
Portugal 2.669 · world median 12.26 (better)
Best in the world 1.214 (San Marino)
▼ -4 percentile points since 2014
Life Expectancy at Age 6520th of 222position · derived20.88Further years a 65-year-old would live at current death rates2023
top 9% of 222 countries measured
UN DESA Population Division · Further years a 65-year-old would live at current death rates
Portugal 20.88 · world median 16.39 (better)
Best in the world 23.21 (Monaco)
▲ +4 percentile points since 2013
Life Expectancy at Birth27th of 222position · derived82.36Years a newborn would live at current death rates2023
top 12% of 222 countries measured
UN DESA Population Division · Years a newborn would live at current death rates
Portugal 82.36 · world median 74.63 (better)
Best in the world 86.37 (Monaco)
▲ +3 percentile points since 2013
Maternal Mortality Ratio136th of 195position · derived · 1 = worst14.95Maternal deaths per 100,000 live births2023
top 30% of 195 countries measured
UN Maternal Mortality Estimation Inter-Agency Group (MMEIG) · Maternal deaths per 100,000 live births
Portugal 14.95 · world median 46.65 (better)
Best in the world 0.11 (Cook Islands)
▼ -6 percentile points since 2013
Pesticide Use per Hectare55th of 178position · derived4.82Pesticide use (kg per hectare of cropland)2024
top 30% of 181 countries measured · 181 share 178 positions
Food and Agriculture Organization of the United Nations (FAO) · Pesticide use (kg per hectare of cropland)
Portugal 4.82 · world median 1.73
Highest 37.72 (Antigua and Barbuda)
▼ -10 percentile points since 2014
Prevalence of Severe Food Insecurity82nd of 127position · derived · 1 = worst3.1Population in severe food insecurity (%)2023
top 39% of 133 countries measured · 133 share 127 positions
Food and Agriculture Organization of the United Nations (FAO) · Population in severe food insecurity (%)
Portugal 3.1 · world median 4.7 (better)
Best in the world 0 (7 countries tied)
▲ +15 percentile points since 2015
Prevalence of Undernourishment104th of 104position · derived · 1 = worst2.5Population undernourished (%)2023
top 19% of 165 countries measured · 165 share 104 positions
Food and Agriculture Organization of the United Nations (FAO) · Population undernourished (%)
Portugal 2.5 · world median 5.2 (better)
Best in the world 2.5 (62 countries tied)
▼ -3 percentile points since 2013
Stunting Prevalence in Children Under Five143rd of 162position · derived · 1 = worst3.247Children under 5 who are stunted (%)2024
top 12% of 162 countries measured
UNICEF, WHO and World Bank Group (Joint Malnutrition Estimates) · Children under 5 who are stunted (%)
Portugal 3.247 · world median 13.8 (better)
Best in the world 0.518 (Latvia)
No earlier reading to compare
Under-Five Mortality Rate180th of 200position · derived · 1 = worst3.228Deaths before age five (per 1,000 live births)2024
top 10% of 200 countries measured
UN Inter-agency Group for Child Mortality Estimation (UN IGME) · Deaths before age five (per 1,000 live births)
Portugal 3.228 · world median 14.54 (better)
Best in the world 1.26 (San Marino)
▼ -2 percentile points since 2014
Development & Human Capital10
Access to Electricitytop 28%100Population with electricity access (%)2024
top 28% of 215 countries measured
World Bank Group · Population with electricity access (%)
Portugal 100 · world median 100
Best in the world 100 (122 countries tied)
▼ -8 percentile points since 2014
Cereal Yield38th of 179position · derived5,521Cereal yield (kg per hectare)2023
top 21% of 179 countries measured
Food and Agriculture Organization of the United Nations (FAO) · Cereal yield (kg per hectare)
Portugal 5,521 · world median 3,072 (better)
Best in the world 29,147 (Oman)
▲ +4 percentile points since 2013
Coefficient of Human Inequality122nd of 169position · derived · 1 = worst10.44Coefficient of Human Inequality (%)2023
top 28% of 169 countries measured
UNDP Human Development Report Office · Coefficient of Human Inequality (%)
Portugal 10.44 · world median 17.05 (better)
Best in the world 4.865 (Slovenia)
▲ +7 percentile points since 2013
Gender Development Index1st of 184position · derived1Gender Development Index (1.000 = parity)2023
top 1% of 184 countries measured
UNDP Human Development Report Office · Gender Development Index (1.000 = parity)
Portugal 1 · world median 0.971 (better)
Best in the world 1 (2 countries tied)
▲ +12 percentile points since 2013
Inequality-adjusted Human Development Index40th of 169position · derived0.795IHDI (0–1)2023
top 23% of 169 countries measured
UNDP Human Development Report Office · IHDI (0–1)
Portugal 0.795 · world median 0.609 (better)
Best in the world 0.923 (Iceland)
▲ +4 percentile points since 2013
Planetary pressures-adjusted HDI9th of 156position · derived0.797PHDI (0–1)2023
top 5% of 156 countries measured
UNDP Human Development Report Office · PHDI (0–1)
Portugal 0.797 · world median 0.678 (better)
Best in the world 0.827 (United Kingdom)
No real change since 2013
Poverty Gap at $3.00 a Day39th of 59position · derived · 1 = worst0.2Poverty gap at $3.00 a day, 2021 PPP (%)2023
top 36% of 60 countries measured · 60 share 59 positions
World Bank Group · Poverty gap at $3.00 a day, 2021 PPP (%)
Portugal 0.2 · world median 0.345 (better)
Best in the world 0 (2 countries tied)
▲ +14 percentile points since 2013
Poverty Headcount Ratio at $3.00 a Day40th of 58position · derived · 1 = worst0.41Population below $3.00 a day, 2021 PPP (%)2023
top 34% of 60 countries measured · 60 share 58 positions
World Bank Group · Population below $3.00 a day, 2021 PPP (%)
Portugal 0.41 · world median 0.93 (better)
Best in the world 0 (3 countries tied)
▲ +12 percentile points since 2013
Poverty Headcount Ratio at $8.30 a Day40th of 59position · derived · 1 = worst2.16Population below $8.30 a day, 2021 PPP (%)2023
top 34% of 60 countries measured · 60 share 59 positions
World Bank Group · Population below $8.30 a day, 2021 PPP (%)
Portugal 2.16 · world median 7.82 (better)
Best in the world 0.07 (2 countries tied)
▲ +6 percentile points since 2013
Prosperity Gap43rd of 60position · derived · 1 = worst1.098Average factor incomes must rise by to reach $28 a day2023
top 29% of 60 countries measured
World Bank Group · Average factor incomes must rise by to reach $28 a day
Portugal 1.098 · world median 1.754 (better)
Best in the world 0.406 (Luxembourg)
▲ +10 percentile points since 2013
Environment & Sustainability23
Agricultural Emissions97th of 193position · derived8,780Farm-gate emissions (kt CO₂eq)2023
top 49% of 198 countries measured · 198 share 193 positions
Food and Agriculture Organization of the United Nations (FAO) · Farm-gate emissions (kt CO₂eq)
Portugal 8,780 · world median 8,635
Highest 1,044,508 (India)
No real change since 2013
Agricultural Irrigated Land24th of 121position · derived14.74Irrigated share of agricultural land (%)2023
top 19% of 121 countries measured
Food and Agriculture Organization of the United Nations (FAO) · Irrigated share of agricultural land (%)
Portugal 14.74 · world median 3.66
Highest 89.04 (Bangladesh)
No earlier reading to compare
Agricultural Land85th of 209position · derived43.34Agricultural land (% of land area)2023
top 40% of 209 countries measured
Food and Agriculture Organization of the United Nations (FAO) · Agricultural land (% of land area)
Portugal 43.34 · world median 37.96
Highest 86.48 (Côte d’Ivoire)
▲ +5 percentile points since 2013
Arable Land per Person120th of 206position · derived0.088Arable land (hectares per person)2023
bottom 42% of 206 countries measured
Food and Agriculture Organization of the United Nations (FAO) · Arable land (hectares per person)
Portugal 0.088 · world median 0.109
Highest 1.459 (Kazakhstan)
No real change since 2013
Carbon Intensity of Electricity169th of 193position · derived · 1 = worst110.64Carbon intensity (gCO₂e per kWh generated)2024
top 13% of 193 countries measured
Ember · Carbon intensity (gCO₂e per kWh generated)
Portugal 110.64 · world median 468.81 (better)
Best in the world 23.49 (Ethiopia)
▲ +16 percentile points since 2014
Climate Vulnerability (ND-GAIN)28th of 190rank0.352ND-GAIN Vulnerability (0–1, where 1 is the most vulnerable)2024
top 14% of 190 countries measured
Notre Dame Global Adaptation Initiative (ND-GAIN), University of Notre Dame · ND-GAIN Vulnerability (0–1, where 1 is the most vulnerable)
Portugal 0.352 · world median 0.45 (better)
Best in the world 0.263 (Norway)
▲ +5 percentile points since 2014
CO₂ Emissions per Capita102nd of 210position · derived · 1 = worst3.409Fossil CO₂ (tonnes per person)2024
bottom 48% of 210 countries measured
Global Carbon Project · Fossil CO₂ (tonnes per person)
Portugal 3.409 · world median 3.21 (worse)
Best in the world 0.054 (DR Congo)
▲ +11 percentile points since 2014
Ecological Footprint27th of 126position · derived · 1 = worst4.261Ecological Footprint (global hectares per person)2025
bottom 21% of 126 countries measured
Global Footprint Network · Ecological Footprint (global hectares per person)
Portugal 4.261 · world median 2.296 (worse)
Best in the world 0.514 (Yemen)
▼ -6 percentile points since 2015
Energy Intensity of GDP (PPP)top 26%2.039Energy use per dollar of GDP (thousand Btu per US$ at PPP)2024
top 26% of 192 countries measured
U.S. Energy Information Administration (EIA) · Energy use per dollar of GDP (thousand Btu per US$ at PPP)
Portugal 2.039 · world median 2.738 (better)
Best in the world 0.666 (Chad)
▲ +17 percentile points since 2014
Fertilizer Consumption per Hectare46th of 188position · derived179.16Fertilizer consumption (kg per hectare of arable land)2023
top 24% of 191 countries measured · 191 share 188 positions
Food and Agriculture Organization of the United Nations (FAO) · Fertilizer consumption (kg per hectare of arable land)
Portugal 179.16 · world median 87.36
Highest 2,926 (Malaysia)
▲ +4 percentile points since 2013
Forest Area85th of 210position · derived36.15Forest area (% of land area)2023
top 40% of 213 countries measured · 213 share 210 positions
Food and Agriculture Organization of the United Nations (FAO) · Forest area (% of land area)
Portugal 36.15 · world median 31.08
Highest 94.45 (Suriname)
No real change since 2013
Internal Displacements by Disaster118th of 160position · derived · 1 = worst700New displacements by disaster (people)2024
top 26% of 160 countries measured
Internal Displacement Monitoring Centre (IDMC) · New displacements by disaster (people)
Portugal 700 · world median 4,750 (better)
Best in the world 1 (Serbia)
▼ -26 percentile points since 2015
Land Under Cereal Production122nd of 179position · derived188,820Land under cereal production (hectares)2023
bottom 32% of 180 countries measured · 180 share 179 positions
Food and Agriculture Organization of the United Nations (FAO) · Land under cereal production (hectares)
Portugal 188,820 · world median 689,278
Highest 103,715,108 (India)
▼ -6 percentile points since 2013
Livestock Density91st of 188position · derived0.55Livestock units per hectare of agricultural land2023
top 48% of 188 countries measured
Food and Agriculture Organization of the United Nations (FAO) · Livestock units per hectare of agricultural land
Portugal 0.55 · world median 0.535
Highest 43.97 (Singapore)
▼ -9 percentile points since 2013
Low-Carbon Share of Electricity Generation34th of 190position · derived85.2Low-carbon sources (% of electricity generated)2024
top 17% of 193 countries measured · 193 share 190 positions
Ember · Low-carbon sources (% of electricity generated)
Portugal 85.2 · world median 35.66 (better)
Best in the world 100 (7 countries tied)
▲ +7 percentile points since 2014
ND-GAIN Country Index30th of 190rank60.99ND-GAIN Index (0–100, where 100 is best placed to adapt)2024
top 15% of 190 countries measured
Notre Dame Global Adaptation Initiative (ND-GAIN), University of Notre Dame · ND-GAIN Index (0–100, where 100 is best placed to adapt)
Portugal 60.99 · world median 47.44 (better)
Best in the world 71.85 (Norway)
No real change since 2014
Organic Agricultural Area7th of 150position · derived21.23Organic share of agricultural land (%)2024
top 4% of 156 countries measured · 156 share 150 positions
Food and Agriculture Organization of the United Nations (FAO) · Organic share of agricultural land (%)
Portugal 21.23 · world median 0.725 (better)
Best in the world 86.38 (Samoa)
▲ +10 percentile points since 2014
Renewable Internal Freshwater Resources per Capita74th of 181position · derived3,642Renewable internal freshwater (cubic metres per person)2022
top 41% of 181 countries measured
Food and Agriculture Organization of the United Nations (FAO) · Renewable internal freshwater (cubic metres per person)
Portugal 3,642 · world median 2,528 (better)
Best in the world 445,023 (Iceland)
No real change since 2012
Renewable Share of Electricity Generation29th of 190position · derived85.2Renewables (% of electricity generated)2024
top 15% of 193 countries measured · 193 share 190 positions
Ember · Renewables (% of electricity generated)
Portugal 85.2 · world median 31.14 (better)
Best in the world 100 (7 countries tied)
▲ +5 percentile points since 2014
Water Stress81st of 177position · derived · 1 = worst12.32Freshwater withdrawal as a share of available resources (%)2023
bottom 45% of 177 countries measured
Food and Agriculture Organization of the United Nations (FAO) · Freshwater withdrawal as a share of available resources (%)
Portugal 12.32 · world median 10 (worse)
Best in the world 0.03 (Republic of the Congo)
▲ +6 percentile points since 2013
Water Withdrawal by Sector96th of 171position · derived55.43Freshwater withdrawn for agriculture (% of total)2022
bottom 45% of 173 countries measured · 173 share 171 positions
Food and Agriculture Organization of the United Nations (FAO) · Freshwater withdrawn for agriculture (% of total)
Portugal 55.43 · world median 62.14
Highest 99.48 (Somalia)
▼ -10 percentile points since 2012
Wind and Solar Share of Electricity Generationtop 2%45.36Wind and solar (% of electricity generated)2024
top 2% of 193 countries measured
Ember · Wind and solar (% of electricity generated)
Portugal 45.36 · world median 5.769 (better)
Best in the world 69.12 (Denmark)
No real change since 2014
World Risk Index89th of 193position · derived · 1 = worst4.76WorldRiskIndex score (0–100, where 100 is the most at risk)2025
bottom 46% of 193 countries measured
Institute for International Law of Peace and Armed Conflict (IFHV), Ruhr University Bochum · WorldRiskIndex score (0–100, where 100 is the most at risk)
Portugal 4.76 · world median 4.17 (worse)
Best in the world 0.18 (Monaco)
▲ +8 percentile points since 2015
Gender & Equality3
Sex Ratio at Birthtop 36%105.6Male births per 100 female births2023
top 36% of 222 countries measured
UN DESA Population Division · Male births per 100 female births
Portugal 105.6 · world median 105.1
Highest 116.3 (Liechtenstein)
▲ +16 percentile points since 2013
Social Institutions and Gender Index132nd of 140position · derived · 1 = worst9.5SIGI score (0 = no discrimination, 100 = absolute)2023
top 5% of 140 countries measured
OECD · SIGI score (0 = no discrimination, 100 = absolute)
Portugal 9.5 · world median 25.2 (better)
Best in the world 6.7 (Norway)
No earlier reading to compare
Women's Political Empowerment Index70th of 176position · derived0.811Women's political empowerment index (0–1)2025
top 39% of 176 countries measured
V-Dem Institute, University of Gothenburg · Women's political empowerment index (0–1)
Portugal 0.811 · world median 0.772 (better)
Best in the world 0.954 (Denmark)
▼ -30 percentile points since 2015
Democracy & Civil Liberties8
Deliberative Democracy Index27th of 176position · derived0.691Deliberative democracy index (0–1)2025
top 15% of 176 countries measured
V-Dem Institute, University of Gothenburg · Deliberative democracy index (0–1)
Portugal 0.691 · world median 0.339 (better)
Best in the world 0.867 (Denmark)
▼ -7 percentile points since 2015
Egalitarian Democracy Index37th of 176position · derived0.614Egalitarian democracy index (0–1)2025
top 21% of 176 countries measured
V-Dem Institute, University of Gothenburg · Egalitarian democracy index (0–1)
Portugal 0.614 · world median 0.321 (better)
Best in the world 0.876 (Denmark)
▼ -14 percentile points since 2015
Freedom of Expression and Alternative Sources of Information Index30th of 176position · derived0.899Freedom of expression index (0–1)2025
top 17% of 176 countries measured
V-Dem Institute, University of Gothenburg · Freedom of expression index (0–1)
Portugal 0.899 · world median 0.693 (better)
Best in the world 0.98 (Denmark)
▼ -12 percentile points since 2015
Government Censorship of the Media4th of 176position · derived3.187Original latent estimate (≈ −3 to +3.5); higher = less censorship2025
top 2% of 176 countries measured
V-Dem Institute, University of Gothenburg · Original latent estimate (≈ −3 to +3.5); higher = less censorship
Portugal 3.187 · world median 0.565 (better)
Best in the world 3.489 (Belgium)
▲ +11 percentile points since 2015
Government Internet Shutdowns49th of 176position · derived1.711Original latent estimate (≈ −4 to +2); higher = fewer shutdowns2025
top 27% of 176 countries measured
V-Dem Institute, University of Gothenburg · Original latent estimate (≈ −4 to +2); higher = fewer shutdowns
Portugal 1.711 · world median 1.023 (better)
Best in the world 2.081 (Spain)
▼ -26 percentile points since 2015
Military Dimension Indextop 21%0Military dimension index (0–1; higher = larger military role)2025
top 21% of 176 countries measured
V-Dem Institute, University of Gothenburg · Military dimension index (0–1; higher = larger military role)
Portugal 0 · world median 0.1 (better)
Best in the world 0 (76 countries tied)
▼ -4 percentile points since 2015
Participatory Democracy Index29th of 176position · derived0.529Participatory democracy index (0–1)2025
top 16% of 176 countries measured
V-Dem Institute, University of Gothenburg · Participatory democracy index (0–1)
Portugal 0.529 · world median 0.298 (better)
Best in the world 0.785 (Switzerland)
▼ -7 percentile points since 2015
Physical Violence Index33rd of 176position · derived0.946Freedom from political killings and torture (0–1)2025
top 18% of 176 countries measured
V-Dem Institute, University of Gothenburg · Freedom from political killings and torture (0–1)
Portugal 0.946 · world median 0.79 (better)
Best in the world 0.989 (2 countries tied)
▼ -14 percentile points since 2015
Peace & Security6
Deaths in Organized Violence59th of 59position · derived · 1 = worst0Deaths in organized violence (people)2025
top 35% of 196 countries measured · 196 share 59 positions
Uppsala Conflict Data Program (UCDP) · Deaths in organized violence (people)
Portugal 0 · world median 0
Best in the world 0 (138 countries tied)
No real change since 2015
Global Militarisation Index74th of 149rank · 1 = worst101.74GMI score (higher means a heavier military weight)2023
bottom 49% of 149 countries measured
Bonn International Centre for Conflict Studies (BICC) · GMI score (higher means a heavier military weight)
Portugal 101.74 · world median 100.66 (worse)
Best in the world 3.512 (Haiti)
▲ +9 percentile points since 2013
INFORM Risk Index174th of 191position · derived · 1 = worst1.9INFORM Risk score (0–10, where 10 is the highest risk)2025
top 7% of 191 countries measured
European Commission Joint Research Centre, with the Inter-Agency Standing Committee · INFORM Risk score (0–10, where 10 is the highest risk)
Portugal 1.9 · world median 3.7 (better)
Best in the world 0.7 (Singapore)
▼ -3 percentile points since 2016
Political Stability and Absence of Violence69th of 211position · derived0.702Political Stability estimate (−2.5 to 2.5)2025
top 32% of 211 countries measured
World Bank Group · Political Stability estimate (−2.5 to 2.5)
Portugal 0.702 · world median 0.171 (better)
Best in the world 1.563 (Andorra)
▼ -15 percentile points since 2015
Political Violence by Non-State Actors160th of 171position · derived · 1 = worst-2.67Original latent estimate (≈ −3.5 to +4); higher = more violence2025
top 6% of 171 countries measured
V-Dem Institute, University of Gothenburg · Original latent estimate (≈ −3.5 to +4); higher = more violence
Portugal -2.67 · world median -0.661 (better)
Best in the world -3.182 (Luxembourg)
No real change since 2015
Refugees by Country of Originbottom 26%109Refugees under UNHCR's mandate from this country, end of year (people)2025
bottom 26% of 202 countries measured
UNHCR, the UN Refugee Agency · Refugees under UNHCR's mandate from this country, end of year (people)
Portugal 109 · world median 1,272
Highest 5,224,131 (Ukraine)
▲ +9 percentile points since 2015
Risk & Resilience2
Asylum-Seekers by Country of Asylumtop 32%8,595Asylum-seekers awaiting a decision, end of year (people)2025
top 32% of 177 countries measured
UNHCR, the UN Refugee Agency · Asylum-seekers awaiting a decision, end of year (people)
Portugal 8,595 · world median 1,836
Highest 3,718,945 (United States)
▲ +16 percentile points since 2015
Refugee Population by Country of Asylumtop 32%70,349Refugees under UNHCR's mandate hosted, end of year (people)2025
top 32% of 177 countries measured
UNHCR, the UN Refugee Agency · Refugees under UNHCR's mandate hosted, end of year (people)
Portugal 70,349 · world median 12,269
Highest 2,655,191 (Germany)
▲ +30 percentile points since 2015
Mobility & Trade3
Average Time to Clear Exports Through Customs48th of 174position · derived · 1 = worst7.712Average time to clear exports through customs (days)2025
bottom 27% of 175 countries measured · 175 share 174 positions
World Bank Group · Average time to clear exports through customs (days)
Portugal 7.712 · world median 4.456 (worse)
Best in the world 1 (2 countries tied)
No earlier reading to compare
Cereal Import Dependency Ratiotop 26%80.8Share of the cereal supply that is imported (%)2022
top 26% of 161 countries measured
Food and Agriculture Organization of the United Nations (FAO) · Share of the cereal supply that is imported (%)
Portugal 80.8 · world median 42.8
Highest 100 (16 countries tied)
▼ -2 percentile points since 2012
Net Migration Ratetop 24%2.79Net migrants per 1,000 population2023
top 24% of 222 countries measured
UN DESA Population Division · Net migrants per 1,000 population
Portugal 2.79 · world median -0.133
Highest 39.62 (South Sudan)
▲ +49 percentile points since 2013
Poverty & Inequality3
Median Daily Income or Consumption per Person22nd of 60position · derived33.68Median income or consumption per person, 2021 PPP dollars a day2023
top 36% of 60 countries measured
World Bank Group · Median income or consumption per person, 2021 PPP dollars a day
Portugal 33.68 · world median 22.76 (better)
Best in the world 89.49 (Luxembourg)
No real change since 2013
Poverty Headcount at National Poverty Linesbottom 30%16.4Population below the national poverty line (%)2025
bottom 30% of 160 countries measured
World Bank Group · Population below the national poverty line (%)
Portugal 16.4 · world median 21.8
Highest 82.3 (South Sudan)
No earlier reading to compare
Societal Poverty Rate44th of 60position · derived · 1 = worst13.08Population below the societal poverty line, 2021 PPP (%)2023
top 27% of 60 countries measured
World Bank Group · Population below the societal poverty line, 2021 PPP (%)
Portugal 13.08 · world median 17.2 (better)
Best in the world 7 (Slovenia)
▲ +18 percentile points since 2013
Energy5
Net Electricity Imports (share of generation)top 11%22.14Net electricity imports (% of domestic generation)2024
top 11% of 193 countries measured
Ember · Net electricity imports (% of domestic generation)
Portugal 22.14 · world median 0
Highest 707.07 (Palestine)
▲ +18 percentile points since 2014
Nuclear Share of Electricity Generationbottom 41%0Nuclear (% of electricity generated)2024
bottom 41% of 183 countries measured
Ember · Nuclear (% of electricity generated)
Portugal 0 · world median 0
Highest 67.4 (France)
No real change since 2014
Primary Energy Consumption per Capitatop 36%72.73Energy use per person (million Btu)2024
top 36% of 192 countries measured
U.S. Energy Information Administration (EIA) · Energy use per person (million Btu)
Portugal 72.73 · world median 49.5
Highest 766.07 (Qatar)
▼ -3 percentile points since 2014
RISE Energy Efficiency Policy Scoretop 11%79.6Energy efficiency policy score (0–100)2023
top 11% of 140 countries measured
World Bank Group (ESMAP) · Energy efficiency policy score (0–100)
Portugal 79.6 · world median 48.23 (better)
Best in the world 95.93 (South Korea)
▼ -9 percentile points since 2013
RISE Renewable Energy Policy Scoretop 8%79.33Renewable energy policy score (0–100)2023
top 8% of 140 countries measured
World Bank Group (ESMAP) · Renewable energy policy score (0–100)
Portugal 79.33 · world median 33.26 (better)
Best in the world 89.52 (Denmark)
▼ -2 percentile points since 2013
Digital & Technology2
Mobile Phone Ownership44th of 140position · derived94.74Adults who own a mobile phone (% of population aged 15+)2024
top 31% of 140 countries measured
World Bank Group · Adults who own a mobile phone (% of population aged 15+)
Portugal 94.74 · world median 91.68 (better)
Best in the world 100 (Libya)
No earlier reading to compare
Smartphone Ownership39th of 140position · derived86.37Adults whose main mobile phone is a smartphone (% of population aged 15+)2024
top 27% of 140 countries measured
World Bank Group · Adults whose main mobile phone is a smartphone (% of population aged 15+)
Portugal 86.37 · world median 78.78 (better)
Best in the world 97.36 (Sweden)
No earlier reading to compare
People & Population10
Crude Birth Ratebottom 12%8.307Births per 1,000 population2023
bottom 12% of 222 countries measured
UN DESA Population Division · Births per 1,000 population
Portugal 8.307 · world median 13.79
Highest 46.36 (Central African Republic)
▲ +12 percentile points since 2013
Crude Death Ratetop 13%11.11Deaths per 1,000 population2023
top 13% of 222 countries measured
UN DESA Population Division · Deaths per 1,000 population
Portugal 11.11 · world median 7.303
Highest 25.58 (Vatican City)
▲ +9 percentile points since 2013
Median Age of the Populationtop 2%46.2Median age (years)2023
top 2% of 222 countries measured
UN DESA Population Division · Median age (years)
Portugal 46.2 · world median 31.52
Highest 59.63 (Vatican City)
No real change since 2013
Population Aged 65 and Overtop 2%24.11Share of the total population aged 65 and over (%)2023
top 2% of 222 countries measured
UN DESA Population Division · Share of the total population aged 65 and over (%)
Portugal 24.11 · world median 8.32
Highest 44.7 (Vatican City)
No real change since 2013
Population Densitytop 44%113.4People per square kilometre of land2023
top 44% of 222 countries measured
UN DESA Population Division · People per square kilometre of land
Portugal 113.4 · world median 96.92
Highest 26,145 (Monaco)
▼ -3 percentile points since 2013
Population Growth Ratebottom 21%-0.002Population growth (% per year)2023
bottom 21% of 222 countries measured
UN DESA Population Division · Population growth (% per year)
Portugal -0.002 · world median 0.888
Highest 5.862 (South Sudan)
▲ +13 percentile points since 2013
Population Under Age 15bottom 5%12.89Share of the total population aged 0–14 (%)2023
bottom 5% of 222 countries measured
UN DESA Population Division · Share of the total population aged 0–14 (%)
Portugal 12.89 · world median 22.71
Highest 49.17 (Central African Republic)
▼ -5 percentile points since 2013
Sex Ratio of the Total Populationbottom 10%90.97Males per 100 females2023
bottom 10% of 222 countries measured
UN DESA Population Division · Males per 100 females
Portugal 90.97 · world median 98.48
Highest 251.08 (Qatar)
No real change since 2013
Total Dependency Ratiotop 37%58.74People aged 0–14 and 65+ per 100 people aged 15–642023
top 37% of 222 countries measured
UN DESA Population Division · People aged 0–14 and 65+ per 100 people aged 15–64
Portugal 58.74 · world median 54.73
Highest 105.18 (Central African Republic)
▲ +15 percentile points since 2013
Total Fertility Ratebottom 29%1.508Live births per woman2023
bottom 29% of 222 countries measured
UN DESA Population Division · Live births per woman
Portugal 1.508 · world median 1.962
Highest 6.132 (Somalia)
▲ +25 percentile points since 2013
Not currently covered
The newest edition of these reports does not include Portugal. Usually the publisher does not cover it; sometimes it has dropped out of a ranking it used to appear in.
- Child Marriage
- Children with Functional Difficulties
- Cost of Sending Remittances
- Country Policy and Institutional Assessment
- Debt Service on External Debt
- Exclusive Breastfeeding Under Six Months
- External Debt Stocks (% of GNI)
- Female Genital Mutilation Prevalence
- Gender Social Norms Index
- Global Multidimensional Poverty Index
- Global Report on Food Crises
- Government Spending on Education · last seen 2022
- Inbound Mobility Rate, Tertiary · last seen 2023
- INFORM Severity Index
- Net Official Development Assistance Received
- Out-of-School Rate, Primary · last seen 2023
- Pre-Primary Net Enrolment Rate · last seen 2023
- School Life Expectancy · last seen 2023
- Secondary School Enrolment · last seen 2023
- Short-Term Share of External Debt
- Tertiary Enrolment Ratio · last seen 2023
- Violent Discipline of Children
- Working Poverty Rate
07Keep reading
Explore further


08Method
Sources and how to read them
How to read this page
- The scores and ranks belong to their publishers. Nothing is adjusted, rescaled or re-ranked; each is reproduced from the edition named beside it. Where a row says position · derived, the publisher ranks nobody on that measure and the position is ours, made by ordering the published score.
- Each statistic shows its newest edition, which is not always the edition the Country Index uses: the index pins every source to one data year so its average compares like with like.
How a standing is built from percentiles, why Portugal can move because other countries moved, and why publishers measure between 120 and 215 countries each are set out in full in how a standing is made and what a standing cannot tell you.
Sources
- Statistics: 35 publishers, each named beside its numbers, with every edition and licence on the datasets pages.
- Capital, languages, currency, codes: Wikidata, public domain (CC0).
- Map and land borders: Natural Earth, public domain. Borders are de facto — where administration actually changes — not claimed.
Photographs
The photograph of Portugal on this page comes from Wikimedia Commons and is shown in greyscale. The photographer and the licence are named beside each one.
Cite this page
Nations Inquiry (2026). Portugal: country statistics, rankings and trends. https://nationsinquiry.com/countries/portugal