Latest available · compiled 2026
Female-Headed Households, 2026 compilation
Each country’s newest reading as of 2026; every row carries its own year · stored as published, never rewritten
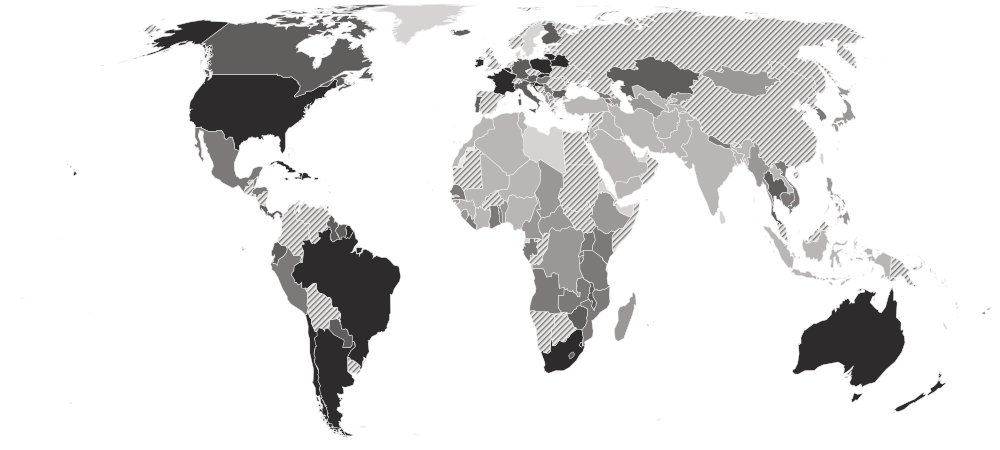
Female-Headed Households, 2026 compilation covers 182 countries. Bermuda is highest, at 55.47; Afghanistan is lowest, at 5.33. The middle country reads 33.18. 47 readings are more than ten years older than the file and are listed but not compared.
Female-Headed Households · Latest available · compiled 2026

HighestBermuda
55.47
LowestAfghanistan
5.33Shaded by value in five groups of equal size, darkest at the highest end. Neither end is better. The values describe a shape, not a score.
01Values only
The table
Every country and every column of Female-Headed Households, 2026 compilation, as published. The file carries values only, so no position is shown. “=” marks a shared position.
Showing 25 of 182 countries · select a heading to sort
 LatviaLVANorthern Europe · 2011 reading, too old to compare | 64.59 | 2011 | DYB | Latvia 2011 Census |
 EstoniaESTNorthern Europe · 2011 reading, too old to compare | 56.49 | 2011 | LFS | Estonia 2011 LFS |
| BermudaBMUNorthern America · 2016 reading | 55.47 | 2016 | DYB | Bermuda 2016 Census |
 Puerto RicoPRICaribbean · 2020 reading | 55.35 | 2020 | IPUMS | Puerto Rico 2020 Community Survey |
 New ZealandNZLAustralia and New Zealand · 2018 reading | 54.42 | 2018 | DYB | New Zealand 2018 Census |
 Dominican RepublicDOMCaribbean · 2022 reading | 53.65 | 2022 | DYB | Dominican Republic 2022 Census |
 JamaicaJAMCaribbean · 2022 reading | 52.65 | 2022 | MICS | Jamaica 2022 Multiple Indicator Cluster Survey |
 RussiaRUSEastern Europe · 2010 reading, too old to compare | 52.11 | 2010 | IPUMS | Russian Federation 2010 Census |
 NetherlandsNLDWestern Europe · 2011 reading, too old to compare | 51.88 | 2011 | LFS | Netherlands 2011 LFS |
 BelarusBLREastern Europe · 2019 reading | 51.44 | 2019 | MICS | Belarus 2019 Multiple Indicator Cluster Survey |
 BelgiumBELWestern Europe · 2021 reading | 50.98 | 2021 | DYB | Belgium 2021 Census |
 United StatesUSANorthern America · 2020 reading | 50.19 | 2020 | IPUMS | United States of America 2020 American Community Survey |
 LithuaniaLTUNorthern Europe · 2021 reading | 50.17 | 2021 | DYB | Lithuania 2021 Census |
 ChileCHLSouth America · 2024 reading | 49.87 | 2024 | DYB | Chile 2024 Census |
 CroatiaHRVSouthern Europe · 2021 reading | 49.61 | 2021 | DYB | Croatia 2021 Census |
 South AfricaZAFSouthern Africa · 2022 reading | 49.55 | 2022 | DYB | South Africa 2022 Census |
 Saint MartinMAFCaribbean · 2021 reading | 49.38 | 2021 | DYB | Saint-Martin (French part) 2021 Census |
 BrazilBRASouth America · 2022 reading | 49.13 | 2022 | DYB | Brazil 2022 Census |
 SeychellesSYCEastern Africa · 2002 reading, too old to compare | 49.12 | 2002 | DYB | Seychelles 2002 Census |
 ArgentinaARGSouth America · 2022 reading | 49.11 | 2022 | DYB | Argentina 2022 Census |
 PolandPOLEastern Europe · 2021 reading | 48.30 | 2021 | DYB | Poland 2021 Census |
 UkraineUKREastern Europe · 2012 reading, too old to compare | 47.93 | 2012 | MICS | Ukraine 2012 Multiple Indicator Cluster Survey |
 CubaCUBCaribbean · 2019 reading | 47.78 | 2019 | MICS | Cuba 2019 Multiple Indicator Cluster Survey |
 BotswanaBWASouthern Africa · 2011 reading, too old to compare | 47.48 | 2011 | DYB | Botswana 2011 Census |
 BarbadosBRBCaribbean · 2012 reading, too old to compare | 47.23 | 2012 | MICS | Barbados 2012 Multiple Indicator Cluster Survey |
 NauruNRUMicronesia · 2023 reading | 46.97 | 2023 | MICS | Nauru 2023 Multiple Indicator Cluster Survey |
 SlovakiaSVKEastern Europe · 2021 reading | 46.79 | 2021 | DYB | Slovakia 2021 Census |
 SloveniaSVNSouthern Europe · 2021 reading | 46.23 | 2021 | DYB | Slovenia 2021 Census |
 HaitiHTICaribbean · 2017 reading | 45.08 | 2017 | DHS | Haiti 2016-2017 Demographic and Health Survey |
 MaldivesMDVSouthern Asia · 2017 reading | 44.31 | 2017 | DHS | Maldives 2016-2017 Demographic and Health Survey |
 FranceFRAWestern Europe · 2020 reading | 44.20 | 2020 | DYB | France 2020 Census (2017-2022) |
 AustraliaAUSAustralia and New Zealand · 2016 reading | 44.07 | 2016 | DYB | Australia 2016 Census |
 EswatiniSWZSouthern Africa · 2021 reading | 44.04 | 2021 | MICS | Eswatini 2021-2022 Multiple Indicator Cluster Survey |
 NamibiaNAMSouthern Africa · 2013 reading, too old to compare | 43.96 | 2013 | DHS | Namibia 2013 Demographic and Health Survey |
 ComorosCOMEastern Africa · 2022 reading | 43.89 | 2022 | MICS | Comoros 2022 Multiple Indicator Cluster Survey |
 IrelandIRLNorthern Europe · 2022 reading | 43.70 | 2022 | DYB | Ireland 2022 Census |
 FinlandFINNorthern Europe · 2021 reading | 43.61 | 2021 | DYB | Finland 2021 Census |
 Turks and Caicos IslandsTCACaribbean · 2020 reading | 43.38 | 2020 | MICS | Turks and Caicos Islands 2019-2020 Multiple Indicator Cluster Survey |
 ThailandTHASouth-eastern Asia · 2022 reading | 43.20 | 2022 | MICS | Thailand 2022 Multiple Indicator Cluster Survey |
 CanadaCANNorthern America · 2021 reading | 42.98 | 2021 | DYB | Canada 2021 Census |
 Saint Kitts and NevisKNACaribbean · 2011 reading, too old to compare | 42.58 | 2011 | DYB | Saint Kitts and Nevis 2011 Census |
 KazakhstanKAZCentral Asia · 2024 reading | 42.06 | 2024 | MICS | Kazakhstan 2024 Multiple Indicator Cluster Survey |
 South SudanSSDEastern Africa · 2010 reading, too old to compare | 41.97 | 2010 | MICS | South Sudan 2010 Household Health Survey Second Round |
 BulgariaBGREastern Europe · 2021 reading | 41.81 | 2021 | DYB | Bulgaria 2021 Census |
 PortugalPRTSouthern Europe · 2021 reading | 41.73 | 2021 | DYB | Portugal 2021 Census |
 São Tomé and PríncipeSTPMiddle Africa · 2019 reading | 41.53 | 2019 | MICS | Sao Tome and Principe 2019 Multiple Indicator Cluster Survey |
 Saint LuciaLCACaribbean · 2012 reading, too old to compare | 41.42 | 2012 | MICS | Saint Lucia 2012 Multiple Indicator Cluster Survey |
 Hong KongHKGEastern Asia · 2021 reading | 41.36 | 2021 | DYB | China, Hong Kong (SAR) 2021 Census |
 AustriaAUTWestern Europe · 2021 reading | 41.10 | 2021 | DYB | Austria 2021 Census |
 GermanyDEUWestern Europe · 2022 reading | 40.89 | 2022 | DYB | Germany 2022 Census |
 MonacoMCOWestern Europe · 2016 reading | 40.58 | 2016 | DYB | Monaco 2016 Census |
 SurinameSURSouth America · 2018 reading | 40.56 | 2018 | MICS | Suriname 2018 Multiple Indicator Cluster Survey |
 UruguayURYSouth America · 2013 reading, too old to compare | 40.51 | 2013 | MICS | Uruguay 2013 Multiple Indicator Cluster Survey |
 United KingdomGBRNorthern Europe · 2011 reading, too old to compare | 40.27 | 2011 | DYB | United Kingdom 2011 Census |
 Costa RicaCRICentral America · 2018 reading | 39.63 | 2018 | MICS | Costa Rica 2018 Multiple Indicator Cluster Survey |
 Cayman IslandsCYMCaribbean · 2010 reading, too old to compare | 39.50 | 2010 | DYB | Cayman Islands 2010 Census |
 IcelandISLNorthern Europe · 2021 reading | 39.24 | 2021 | DYB | Iceland 2021 Census |
 LuxembourgLUXWestern Europe · 2021 reading | 39.08 | 2021 | DYB | Luxembourg 2021 Census |
 LesothoLSOSouthern Africa · 2023 reading | 39.01 | 2023 | DHS | Lesotho 2023-2024 DHS |
 GuyanaGUYSouth America · 2019 reading | 38.95 | 2019 | MICS | Guyana 2019-2020 Multiple Indicator Cluster Survey |
 BahamasBHSCaribbean · 2010 reading, too old to compare | 38.94 | 2010 | DYB | Bahamas 2010 Census |
 MaltaMLTSouthern Europe · 2021 reading | 38.89 | 2021 | DYB | Malta 2021 Census |
 Trinidad and TobagoTTOCaribbean · 2022 reading | 38.87 | 2022 | MICS | Trinidad and Tobago 2022 Multiple Indicator Cluster Survey |
 ParaguayPRYSouth America · 2016 reading | 38.71 | 2016 | MICS | Paraguay 2016 Multiple Indicator Cluster Survey |
 Sint MaartenSXMCaribbean · 2011 reading, too old to compare | 38.67 | 2011 | DYB | Sint Maarten (Dutch part) 2011 Census |
 NorwayNORNorthern Europe · 2011 reading, too old to compare | 38.52 | 2011 | DYB | Norway 2011 Census |
 EcuadorECUSouth America · 2022 reading | 38.46 | 2022 | DYB | Ecuador 2022 Census |
 MalawiMWIEastern Africa · 2024 reading | 38.35 | 2024 | DHS | Malawi 2024 Demographic and Health Survey |
 PanamaPANCentral America · 2023 reading | 38.19 | 2023 | DYB | Panama 2023 Census |
 ZimbabweZWEEastern Africa · 2019 reading | 37.74 | 2019 | MICS | Zimbabwe 2019 Multiple Indicator Cluster Survey |
 MauritaniaMRTWestern Africa · 2015 reading, too old to compare | 37.66 | 2015 | MICS | Mauritania 2015 Multiple Indicator Cluster Survey |
 ItalyITASouthern Europe · 2021 reading | 37.65 | 2021 | DYB | Italy 2021 Census |
 LiechtensteinLIEWestern Europe · 2021 reading | 37.49 | 2021 | DYB | Liechtenstein 2020 Census |
 SpainESPSouthern Europe · 2001 reading, too old to compare | 37.42 | 2001 | DYB | Spain 2001 Census |
 MoldovaMDAEastern Europe · 2014 reading, too old to compare | 37.29 | 2014 | DYB | Moldova 2014 Census |
 SerbiaSRBSouthern Europe · 2022 reading | 36.95 | 2022 | DYB | Serbia 2022 Census |
 SwitzerlandCHEWestern Europe · 2000 reading, too old to compare | 36.82 | 2000 | DYB | Switzerland 2000 Census |
 GhanaGHAWestern Africa · 2022 reading | 36.56 | 2022 | DHS | Ghana 2022 Demographic and Health Survey |
 French PolynesiaPYFPolynesia · 2022 reading | 36.55 | 2022 | DYB | French Polynesia 2022 Census |
 ColombiaCOLSouth America · 2015 reading, too old to compare | 36.42 | 2015 | DHS | Colombia 2015 Demographic and Health Survey |
 HungaryHUNEastern Europe · 2022 reading | 36.42 | 2022 | DYB | Hungary 2022 Census |
 NepalNPLSouthern Asia · 2025 reading | 35.49 | 2025 | MICS | Nepal 2024-2025 Multiple Indicator Cluster Survey |
 BoliviaBOLSouth America · 2012 reading, too old to compare | 35.46 | 2012 | DYB | Bolivia 2012 Census |
 RwandaRWAEastern Africa · 2023 reading | 35.46 | 2023 | DHS | Rwanda 2023 Malaria Indicators Survey |
 PeruPERSouth America · 2017 reading | 34.68 | 2017 | IPUMS | Peru 2017 Census |
 El SalvadorSLVCentral America · 2014 reading, too old to compare | 34.58 | 2014 | MICS | El Salvador 2014 MICS |
 AngolaAGOMiddle Africa · 2023 reading | 34.42 | 2023 | DHS | Angola 2023-2024 Demographic and Health Survey |
 IsraelISRWestern Asia · 2022 reading | 33.96 | 2022 | DYB | Israel 2022 Census |
 KenyaKENEastern Africa · 2022 reading | 33.89 | 2022 | DHS | Kenya 2022 Demographic and Health Survey |
 BelizeBLZCentral America · 2022 reading | 33.53 | 2022 | DYB | Belize 2022 Census |
 HondurasHNDCentral America · 2019 reading | 33.23 | 2019 | MICS | Honduras 2019 Multiple Indicator Cluster Survey |
 LiberiaLBRWestern Africa · 2022 reading | 33.19 | 2022 | DHS | Liberia 2022 Malaria Indicators Survey |
 ArmeniaARMWestern Asia · 2016 reading | 33.18 | 2016 | DHS | Armenia 2015-16 Demographic and Health Survey |
 South KoreaKOREastern Asia · 2020 reading | 32.71 | 2020 | DYB | Republic of Korea 2020 Census |
 GeorgiaGEOWestern Asia · 2018 reading | 31.99 | 2018 | MICS | Georgia 2018 Multiple Indicator Cluster Survey |
 MexicoMEXCentral America · 2020 reading | 31.90 | 2020 | IPUMS | Mexico 2020 Census |
 GabonGABMiddle Africa · 2020 reading | 31.89 | 2020 | DHS | Gabon 2019-2021 Demographic and Health Survey |
 MozambiqueMOZEastern Africa · 2022 reading | 31.77 | 2022 | DHS | Mozambique 2022-2023 Demographic and Health Survey |
 RomaniaROUEastern Europe · 2011 reading, too old to compare | 31.62 | 2011 | IPUMS | Romania 2011 Census |
 ZambiaZMBEastern Africa · 2024 reading | 31.33 | 2024 | DHS | Zambia 2024 Demographic and Health Survey |
 CambodiaKHMSouth-eastern Asia · 2021 reading | 31.07 | 2021 | DHS | Cambodia 2021-2022 Demographic and Health Survey |
 NicaraguaNICCentral America · 2005 reading, too old to compare | 30.33 | 2005 | IPUMS | Nicaragua 2005 Census |
 UgandaUGAEastern Africa · 2024 reading | 29.93 | 2024 | DHS | Uganda 2024-2025 Malaria Indicators Survey |
 VietnamVNMSouth-eastern Asia · 2020 reading | 29.72 | 2020 | MICS | Viet Nam 2020-2021 Multiple Indicator Cluster Survey |
 VenezuelaVENSouth America · 2001 reading, too old to compare | 29.42 | 2001 | IPUMS | Venezuela (Bolivarian Republic of) 2001 Census |
 SenegalSENWestern Africa · 2023 reading | 28.93 | 2023 | DHS | Senegal 2023 Demographic and Health Survey |
 TogoTGOWestern Africa · 2022 reading | 28.92 | 2022 | DYB | Togo 2022 Census |
 BurundiBDIEastern Africa · 2016 reading | 28.72 | 2016 | DHS | Burundi 2016 Demographic and Health Survey |
 TanzaniaTZAEastern Africa · 2022 reading | 28.64 | 2022 | DHS | United Republic of Tanzania 2022 Demographic and Health Survey |
 KyrgyzstanKGZCentral Asia · 2023 reading | 28.44 | 2023 | MICS | Kyrgyzstan 2023 Multiple Indicator Cluster Survey |
 BhutanBTNSouthern Asia · 2010 reading, too old to compare | 27.99 | 2010 | MICS | Bhutan 2010 Multiple Indicator Survey |
 DR CongoCODMiddle Africa · 2023 reading | 27.99 | 2023 | DHS | Democratic Republic of the Congo 2023-2024 Demographic and Health Survey |
 SingaporeSGPSouth-eastern Asia · 2020 reading | 27.57 | 2020 | DYB | Singapore 2020 Census |
 Sierra LeoneSLEWestern Africa · 2019 reading | 27.41 | 2019 | DHS | Sierra Leone 2019 Demographic and Health Survey |
 JapanJPNEastern Asia · 2020 reading | 27.26 | 2020 | DYB | Japan 2020 Census |
 BeninBENWestern Africa · 2021 reading | 27.03 | 2021 | MICS | Benin 2021 Multiple Indicator Cluster Survey |
 MongoliaMNGEastern Asia · 2020 reading | 26.59 | 2020 | IPUMS | Mongolia 2020 Census |
 CzechiaCZEEastern Europe · 2011 reading, too old to compare | 26.54 | 2011 | LFS | Czechia 2011 LFS |
 KiribatiKIRMicronesia · 2018 reading | 26.50 | 2018 | MICS | Kiribati 2018-2019 Multiple Indicator Cluster Survey |
 MauritiusMUSEastern Africa · 2022 reading | 25.98 | 2022 | DYB | Mauritius 2022 Census |
 CameroonCMRMiddle Africa · 2022 reading | 25.97 | 2022 | DHS | Cameroon 2022 Malaria Indicators Survey |
 PhilippinesPHLSouth-eastern Asia · 2022 reading | 25.83 | 2022 | DHS | Philippines 2022 Demographic and Health Survey |
 TongaTONPolynesia · 2021 reading | 25.74 | 2021 | DYB | Tonga 2021 Census |
 VanuatuVUTMelanesia · 2023 reading | 25.69 | 2023 | MICS | Vanuatu 2023 Multiple Indicator Cluster Survey |
 Central African RepublicCAFMiddle Africa · 2019 reading | 25.39 | 2019 | MICS | Central African Republic 2018-2019 Multiple Indicator Cluster Survey |
 GuatemalaGTMCentral America · 2015 reading, too old to compare | 25.05 | 2015 | DHS | Guatemala 2014-2015 Encuesta Nacional de Salud Materno Infantil |
 Republic of the CongoCOGMiddle Africa · 2015 reading, too old to compare | 24.84 | 2015 | MICS | Congo 2014-2015 Multiple Indicator Cluster Survey |
 North MacedoniaMKDSouthern Europe · 2019 reading | 24.75 | 2019 | MICS | North Macedonia 2018-2019 Multiple Indicator Cluster Survey |
 MadagascarMDGEastern Africa · 2021 reading | 24.74 | 2021 | DHS | Madagascar 2021 Demographic and Health Survey |
 GreeceGRCSouthern Europe · 2011 reading, too old to compare | 24.58 | 2011 | IPUMS | Greece 2011 Census |
 AlbaniaALBSouthern Europe · 2023 reading | 24.27 | 2023 | DYB | Albania 2023 Census |
 TurkmenistanTKMCentral Asia · 2024 reading | 24.27 | 2024 | MICS | Turkmenistan 2024 Multiple Indicator Cluster Survey |
 CyprusCYPWestern Asia · 2011 reading, too old to compare | 23.77 | 2011 | DYB | Cyprus 2011 Census |
 MontenegroMNESouthern Europe · 2018 reading | 23.65 | 2018 | MICS | Montenegro 2018 Multiple Indicator Cluster Survey |
 AzerbaijanAZEWestern Asia · 2023 reading | 23.00 | 2023 | MICS | Azerbaijan 2023 Multiple Indicator Cluster Survey |
 ChadTCDMiddle Africa · 2019 reading | 22.71 | 2019 | MICS | Chad 2019 Multiple Indicator Cluster Survey |
 Guinea-BissauGNBWestern Africa · 2019 reading | 22.67 | 2019 | MICS | Guinea-Bissau 2018-2019 Multiple Indicator Cluster Survey |
 MyanmarMMRSouth-eastern Asia · 2016 reading | 22.47 | 2016 | DHS | Myanmar 2015-2016 Demographic and Health Survey |
 EthiopiaETHEastern Africa · 2019 reading | 22.03 | 2019 | DHS | Ethiopia 2019 Demographic and Health Survey |
 SamoaWSMPolynesia · 2019 reading | 22.03 | 2019 | MICS | Samoa 2019-2020 Multiple Indicator Cluster Survey |
 GambiaGMBWestern Africa · 2020 reading | 22.00 | 2020 | DHS | Gambia 2019-2020 Demographic and Health Survey |
 FijiFJIMelanesia · 2021 reading | 20.85 | 2021 | MICS | Fiji 2021 Multiple Indicator Cluster Survey |
 TajikistanTJKCentral Asia · 2023 reading | 19.75 | 2023 | DHS | Tajikistan 2023 Demographic and Health Survey |
 UzbekistanUZBCentral Asia · 2021 reading | 19.71 | 2021 | MICS | Uzbekistan 2021-2022 Multiple Indicator Cluster Survey |
 Côte d’IvoireCIVWestern Africa · 2021 reading | 19.38 | 2021 | DHS | Enquête Démographique et de Santé de Côte d’Ivoire, 2021. |
 NigeriaNGAWestern Africa · 2024 reading | 19.35 | 2024 | DHS | Nigeria 2024 Demographic and Health Survey |
 MoroccoMARNorthern Africa · 2024 reading | 19.20 | 2024 | Recensement Général de la Population et de l’Habitat 2024 | Morocco 2024 Census |
 DjiboutiDJIEastern Africa · 2006 reading, too old to compare | 18.98 | 2006 | MICS | Djibouti 2006 Multiple Indicator Cluster Survey |
 Bosnia and HerzegovinaBIHSouthern Europe · 2012 reading, too old to compare | 18.89 | 2012 | MICS | Bosnia and Herzegovina 2011-2012 Multiple Indicator Cluster Survey |
 TunisiaTUNNorthern Africa · 2023 reading | 18.54 | 2023 | MICS | Tunisia 2023 Multiple Indicator Cluster Survey |
 TuvaluTUVPolynesia · 2020 reading | 18.04 | 2020 | MICS | Tuvalu 2019-2020 Multiple Indicator Cluster Survey |
 SomaliaSOMEastern Africa · 2006 reading, too old to compare | 18.00 | 2006 | MICS | Somalia 2006 Multiple Indicator Cluster Survey |
 Timor-LesteTLSSouth-eastern Asia · 2022 reading | 17.79 | 2022 | DYB | Timor-Leste 2022 Cenus |
 LaosLAOSouth-eastern Asia · 2023 reading | 17.69 | 2023 | MICS | Lao People's Democratic Republic 2023 Multiple Indicator Cluster Survey III |
 IndiaINDSouthern Asia · 2020 reading | 17.41 | 2020 | DHS | India 2019-2021 National Family Health Survey |
 GuineaGINWestern Africa · 2021 reading | 17.14 | 2021 | DHS | Guinea 2021 Malaria Indicators Survey |
 TürkiyeTURWestern Asia · 2018 reading | 16.00 | 2018 | DHS | Turkey 2018 Demographic and Health Survey |
 BangladeshBGDSouthern Asia · 2022 reading | 15.85 | 2022 | DHS | Bangladesh 2022 Demographic and Health Survey |
 IndonesiaIDNSouth-eastern Asia · 2017 reading | 14.81 | 2017 | DHS | Indonesia 2017 Demographic and Health Survey |
 ChinaCHNEastern Asia · 2000 reading, too old to compare | 14.80 | 2000 | IPUMS | China 2000 Census |
 BruneiBRNSouth-eastern Asia · 2011 reading, too old to compare | 14.56 | 2011 | DYB | Brunei Darussalam 2011 Census |
 JordanJORWestern Asia · 2023 reading | 14.47 | 2023 | DHS | Jordan 2023 Demographic and Health Survey |
 SudanSDNNorthern Africa · 2014 reading, too old to compare | 14.21 | 2014 | MICS | Sudan 2014 Multiple Indicator Cluster Survey |
 MalaysiaMYSSouth-eastern Asia · 2000 reading, too old to compare | 13.74 | 2000 | IPUMS | Malaysia 2000 Census |
 Papua New GuineaPNGMelanesia · 2011 reading, too old to compare | 13.50 | 2011 | Papua New Guinea 2011 Census | Papua New Guinea 2011 Census |
 EgyptEGYNorthern Africa · 2014 reading, too old to compare | 12.93 | 2014 | DHS | Egypt 2014 Demographic and Health Survey |
 NigerNERWestern Africa · 2021 reading | 12.79 | 2021 | DHS | Niger 2021 Malaria Indicator Survey |
 IranIRNSouthern Asia · 2016 reading | 12.69 | 2016 | DYB | Iran (Islamic Republic of) 2016 Census |
 Saudi ArabiaSAUWestern Asia · 2022 reading | 12.23 | 2022 | DYB | Saudi Arabia 2022 Census |
 PakistanPAKSouthern Asia · 2017 reading | 11.92 | 2017 | DYB | Pakistan 2017 Census |
 Burkina FasoBFAWestern Africa · 2014 reading, too old to compare | 11.80 | 2014 | DHS | Burkina Faso 2014 Malaria Indicators Survey |
 MaliMLIWestern Africa · 2024 reading | 11.67 | 2024 | DHS | Mali 2023-2024 Demographic and Health Survey |
 KosovoXKXSouthern Europe · 2020 reading | 11.24 | 2020 | MICS | Kosovo 2019-2020 Multiple Indicator Cluster Survey |
 OmanOMNWestern Asia · 2003 reading, too old to compare | 11.22 | 2003 | DYB | Oman 2003 Census |
 AlgeriaDZANorthern Africa · 2019 reading | 10.88 | 2019 | MICS | Algeria 2018-2019 Multiple Indicator Cluster Survey |
 PalestinePSEWestern Asia · 2020 reading | 10.48 | 2020 | MICS | State of Palestine 2019-2020 MICS |
 IraqIRQWestern Asia · 2018 reading | 8.94 | 2018 | MICS | Iraq 2018 Multiple Indicator Cluster Survey |
 SyriaSYRWestern Asia · 2006 reading, too old to compare | 8.32 | 2006 | MICS | Syrian Arab Republic 2006 Multiple Indicator Cluster Survey |
 YemenYEMWestern Asia · 2023 reading | 8.30 | 2023 | MICS | Yemen 2022-2023 Multiple Indicator Cluster Survey |
 North KoreaPRKEastern Asia · 2008 reading, too old to compare | 8.14 | 2008 | DYB | Democratic People's Republic of Korea 2008 Census |
 QatarQATWestern Asia · 2023 reading | 6.20 | 2023 | MICS | Qatar 2023 Multiple Indicator Cluster Survey |
| AfghanistanAFGSouthern Asia · 2023 reading | 5.33 | 2023 | MICS | Afghanistan 2022-2023 Multiple Indicator Cluster Survey |
02In Female-Headed Households, 2026 compilation
At either end
The 5 countries at each end of the headline. Readings too old to compare take no part.
Highest
- Bermuda55.47
- Puerto Rico55.35
- New Zealand54.42
- Dominican Republic53.65
- Jamaica52.65
Lowest
- Afghanistan5.33
- Qatar6.20
- Yemen8.30
- Iraq8.94
- Palestine10.48
Neither end is better. The values describe a shape, not a score. The middle country reads 33.18. “Shared” marks a value another country also holds.
03Caveats
Read before you use
What this edition’s numbers are and are not, worked out from the file itself.
Readings from many years
Each country’s newest reading as of 2026, from 2000 to 2025. 47 are more than ten years older than the file: listed and marked, but left out of the ends and the changes.
177 distinct values among 182
Values are stored exactly as published, to 2 decimals. 2 countries share 24.27. Countries sharing a value share a position too.
Which end is better
Neither end is better. The values describe a shape, not a score.
Nothing missing
Every one of the 182 countries has every column.
04The files
Download and cite
The table as a file, digit for digit, what this site changed, and a citation for this edition.
- .csv
For a spreadsheet or code
182 rows · 14 KB · UTF-8, opens in Excel
Opens with 11 lines of source notes; the table starts on row 13.
Download female-headed-households-2026-nations-inquiry.csv - ↗
The publisher’s original
UN DESA Population Division’s own file, on its own site.
UNDESA_PD_2026_hh-size-composition.xlsx
What this site changed: Reshaped into one row per country: regional and income-group totals are left out, only the columns listed are kept, each row gets its ISO 3166 code, and some country names are brought to one spelling. No value is recalculated, rescaled or rounded.
Licence: CC BY 3.0 IGO. The version of CC BY written for intergovernmental organisations. Credit the publisher and say what you changed.
Cite this edition
UN DESA Population Division (2026). Female-Headed Households, 2026 compilation [data set]. As held by Nations Inquiry, https://nationsinquiry.com/datasets/female-headed-households/2026
051 held
Other editions
‹ The edition before
This is the first edition held here.
The edition after ›
This is the newest edition. A newer one will get its own page at its own address; this one is never rewritten.
All of them
Female-Headed Households: every edition1 held, with the data dictionary, coverage and licence.
How it has moved, charted by country
06Questions
Female-Headed Households, 2026 compilation: questions and answers
Which country has the highest female-headed households in Female-Headed Households, 2026 compilation?
Bermuda, at 55.47, of the 182 countries in the file.
How many countries does Female-Headed Households, 2026 compilation cover?
182.
Where can I download Female-Headed Households, 2026 compilation?
On this page, as a CSV file holding every value exactly as published, or from the publisher’s own site, linked below.
Is Female-Headed Households, 2026 compilation the newest?
Yes, as of 2026-09-29, when it was read from the publisher.