UN DESA Population Division · Female-Headed Households
Female-headed households by country
What share of households in each country is headed by a woman?
Of the 135 countries compared in the 2026 edition, Bermuda had the highest reading, 55.47%, and Afghanistan had the lowest reading, 5.33%. In the middle country the figure was 33.18%. 47 readings from before 2016 are listed but not compared.
Share
Female-headed households · the 2026 edition
Context statistic

Highest of 135Bermuda
55.47%01the 2026 edition · values only
The highest and the lowest
The three countries with the highest values of 135 compared, the three with the lowest, and the highest on each continent. This statistic has no better end, so no country is shown as leading.
- 1
- 2

- 3

Lowest in the 2026 edition
 Afghanistan5.33%
 Qatar6.20%
 Yemen8.30%
This statistic has no better end: the two ends describe size, not success.
Highest on each continent
- Africa
 South Africa49.55%
- AmericasBermuda55.47%
- Asia
 Maldives44.31%
- Europe
 Belarus51.44%
- OceaniaNew Zealand54.42%
- Every region
02Every measured country
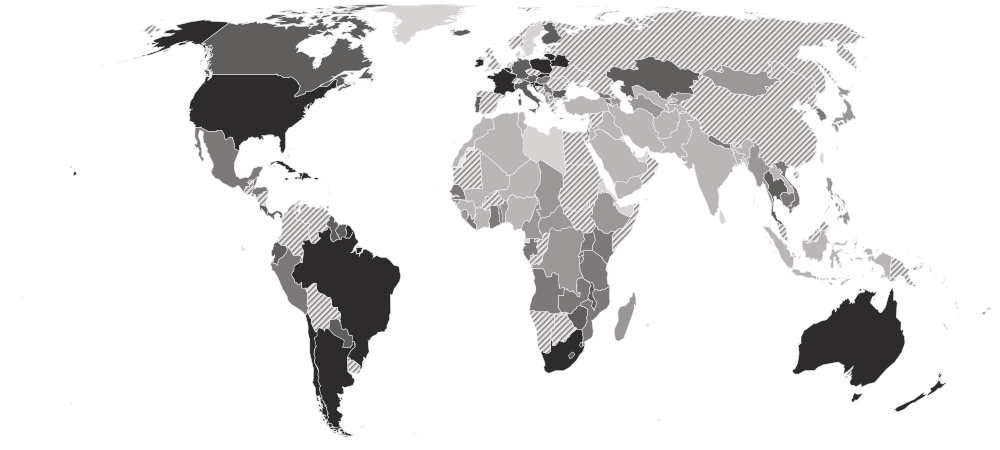
Female-headed households on a map
Each country is shaded by its value, in five groups holding the same number of countries. Hover a country for its value, or select it to open its profile. Below the map, each continent’s middle country.
Darker is a higher value. This statistic has no better end, so the shades describe size, not success.
- 5.33–19.75%
- 20.85–28.44%
- 28.64–36.95%
- 37.49–43.61%
- 43.70–55.47%
- Hatched: a reading from before 2016, listed but not compared (47)
- No reading in the 2026 edition
- Americas
43.18%
the middle country, of 24 measured · 48 members
Bermuda55.47% Mexico31.90%
Highest and lowest reading in Americas.
- Europe
41.00%
the middle country, of 26 measured · 49 members
Belarus51.44% Kosovo11.24%
Highest and lowest reading in Europe.
- Africa
28.64%
the middle country, of 39 measured · 55 members
South Africa49.55% Algeria10.88%
Highest and lowest reading in Africa.
- Oceania
26.12%
the middle country, of 10 measured · 21 members
New Zealand54.42% Tuvalu18.04%
Highest and lowest reading in Oceania.
- Asia
22.74%
the middle country, of 36 measured · 52 members
Maldives44.31%Afghanistan5.33%Highest and lowest reading in Asia.
- Every region
22 sub-regions, highest middle country first
- Caribbean
48.58%
the middle country, of 8 measured · 24 members
Puerto Rico55.35% Trinidad and Tobago38.87%
Highest and lowest reading in Caribbean.
- Eastern Europe
46.79%
the middle country, of 5 measured · 10 members
Belarus51.44% Hungary36.42%
Highest and lowest reading in Eastern Europe.
- Western Europe
40.89%
the middle country, of 7 measured · 9 members
 Belgium50.98%
 Liechtenstein37.49%
Highest and lowest reading in Western Europe.
- South America
39.76%
the middle country, of 8 measured · 12 members
 Chile49.87%
 Peru34.68%
Highest and lowest reading in South America.
- Southern Europe
37.30%
the middle country, of 10 measured · 17 members
 Croatia49.61%Kosovo11.24%
Highest and lowest reading in Southern Europe.
- Central America
33.53%
the middle country, of 5 measured · 8 members
 Costa Rica39.63%Mexico31.90%
Highest and lowest reading in Central America.
- Eastern Africa
31.33%
the middle country, of 13 measured · 19 members
 Comoros43.89%
 Ethiopia22.03%
Highest and lowest reading in Eastern Africa.
- Middle Africa
27.99%
the middle country, of 7 measured · 9 members
 São Tomé and Príncipe41.53%
 Chad22.71%
Highest and lowest reading in Middle Africa.
- South-eastern Asia
25.83%
the middle country, of 9 measured · 11 members
 Thailand43.20%
 Indonesia14.81%
Highest and lowest reading in South-eastern Asia.
- Central Asia
24.27%
the middle country, of 5 measured · 5 members
 Kazakhstan42.06%
 Uzbekistan19.71%
Highest and lowest reading in Central Asia.
- Western Africa
22.67%
the middle country, of 13 measured · 16 members
 Ghana36.56%
 Mali11.67%
Highest and lowest reading in Western Africa.
- Southern Asia
15.85%
the middle country, of 7 measured · 9 members
Maldives44.31%Afghanistan5.33%Highest and lowest reading in Southern Asia.
- Western Asia
14.47%
the middle country, of 11 measured · 19 members
 Israel33.96%Qatar6.20%
Highest and lowest reading in Western Asia.
- Australia and New Zealand
2 of 2 measured — too few for a middle: Australia, New Zealand.
New Zealand54.42% Australia44.07%
Highest and lowest reading in Australia and New Zealand.
- Eastern Asia
4 of 8 measured — too few for a middle: Hong Kong, Japan, Mongolia, South Korea.
 Hong Kong41.36%
 Mongolia26.59%
Highest and lowest reading in Eastern Asia.
- Melanesia
2 of 5 measured — too few for a middle: Fiji, Vanuatu.
 Vanuatu25.69%
 Fiji20.85%
Highest and lowest reading in Melanesia.
- Micronesia
2 of 7 measured — too few for a middle: Kiribati, Nauru.
 Nauru46.97%
 Kiribati26.50%
Highest and lowest reading in Micronesia.
- Northern Africa
3 of 6 measured — too few for a middle: Algeria, Morocco, Tunisia.
 Morocco19.20%Algeria10.88%
Highest and lowest reading in Northern Africa.
- Northern America
3 of 4 measured — too few for a middle: Bermuda, Canada, United States.
Bermuda55.47% Canada42.98%
Highest and lowest reading in Northern America.
- Northern Europe
4 of 13 measured — too few for a middle: Finland, Iceland, Ireland, Lithuania.
 Lithuania50.17%
 Iceland39.24%
Highest and lowest reading in Northern Europe.
- Polynesia
4 of 7 measured — too few for a middle: French Polynesia, Samoa, Tonga, Tuvalu.
 French Polynesia36.55%Tuvalu18.04%
Highest and lowest reading in Polynesia.
- Southern Africa
3 of 5 measured — too few for a middle: Eswatini, Lesotho, South Africa.
South Africa49.55% Lesotho39.01%
Highest and lowest reading in Southern Africa.
03The whole field at once
The spread
135 countries, one dot each, on one scale — further right is a higher value. Half the countries are above 33.18%; a quarter are above 41.63%, and a quarter below 22.86%. The bar in each row marks that continent’s middle country.
04All 182 ever measured
Every country
In order, highest value first. No rank or position is shown: too many countries share the same value for an order to mean anything. Neither end is better. A high share can mean women's independence, or widowhood, divorce and men working away from home; a low one can mean close-knit families or narrow roles. And 'head' is whoever the source recorded — the person a family names in a survey, the owner or renter of the home in some censuses — so it is a reported title, not a measure of who decides.
Showing 25 of 182 countries



















































































































Values for the 2026 edition.
05In this edition
Female-headed households in records
The extremes of the statistic. A record reached by more than one country names none of them.
Highest reading
55.47%
Households headed by a woman (% of households)
Lowest reading
5.33%
Households headed by a woman (% of households)
06The measure
About female-headed households
This is the share of households whose head is a woman, as recorded by each country's census or household survey. It describes how households are organised and who is named as responsible for them — from societies where almost every household is headed by a man to ones where women head most.
What the number is: Households headed by a woman (% of households).
07Where it fits
Connections
Its part in the Country Index, the statistics whose values line up most closely with it across countries, and others on the same subject.
In the Country Index
Context, with no vote
This statistic is published in full under Gender & Equality and People & Population, but does not help decide any Country Index standing.
Gender & EqualityPeople & PopulationWhich statistics vote, and why
Moves with
Where female-headed households is higher, these tend to be higher too.
- One-Person HouseholdsUN DESA Population Division · 135 countries in commonρ 0.73
- Women's Empowerment IndexUNDP Human Development Report Office and UN Women · 85 countries in commonρ 0.72
- Account Ownership Among WomenWorld Bank Group · 101 countries in commonρ 0.63
Moves against
Where female-headed households is higher, these tend to be lower.
- Average Household SizeUN DESA Population Division · 131 countries in commonρ −0.69
- Social Institutions and Gender IndexKeyOECD · 104 countries in commonρ −0.66
- PM2.5 Air Pollution ExposureAtmospheric Composition Analysis Group, Washington University in St. Louis · 134 countries in commonρ −0.55
Rank correlation (ρ, from −1 to 1) across countries, on each statistic’s newest edition, out of 337 statistics sharing at least 80 countries with this one. Two statistics that move together do not cause each other.
08Keep reading
Explore further
The subject
The data, edition by edition
The countries at either end
09Questions
Female-headed households: questions and answers
Which country has the highest female-headed households?
Bermuda, at 55.47%, among the 135 countries compared in the 2026 edition.
Which country has the lowest female-headed households?
Afghanistan, at 5.33%, among the 135 countries compared in the 2026 edition.
How many countries does the Female-Headed Households cover?
135 in the 2026 edition, and 182 at least once across all editions.
What is the world average female-headed households?
This site does not calculate a world average, which would depend on how countries are weighted. In the middle country of the 135 compared in the 2026 edition, the figure was 33.18%.
Is this UN DESA Population Division’s own ranking?
No ranking is shown. UN DESA Population Division publishes values only, and too many countries share the same value for an ordering to mean anything, so none is derived.
How often is the Female-Headed Households published?
This site holds one edition, describing 2026.
Where does the data come from, and can I download it?
From UN DESA Population Division, under CC BY 3.0 IGO. From the UN Population Division's Database on Household Size and Composition. Where a country has two sources in its newest year, the row is the one the Division's own country dashboard shows. Every edition is on this site’s Datasets pages as a full table, and downloads as a CSV file with every value unrounded.
10Method
Sources, method and citation
Source
Female-Headed Households — UN DESA Population Division
From the UN Population Division's Database on Household Size and Composition. Where a country has two sources in its newest year, the row is the one the Division's own country dashboard shows.
Newest edition
Report year 2026Data year not recorded
Cite the source as: United Nations (2026). Database on Household Size and Composition 2026. UN DESA/POP/2026/DC/NO.15.
Licence: CC BY 3.0 IGO, checked 2026-09-29.
How this page reads the numbers
- No rank or position is shown: UN DESA Population Division publishes values only, and too many countries share the same value for an ordering to mean anything.
- This statistic has no better end, so the page describes higher and lower values and never calls a country a leader.
- A country is named at an end only when it holds that value alone. Where several share it, the page says how many and names none first.
- The file gives each country’s most recent reading, so the rows are from different years. Readings from before 2016 are listed but left out of every comparison on this page.
- Values are stored exactly as published and trimmed only for display. “The middle country” is the median of the countries measured, not a world average.
The file itself, column by column — where it came from, what each column holds, and every edition as a CSV — is on its dataset page.
Cite this page
Nations Inquiry (2026). Female-headed households by country: Female-Headed Households, data from UN DESA Population Division. https://nationsinquiry.com/statistics/female-headed-households