World Intellectual Property Organization · Global Innovation Index
Global Innovation Index by country
How well does an economy turn its resources into innovation?
Switzerland placed first of the 139 countries compared in 2025, at 65.962, and Niger last, at 11.945. In the middle country the figure was 28.521. Among the 128 countries measured in every edition since 2022, the middle one moved from 29.139 to 29.723.
Part ofEconomy & Innovation
Global Innovation Index · 2025
Context statistic
Highest of 139Switzerland
65.962012025 · World Intellectual Property Organization’s rank
Who leads
The three countries at the highest end of 139 compared, the three at the other end, and the first on each continent.
 1
1Photo: Simon Koopmann derivative work: Jjtkk · CC BY-SA 2.0 de, greyscale
 2
2Photo: User:Pieter Kuiper · Public domain, greyscale
 3
3Photo: Stefano Brivio · CC BY 2.0, greyscale
Lowest in 2025
- 139
 Niger11.945
 - 138
 Angola13.026
 - 137
 Republic of the Congo13.615
Ranks out of 139. Where a country sits says how it compares with the others measured, and nothing about why.
Highest on each continent
- Africa
 Mauritius32.503
 - Americas
 United States61.689
 - Asia
 South Korea59.998
 - EuropeSwitzerland65.962
- Oceania
 Australia48.006
2 of 21 measured
- Every region
02Every measured country
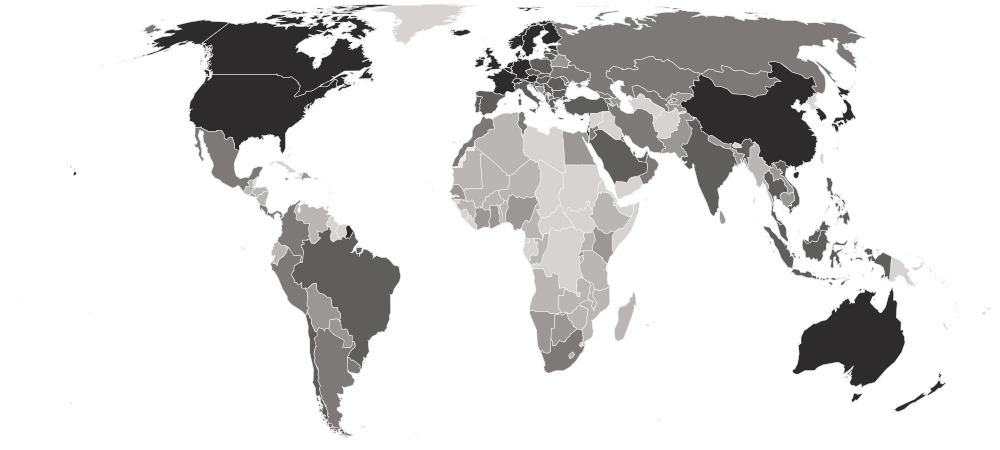
Global Innovation Index on a map
Each country is shaded by its value, in five groups holding the same number of countries. Hover a country for its value, or select it to open its profile. Below the map, each continent’s middle country.
Darker is a higher value — the better end.
- 11.945–19.579
- 19.636–25.125
- 25.231–31.215
- 31.305–44.945
- 45.347–65.962
- No reading in 2025 (2 measured in an earlier edition)
- Europe
42.036
the middle country, of 39 measured · 49 members
Switzerland65.962 Bosnia and Herzegovina23.430
Highest and lowest reading in Europe.
- Asia
30.016
the middle country, of 39 measured · 52 members
South Korea59.998 Myanmar17.305
Highest and lowest reading in Asia.
- Americas
25.231
the middle country, of 23 measured · 48 members
United States61.689 Venezuela13.731
Highest and lowest reading in Americas.
- Africa
18.128
the middle country, of 36 measured · 55 members
Mauritius32.503Niger11.945Highest and lowest reading in Africa.
- Oceania
2 of 21 measured — too few for a middle: Australia, New Zealand.
Australia48.006 New Zealand45.489
Highest and lowest reading in Oceania.
- Every region
19 sub-regions, highest middle country first
- Eastern Asia
53.557
the middle country, of 5 measured · 8 members
South Korea59.998 Mongolia26.695
Highest and lowest reading in Eastern Asia.
- Western Europe
53.416
the middle country, of 7 measured · 9 members
Switzerland65.962 Luxembourg47.265
Highest and lowest reading in Western Europe.
- Northern Europe
50.722
the middle country, of 10 measured · 13 members
 Sweden62.578
 Latvia37.527
Highest and lowest reading in Northern Europe.
- Southern Europe
37.513
the middle country, of 12 measured · 17 members
 Malta45.347Bosnia and Herzegovina23.430
Highest and lowest reading in Southern Europe.
- Eastern Europe
34.886
the middle country, of 10 measured · 10 members
 Czechia42.036
 Belarus25.099
Highest and lowest reading in Eastern Europe.
- South-eastern Asia
32.449
the middle country, of 10 measured · 11 members
 Singapore59.943Myanmar17.305
Highest and lowest reading in South-eastern Asia.
- Western Asia
30.831
the middle country, of 14 measured · 19 members
 Israel52.250
 Azerbaijan22.869
Highest and lowest reading in Western Asia.
- South America
26.622
the middle country, of 10 measured · 12 members
 Chile33.066Venezuela13.731
Highest and lowest reading in South America.
- Southern Asia
22.485
the middle country, of 6 measured · 9 members
 India38.200
 Nepal20.206
Highest and lowest reading in Southern Asia.
- Central America
22.241
the middle country, of 7 measured · 8 members
 Mexico30.513
 Nicaragua15.373
Highest and lowest reading in Central America.
- Western Africa
17.942
the middle country, of 12 measured · 16 members
 Senegal23.837Niger11.945
Highest and lowest reading in Western Africa.
- Eastern Africa
17.452
the middle country, of 13 measured · 19 members
Mauritius32.503 Ethiopia14.421
Highest and lowest reading in Eastern Africa.
- Australia and New Zealand
2 of 2 measured — too few for a middle: Australia, New Zealand.
Australia48.006New Zealand45.489Highest and lowest reading in Australia and New Zealand.
- Caribbean
4 of 24 measured — too few for a middle: Barbados, Dominican Republic, Jamaica, Trinidad and Tobago.
 Jamaica25.231
 Trinidad and Tobago19.251
Highest and lowest reading in Caribbean.
- Central Asia
4 of 5 measured — too few for a middle: Kazakhstan, Kyrgyzstan, Tajikistan, Uzbekistan.
 Uzbekistan26.498
 Tajikistan20.175
Highest and lowest reading in Central Asia.
- Middle Africa
3 of 9 measured — too few for a middle: Angola, Cameroon, Republic of the Congo.
 Cameroon18.184Angola13.026
Highest and lowest reading in Middle Africa.
- Northern Africa
4 of 6 measured — too few for a middle: Algeria, Egypt, Morocco, Tunisia.
 Morocco31.048
 Algeria18.901
Highest and lowest reading in Northern Africa.
- Northern America
2 of 4 measured — too few for a middle: Canada, United States.
United States61.689 Canada51.064
Highest and lowest reading in Northern America.
- Southern Africa
4 of 5 measured — too few for a middle: Botswana, Lesotho, Namibia, South Africa.
 South Africa30.138
 Lesotho14.934
Highest and lowest reading in Southern Africa.
03The whole field at once
The spread
139 countries, one dot each, on one scale — further right is a higher value. Half the countries are above 28.521; a quarter are above 40.049, and a quarter below 21.093. The bar in each row marks that continent’s middle country.
04All 141 ever measured
Every country
In order, highest value first. “=” marks a rank shared with another country. WIPO changes its indicator set, its sources and its imputation every year, and advises against reading rank movements straight off two editions — treat the trend as a direction, not a precise gain or loss of places. It ranks economies rather than countries, which is why Hong Kong appears in its own right.
Showing 25 of 141 countries








































Values for 2025. The change column compares 2025 with 2024 only; the sparkline covers the recent editions.
052022–2025 · 4 editions
Over time
Each point is one published edition, using the most recent data available for each of its roughly 80 underlying indicators.
- the middle country
- the middle half of countries
- the middle of the 128 countries measured every time
- each continent’s middle country
The same, year by year
| Year | Countries | Middle country | Middle half | Measured every time |
|---|---|---|---|---|
| 2025 | 139 | 28.521 | 21.093 – 40.049 | 29.723 |
| 2024 | 133 | 28.693 | 20.246 – 40.168 | 28.878 |
| 2023 | 132 | 29.289 | 21.322 – 42.026 | 29.938 |
| 2022 | 132 | 28.820 | 19.900 – 40.012 | 29.139 |
062024 → 2025
Who rose and fell
The biggest changes in value between the two newest editions. Places are shown second, because they also move when other countries do.
Improved most
before → afterDeclined most
before → after Germany58.083 → 55.455 · 9th → 11th−2.627
- Bosnia and Herzegovina25.468 → 23.430 · 80th → 92nd−2.038
- Czechia44.042 → 42.036 · 30th → 32nd−2.007
- Mongolia28.693 → 26.695 · 67th → 78th−1.998
 France55.413 → 53.416 · 12th → 13th−1.998
133 countries were measured in both 2024 and 2025. The field changed from 133 to 139 countries, so a place can move for reasons that have nothing to do with the country itself.
07Across every edition
Global Innovation Index in records
The extremes of the statistic. A record reached by more than one country names none of them.
Highest reading on record
67.589
GII score (0–100)
Lowest reading on record
10.216
GII score (0–100)
Biggest improvement between editions
+5.069
24.538 → 29.607
Biggest decline between editions
−4.253
49.084 → 44.831
Most improved since first measured
+5.166
24.441 → 29.607
At the top most often
4 of 4
editions, alone at the first-listed end
08The parts of the index
Inside the number
World Intellectual Property Organization publishes the parts the headline is built from. Each part’s highest and lowest country, and its middle value.
| Part | Highest | Lowest | Middle country |
|---|---|---|---|
| Institutions139 countries | Singapore98.690 | Venezuela1.878 | 48.968 |
| Human Capital and Research139 countries | South Korea66.991 | Ethiopia5.517 | 30.468 |
| Infrastructure139 countries | 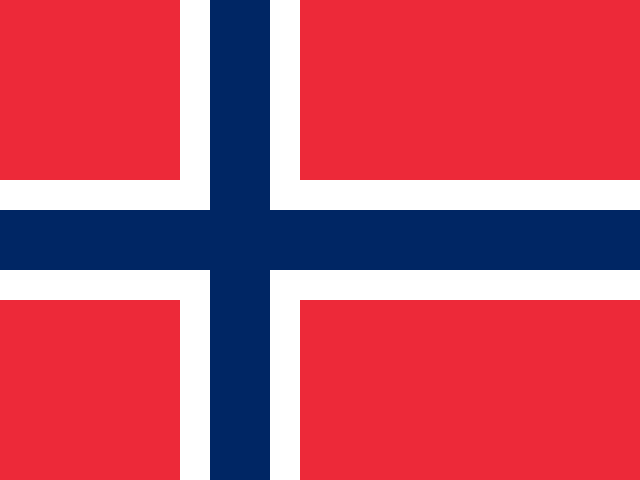 Norway68.827 Norway68.827 |  Burkina Faso11.056 Burkina Faso11.056 | 41.767 |
| Market Sophistication139 countries | United States75.035 | Republic of the Congo6.010 | 35.540 |
| Business Sophistication139 countries | United States65.903 | Myanmar15.365 | 27.961 |
| Knowledge and Technology Outputs139 countries | 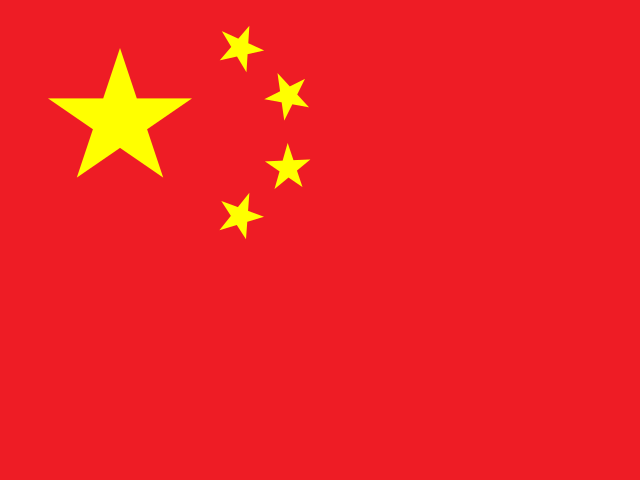 China60.705 China60.705 | Angola5.456 | 20.578 |
| Creative Outputs139 countries | Switzerland68.798 | Niger2.003 | 22.337 |
09The measure
About Global Innovation Index
WIPO’s Global Innovation Index scores how well an economy turns its inputs — research, institutions, infrastructure, skills — into innovation that reaches the world, out of 100. It is the standard reference for where new ideas are actually being made into products.
What the number is: GII score (0–100).
10Where it fits
Connections
Its part in the Country Index, the statistics whose values line up most closely with it across countries, and others on the same subject.
In the Country Index
Context, with no vote
This statistic is published in full under Economy & Innovation, but does not help decide any Country Index standing.
Moves with
Where Global Innovation Index is higher, these tend to be higher too.
- Climate Readiness (ND-GAIN)Notre Dame Global Adaptation Initiative (ND-GAIN), University of Notre Dame · 138 countries in commonρ 0.91
- ND-GAIN Country IndexNotre Dame Global Adaptation Initiative (ND-GAIN), University of Notre Dame · 138 countries in commonρ 0.91
- Government AI Readiness IndexKeyOxford Insights · 138 countries in commonρ 0.90
Moves against
Where Global Innovation Index is higher, these tend to be lower.
- Gender Inequality IndexUNDP Human Development Report Office · 136 countries in commonρ −0.88
- Under-Five Mortality RateKeyUN IGME · 138 countries in commonρ −0.85
- Infant Mortality RateUN IGME · 138 countries in commonρ −0.85
Rank correlation (ρ, from −1 to 1) across countries, on each statistic’s newest edition, out of 178 statistics sharing at least 80 countries with this one. Two statistics that move together do not cause each other.
11Keep reading
Explore further
The subject
The data, edition by edition
The countries at either end
12Questions
Global Innovation Index: questions and answers
Which country has the highest Global Innovation Index?
Switzerland, at 65.962, among the 139 countries compared in 2025.
Which country has the lowest Global Innovation Index?
Niger, at 11.945, among the 139 countries compared in 2025.
How many countries does the Global Innovation Index cover?
139 in 2025, and 141 at least once across all editions. The number measured varies from 132 to 139 between editions.
What is the world average Global Innovation Index?
This site does not calculate a world average, which would depend on how countries are weighted. In the middle country of the 139 compared in 2025, the figure was 28.521.
Is this World Intellectual Property Organization’s own ranking?
Yes. The rank shown is the one World Intellectual Property Organization publishes.
How often is the Global Innovation Index published?
This site holds 4 editions, describing 2022 to 2025.
Where does the data come from, and can I download it?
From World Intellectual Property Organization, under CC BY 4.0. Imported from WIPO’s own data annex, one download per edition. The series starts at 2022 because WIPO changed its publication numbering and the earlier annexes are not at a matching URL. Every edition is on this site’s Datasets pages as a full table, and downloads as a CSV file with every value unrounded.
13Method
Sources, method and citation
Source
Global Innovation Index — World Intellectual Property Organization
Imported from WIPO’s own data annex, one download per edition. The series starts at 2022 because WIPO changed its publication numbering and the earlier annexes are not at a matching URL.
Newest edition
Report year 2025Data year 2025
Cite the source as: WIPO. Global Innovation Index. Geneva: World Intellectual Property Organization.
Licence: CC BY 4.0, checked 2026-08-29.
How this page reads the numbers
- The rank is World Intellectual Property Organization’s own, as published.
- Which end is better follows the publisher’s own reading of the measure.
- A country is named at an end only when it holds that value alone. Where several share it, the page says how many and names none first.
- Values are stored exactly as published and trimmed only for display. “The middle country” is the median of the countries measured, not a world average.
The file itself, column by column — where it came from, what each column holds, and every edition as a CSV — is on its dataset page.
Photographs
The countries at the top of this statistic, from their profiles: Wikimedia Commons, shown in greyscale, each used under the licence named.
- Switzerland — Simon Koopmann derivative work: Jjtkk, CC BY-SA 2.0 de
- Sweden — User:Pieter Kuiper, Public domain
- United States — Stefano Brivio, CC BY 2.0
Cite this page
Nations Inquiry (2026). Global Innovation Index by country: Global Innovation Index, data from World Intellectual Property Organization. https://nationsinquiry.com/statistics/global-innovation-index