UIS · Research and Development Spending
Research and development spending by country
What share of the economy is spent on research and development?
Israel placed first of the 84 countries compared in 2023, at 6.34589%, and Guatemala last, at 0.00609%. In the middle country the figure was 0.81394%. Among the 35 countries measured in every edition since 1996, the middle one moved from 0.94421% to 1.58829%.
Research and development spending · 2023
Context statistic

Highest of 84Israel
6.34589%012023 · position · derived
Who leads
The three countries at the highest end of 84 compared, the three at the other end, and the first on each continent.
 1
1Photo: Yaniv Ben-Arie derivative work: ויקיג'אנקי · CC BY-SA 2.0, greyscale
 2
2Photo: Guido Radig,Inkey · CC BY 3.0, greyscale
 3
3Photo: Unknown author · CC BY-SA 2.0, greyscale
Lowest in 2023
- 84
 Guatemala0.00609%
 - 83
 Myanmar0.02307%
 - 82
 Kyrgyzstan0.05414%
Positions out of 84. Where a country sits says how it compares with the others measured, and nothing about why.
Highest on each continent
- Africa
 Egypt1.03356%
 - Americas
 United States3.44716%
 - AsiaIsrael6.34589%
- Europe
 Liechtenstein6.00984%
 - Oceania
 New Zealand1.54848%
1 of 21 measured
- Every region
02Every measured country
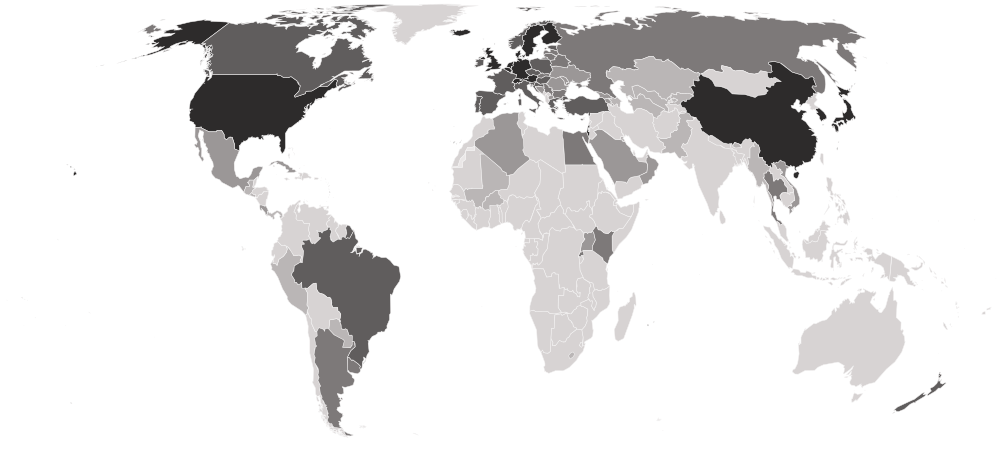
Research and development spending on a map
Each country is shaded by its value, in five groups holding the same number of countries. Hover a country for its value, or select it to open its profile. Below the map, each continent’s middle country.
Darker is a higher value — the better end.
- 0.00609–0.18160%
- 0.18210–0.51656%
- 0.57348–1.10625%
- 1.19380–2.17832%
- 2.26719–6.34589%
- No reading in 2023 (72 measured in an earlier edition)
- Europe
1.52478%
the middle country, of 38 measured · 49 members
Liechtenstein6.00984% Bosnia and Herzegovina0.18853%
Highest and lowest reading in Europe.
- Africa
0.37787%
the middle country, of 9 measured · 55 members
Egypt1.03356% Lesotho0.09453%
Highest and lowest reading in Africa.
- Americas
0.33738%
the middle country, of 13 measured · 48 members
United States3.44716%Guatemala0.00609%Highest and lowest reading in Americas.
- Asia
0.27103%
the middle country, of 23 measured · 52 members
Israel6.34589%Myanmar0.02307%Highest and lowest reading in Asia.
- Oceania
1 of 21 measured — too few for a middle: New Zealand.
New Zealand1.54848%Highest and lowest reading in Oceania.
- Every region
18 sub-regions, highest middle country first
- Western Europe
3.18784%
the middle country, of 8 measured · 9 members
Liechtenstein6.00984% Luxembourg1.07045%
Highest and lowest reading in Western Europe.
- Eastern Asia
2.57729%
the middle country, of 5 measured · 8 members
 South Korea4.94352%
 Macau0.27103%
Highest and lowest reading in Eastern Asia.
- Northern Europe
2.24574%
the middle country, of 10 measured · 13 members
 Sweden3.59978%
 Latvia0.82360%
Highest and lowest reading in Northern Europe.
- Southern Europe
1.38278%
the middle country, of 10 measured · 17 members
 Slovenia2.13385%Bosnia and Herzegovina0.18853%
Highest and lowest reading in Southern Europe.
- Eastern Europe
0.86371%
the middle country, of 10 measured · 10 members
 Czechia1.83369%
 Moldova0.22111%
Highest and lowest reading in Eastern Europe.
- South America
0.60111%
the middle country, of 5 measured · 12 members
 Brazil1.19380%
 Paraguay0.14117%
Highest and lowest reading in South America.
- Western Asia
0.37526%
the middle country, of 9 measured · 19 members
Israel6.34589% Kuwait0.09547%
Highest and lowest reading in Western Asia.
- Central America
0.15803%
the middle country, of 5 measured · 8 members
 Costa Rica0.33738%Guatemala0.00609%
Highest and lowest reading in Central America.
- Australia and New Zealand
1 of 2 measured — too few for a middle: New Zealand.
New Zealand1.54848%Highest and lowest reading in Australia and New Zealand.
- Caribbean
1 of 24 measured — too few for a middle: Cuba.
 Cuba0.39213%
Highest and lowest reading in Caribbean.
- Central Asia
4 of 5 measured — too few for a middle: Kazakhstan, Kyrgyzstan, Turkmenistan, Uzbekistan.
 Kazakhstan0.14449%Kyrgyzstan0.05414%
Highest and lowest reading in Central Asia.
- Eastern Africa
4 of 19 measured — too few for a middle: Kenya, Mauritius, Rwanda, Uganda.
 Kenya0.80427%
 Mauritius0.23892%
Highest and lowest reading in Eastern Africa.
- Northern Africa
2 of 6 measured — too few for a middle: Algeria, Egypt.
Egypt1.03356% Algeria0.37787%
Highest and lowest reading in Northern Africa.
- Northern America
2 of 4 measured — too few for a middle: Canada, United States.
United States3.44716% Canada1.81048%
Highest and lowest reading in Northern America.
- South-eastern Asia
3 of 11 measured — too few for a middle: Myanmar, Thailand, Vietnam.
 Thailand0.93628%Myanmar0.02307%
Highest and lowest reading in South-eastern Asia.
- Southern Africa
1 of 5 measured — too few for a middle: Lesotho.
Lesotho0.09453%Highest and lowest reading in Southern Africa.
- Southern Asia
2 of 9 measured — too few for a middle: Bhutan, Pakistan.
 Pakistan0.16399%
 Bhutan0.10787%
Highest and lowest reading in Southern Asia.
- Western Africa
2 of 16 measured — too few for a middle: Burkina Faso, Mali.
 Mali0.14743%
 Burkina Faso0.09845%
Highest and lowest reading in Western Africa.
03The whole field at once
The spread
84 countries, one dot each, on one scale — further right is a higher value. Half the countries are above 0.81394%; a quarter are above 1.81628%, and a quarter below 0.24786%. The bar in each row marks that continent’s middle country.
Log scale: each gridline is ten times the one before, so countries of very different sizes can be seen on one line.
04All 156 ever measured
Every country
In order, highest value first. “=” marks a position shared with another country. UNESCO Institute for Statistics (UIS) ranks nobody on this measure; the position is derived here by ordering the published values. It counts money spent, not discoveries made: a high figure says what a country invests, not what the investment produced.
Showing 25 of 156 countries























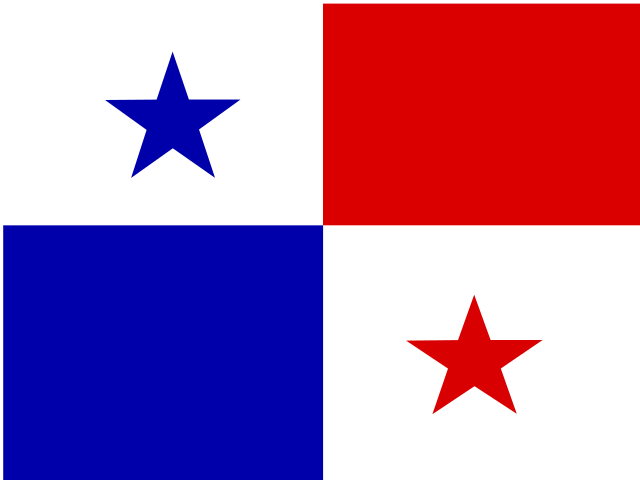

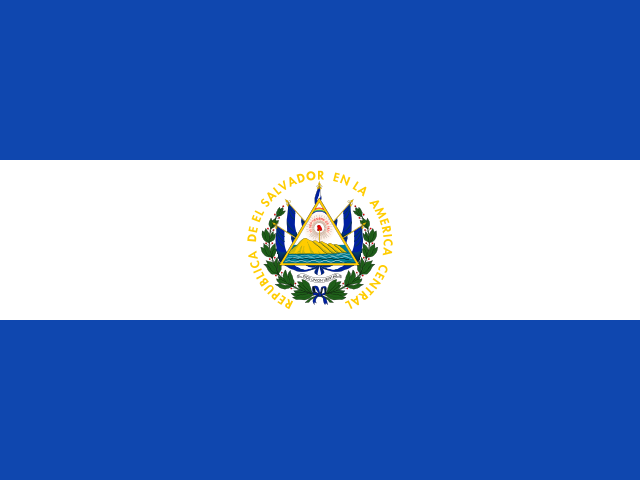
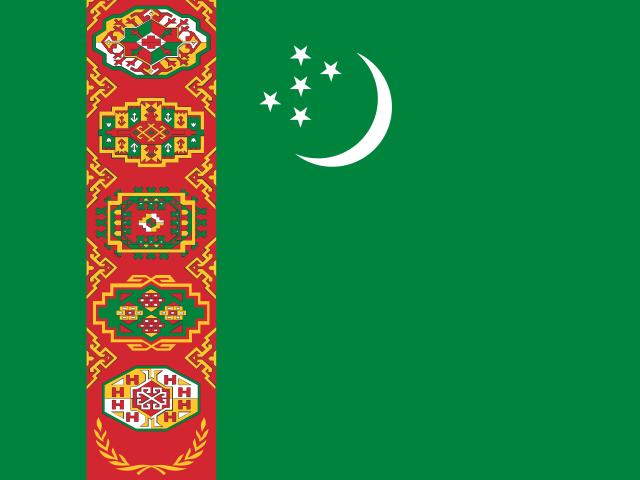



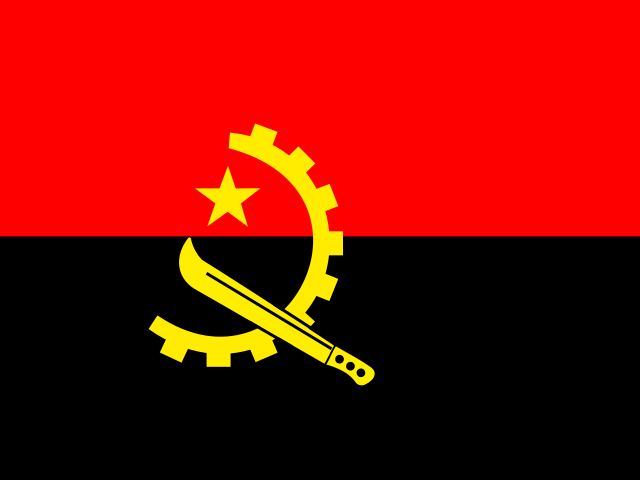
























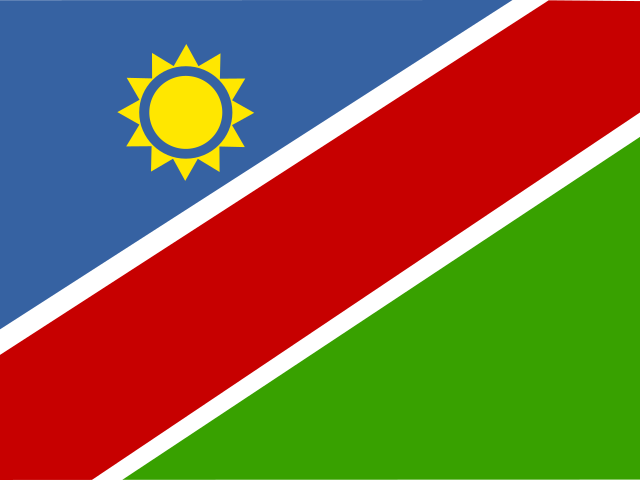











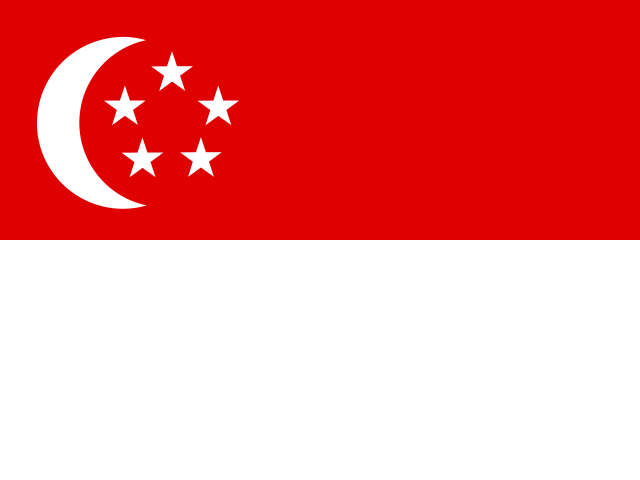
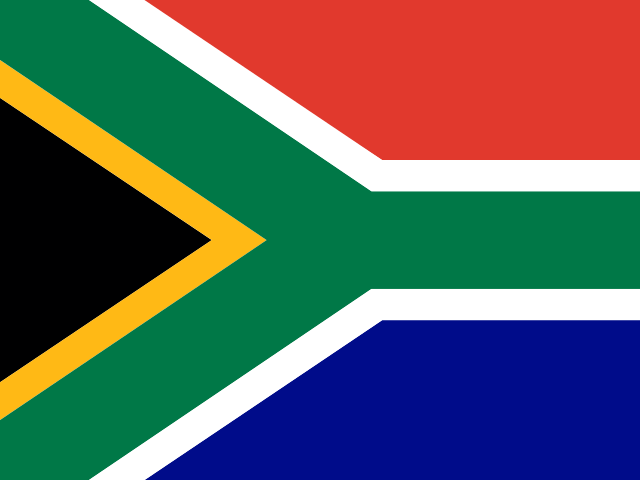
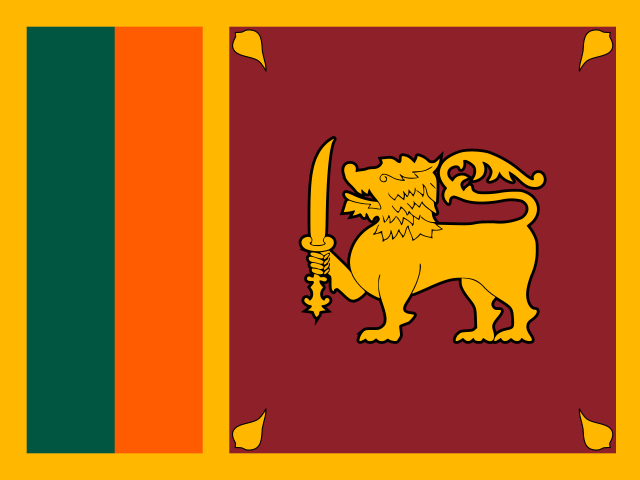





Values for 2023. The change column compares 2023 with 2022 only; the sparkline covers the recent editions.
051996–2023 · 28 editions
Over time
Each point is one year of UNESCO Institute for Statistics data. Many countries survey R&D only every few years, so lines often have gaps.
- the middle country
- the middle half of countries
- the middle of the 35 countries measured every time
- each continent’s middle country
The same, year by year
| Year | Countries | Middle country | Middle half | Measured every time |
|---|---|---|---|---|
| 2023 | 84 | 0.81394% | 0.24786% – 1.81628% | 1.58829% |
| 2022 | 84 | 0.72821% | 0.23342% – 1.58574% | 1.53215% |
| 2021 | 88 | 0.77386% | 0.25012% – 1.77810% | 1.63327% |
| 2020 | 87 | 0.75663% | 0.26370% – 1.59523% | 1.58067% |
| 2019 | 98 | 0.68145% | 0.24289% – 1.46460% | 1.45558% |
| 2018 | 93 | 0.61032% | 0.20113% – 1.35078% | 1.41934% |
| 2017 | 96 | 0.59886% | 0.22395% – 1.32865% | 1.32224% |
| 2016 | 91 | 0.64945% | 0.22993% – 1.27420% | 1.28150% |
| 2015 | 102 | 0.60445% | 0.22203% – 1.28334% | 1.33213% |
| 2014 | 91 | 0.63649% | 0.21659% – 1.33759% | 1.34370% |
| 2013 | 95 | 0.63536% | 0.27649% – 1.35387% | 1.38449% |
| 2012 | 86 | 0.67909% | 0.24187% – 1.50328% | 1.37661% |
| 2011 | 92 | 0.65580% | 0.20774% – 1.47476% | 1.45558% |
| 2010 | 93 | 0.60583% | 0.24438% – 1.35436% | 1.35436% |
| 2009 | 95 | 0.51718% | 0.21620% – 1.32421% | 1.35898% |
| 2008 | 97 | 0.52409% | 0.19354% – 1.32156% | 1.32156% |
| 2007 | 96 | 0.48578% | 0.19369% – 1.14832% | 1.23409% |
| 2006 | 85 | 0.57051% | 0.24281% – 1.22991% | 1.17567% |
| 2005 | 93 | 0.53008% | 0.21994% – 1.09866% | 1.09866% |
| 2004 | 94 | 0.49317% | 0.23976% – 1.11380% | 1.13619% |
| 2003 | 93 | 0.50804% | 0.24534% – 1.10465% | 1.10465% |
| 2002 | 94 | 0.38573% | 0.19901% – 1.00304% | 1.05575% |
| 2001 | 82 | 0.53193% | 0.24194% – 1.08557% | 1.03714% |
| 2000 | 73 | 0.58422% | 0.24471% – 1.36862% | 1.00104% |
| 1999 | 68 | 0.65737% | 0.29569% – 1.40826% | 0.97865% |
| 1998 | 66 | 0.55322% | 0.26005% – 1.28475% | 0.95383% |
| 1997 | 69 | 0.56374% | 0.27529% – 1.24861% | 0.98522% |
| 1996 | 52 | 0.65688% | 0.32952% – 1.59381% | 0.94421% |
062022 → 2023
Who rose and fell
The biggest changes in value between the two newest editions. Places are shown second, because they also move when other countries do.
Improved most
before → afterDeclined most
before → after- Thailand1.15902% → 0.93628% · 32nd → 39th−0.22274
- Macau0.42754% → 0.27103% · 51st → 61st−0.15651
 United Kingdom2.75224% → 2.67614% · 11th → 13th−0.07610
- Mauritius0.30879% → 0.23892% · 60th → 64th−0.06987
- Czechia1.89089% → 1.83369% · 17th → 21st−0.05720
72 countries were measured in both 2022 and 2023.
07Across every edition
Research and development spending in records
The extremes of the statistic. A record reached by more than one country names none of them.
Highest reading on record
6.34589%
Gross domestic expenditure on R&D (% of GDP)
Lowest reading on record
0.00544%
Gross domestic expenditure on R&D (% of GDP)
Biggest improvement between editions
+0.81062
0.07338% → 0.88400%
Biggest decline between editions
−0.51198
0.80171% → 0.28973%
Most improved since first measured
+3.87059
2.47530% → 6.34589%
At the top most often
23 of 28
editions, alone at the first-listed end
08The measure
About research and development spending
Research and development spending is everything spent on R&D in a country — by business, government, universities and non-profits — as a share of GDP. It is SDG indicator 9.5.1 and the standard measure of how much of an economy is aimed at producing new knowledge.
What the number is: Gross domestic expenditure on R&D (% of GDP).
09Where it fits
Connections
Its part in the Country Index, the statistics whose values line up most closely with it across countries, and others on the same subject.
In the Country Index
Context, with no vote
This statistic is published in full under Economy & Innovation and Education & Knowledge, but does not help decide any Country Index standing.
Economy & InnovationEducation & KnowledgeWhich statistics vote, and why
Moves with
Where research and development spending is higher, these tend to be higher too.
- Climate Readiness (ND-GAIN)Notre Dame Global Adaptation Initiative (ND-GAIN), University of Notre Dame · 82 countries in commonρ 0.83
- Government AI Readiness IndexKeyOxford Insights · 82 countries in commonρ 0.82
- Human Development IndexKeyUNDP Human Development Report Office · 83 countries in commonρ 0.82
Moves against
Where research and development spending is higher, these tend to be lower.
- Infant Mortality RateUN IGME · 81 countries in commonρ −0.76
- Under-Five Mortality RateKeyUN IGME · 81 countries in commonρ −0.75
- Political Corruption IndexV-Dem Institute, University of Gothenburg · 82 countries in commonρ −0.72
Rank correlation (ρ, from −1 to 1) across countries, on each statistic’s newest edition, out of 108 statistics sharing at least 80 countries with this one. Two statistics that move together do not cause each other.
10Keep reading
Explore further
The subject
The countries at either end
11Questions
Research and development spending: questions and answers
Which country has the highest research and development spending?
Israel, at 6.34589%, among the 84 countries compared in 2023.
Which country has the lowest research and development spending?
Guatemala, at 0.00609%, among the 84 countries compared in 2023.
How many countries does the Research and Development Spending cover?
84 in 2023, and 156 at least once across all editions. The number measured varies from 52 to 102 between editions.
What is the world average research and development spending?
This site does not calculate a world average, which would depend on how countries are weighted. In the middle country of the 84 compared in 2023, the figure was 0.81394%.
Is this UNESCO Institute for Statistics (UIS)’s own ranking?
No. UNESCO Institute for Statistics (UIS) publishes the values but ranks nobody; the position on this page is derived by Nations Inquiry by ordering the published values, and equal values share a position.
How often is the Research and Development Spending published?
This site holds 28 editions, describing 1996 to 2023.
Where does the data come from, and can I download it?
From UNESCO Institute for Statistics (UIS), under CC BY-SA 4.0. From the UNESCO Institute for Statistics data API (gross domestic expenditure on R&D). Years reporting fewer than 50 countries are left out. Every edition is on this site’s Datasets pages as a full table, and downloads as a CSV file with every value unrounded.
12Method
Sources, method and citation
Source
Research and Development Spending — UNESCO Institute for Statistics (UIS)
From the UNESCO Institute for Statistics data API (gross domestic expenditure on R&D). Years reporting fewer than 50 countries are left out.
Newest edition
Report year 2023Data year 2023
Cite the source as: UNESCO Institute for Statistics. UIS Data Browser. Montreal: UNESCO Institute for Statistics.
Licence: CC BY-SA 4.0, checked 2026-09-05.
How this page reads the numbers
- UNESCO Institute for Statistics (UIS) ranks nobody on this measure. The position is derived by Nations Inquiry by ordering the published values; equal values share a position.
- Which end is better follows the publisher’s own reading of the measure.
- A country is named at an end only when it holds that value alone. Where several share it, the page says how many and names none first.
- Values are stored exactly as published and trimmed only for display. “The middle country” is the median of the countries measured, not a world average.
The file itself, column by column — where it came from, what each column holds, and every edition as a CSV — is on its dataset page.
Photographs
The countries at the top of this statistic, from their profiles: Wikimedia Commons, shown in greyscale, each used under the licence named.
- Israel — Yaniv Ben-Arie derivative work: ויקיג'אנקי, CC BY-SA 2.0
- Liechtenstein — Guido Radig,Inkey, CC BY 3.0
- South Korea — Unknown author, CC BY-SA 2.0
Cite this page
Nations Inquiry (2026). Research and development spending by country: Research and Development Spending, data from UNESCO Institute for Statistics (UIS). https://nationsinquiry.com/statistics/rd-spending