World Bank Group and UNESCO Institute for Statistics · Learning Poverty
Learning poverty by country
What share of 10-year-olds cannot read and understand a simple story?
Of the 108 countries compared in the 2023 edition, Ireland had the lowest reading, 2.331%, and Zambia had the highest reading, 98.504%. In the middle country the figure was 32.717%. 17 readings from before 2013 are listed but not compared.
Part ofEducation & Knowledge
Learning poverty · the 2023 edition
Context statistic
Lowest of 108Ireland
2.331%01the 2023 edition · position · derived
Who leads
The three countries at the lowest end of 108 compared, the three at the other end, and the first on each continent.
 1
1Photo: derivative work: Jjtkk · CC BY-SA 2.0, greyscale
 2
2Photo: Unknown author · CC BY-SA 2.0, greyscale
 3
3Photo: (Jan Mehlich) · CC BY-SA 3.0, greyscale

02Every measured country
Learning poverty on a map
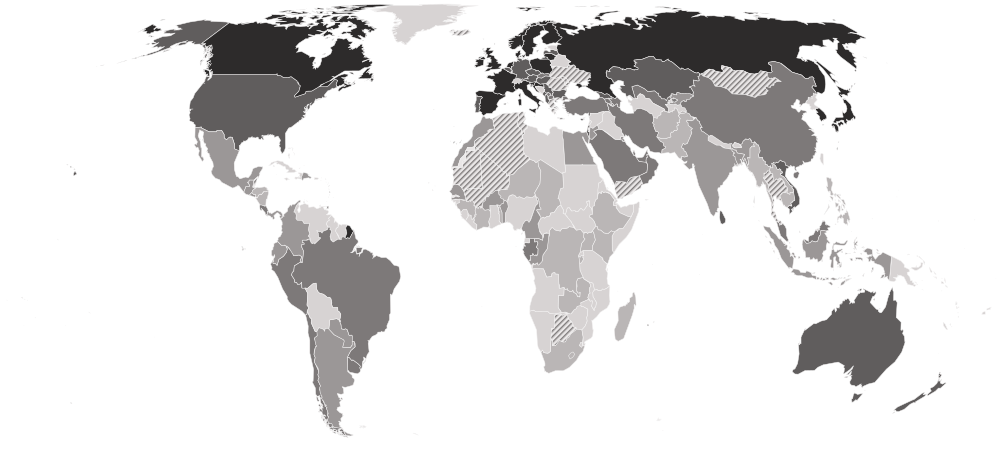
Each country is shaded by its value, in five groups holding the same number of countries. Hover a country for its value, or select it to open its profile. Below the map, each continent’s middle country.
Darker is a lower value — the better end.
- 78.903–98.504%
- 47.634–78.516%
- 18.200–46.898%
- 7.978–18.186%
- 2.331–7.300%
- Hatched: a reading from before 2013, listed but not compared (17)
- No reading in the 2023 edition
- Europe
7.639%
the middle country, of 30 measured · 49 members
Ireland2.331% Kosovo37.922%
Lowest and highest reading in Europe.
- Asia
32.365%
the middle country, of 35 measured · 52 members
 South Korea3.230%
 Laos97.717%
Lowest and highest reading in Asia.
- Americas
51.357%
the middle country, of 19 measured · 48 members
 Canada4.302%
 Honduras79.292%
Lowest and highest reading in Americas.
- Africa
81.791%
the middle country, of 22 measured · 55 members
 Gabon30.678%
 Zambia98.504%
Lowest and highest reading in Africa.
- Oceania
2 of 21 measured — too few for a middle: Australia, New Zealand.
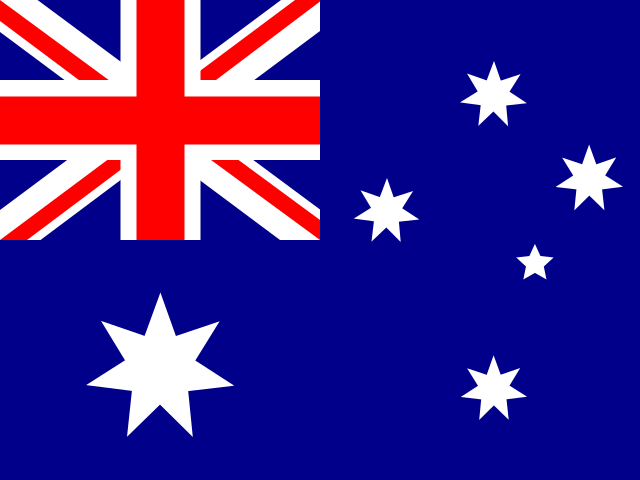 Australia9.064%
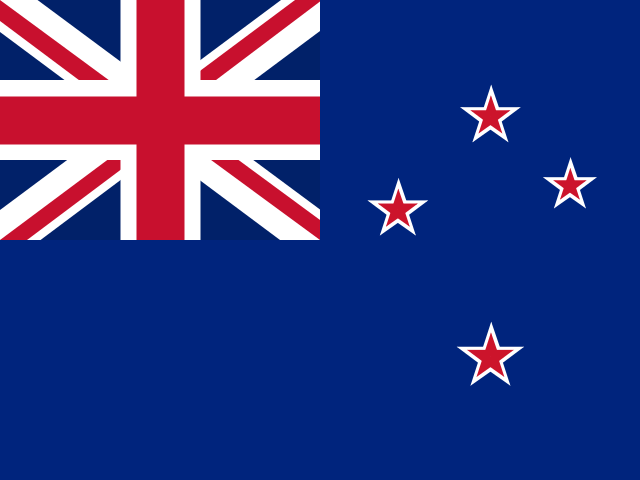 New Zealand10.861%
Lowest and highest reading in Oceania.
- Every region
19 sub-regions, lowest middle country first
- Northern Europe
4.538%
the middle country, of 8 measured · 13 members
Ireland2.331% Latvia8.438%
Lowest and highest reading in Northern Europe.
- Eastern Asia
5.390%
the middle country, of 5 measured · 8 members
South Korea3.230%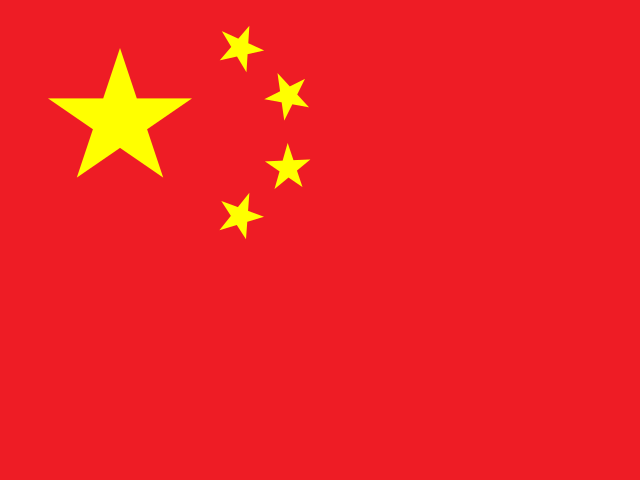 China18.200%
Lowest and highest reading in Eastern Asia.
- Western Europe
8.527%
the middle country, of 5 measured · 9 members
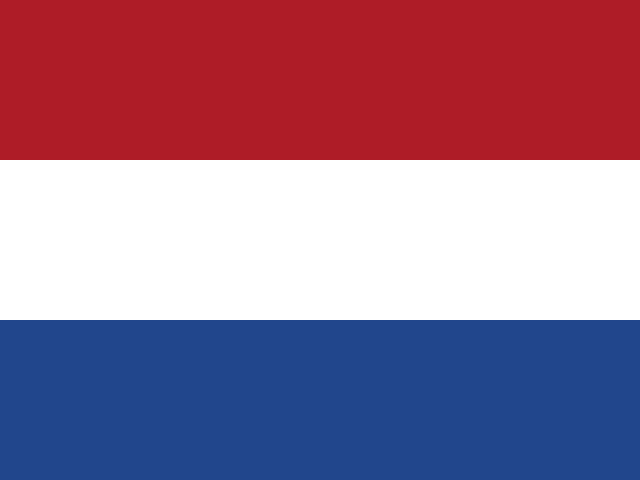 Netherlands4.491%
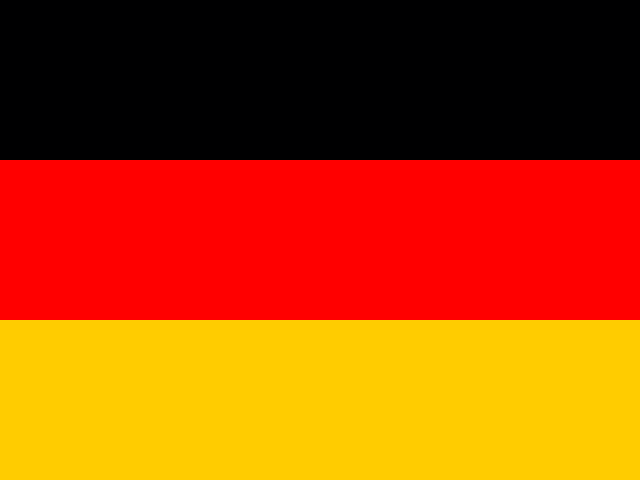 Germany15.440%
Lowest and highest reading in Western Europe.
- Southern Europe
8.847%
the middle country, of 11 measured · 17 members
 Croatia3.891%Kosovo37.922%
Lowest and highest reading in Southern Europe.
- Eastern Europe
11.681%
the middle country, of 6 measured · 10 members
 Russia3.764%
 Slovakia22.125%
Lowest and highest reading in Eastern Europe.
- Western Asia
27.241%
the middle country, of 13 measured · 19 members
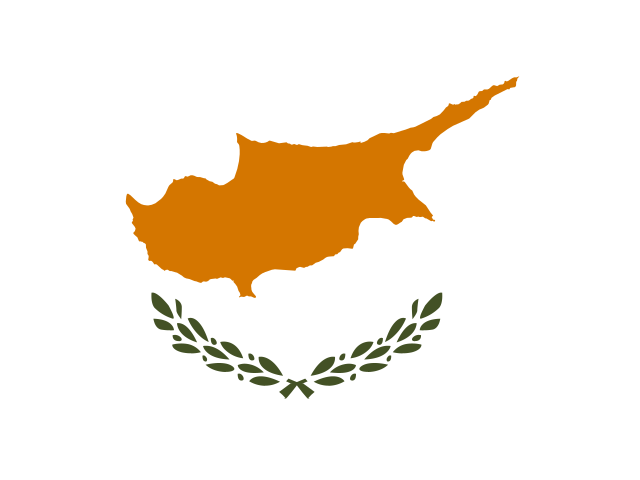 Cyprus10.250%
 Jordan62.246%
Lowest and highest reading in Western Asia.
- South America
49.127%
the middle country, of 8 measured · 12 members
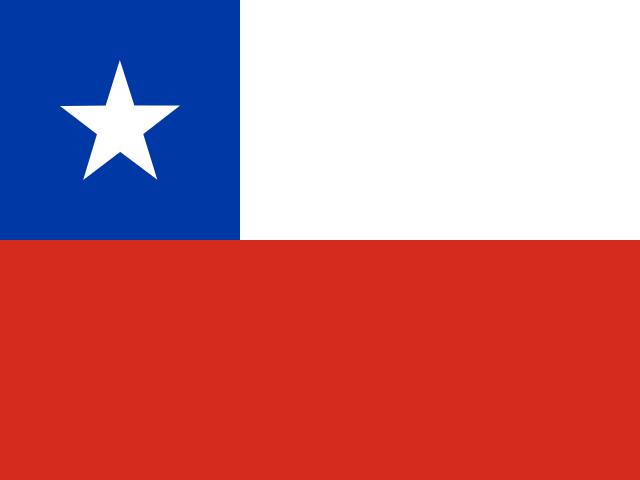 Chile27.190%
 Paraguay77.744%
Lowest and highest reading in South America.
- Southern Asia
53.645%
the middle country, of 6 measured · 9 members
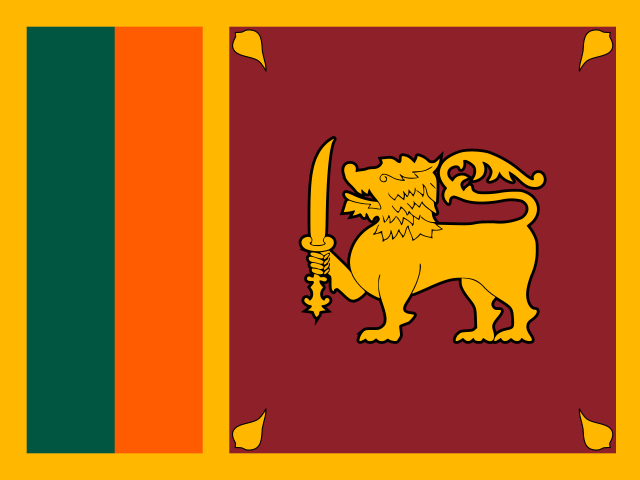 Sri Lanka14.806%
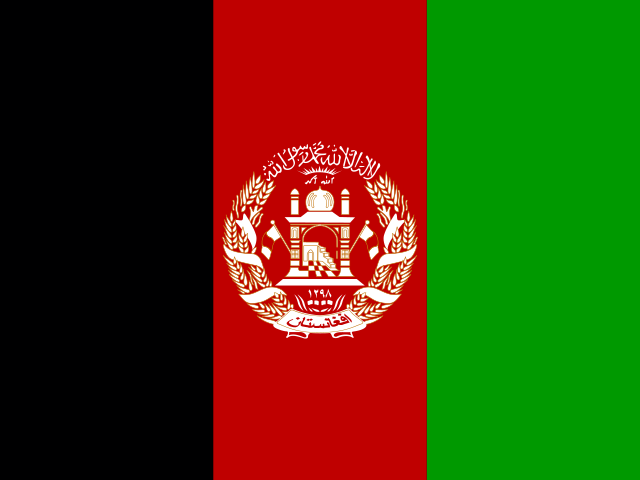 Afghanistan93.268%
Lowest and highest reading in Southern Asia.
- South-eastern Asia
71.145%
the middle country, of 8 measured · 11 members
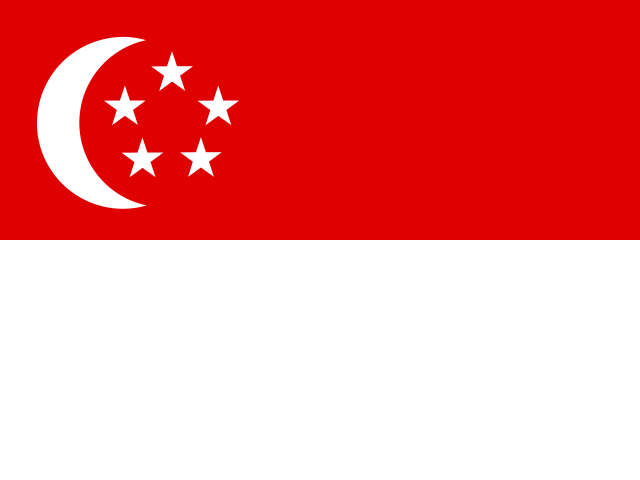 Singapore3.370%Laos97.717%
Lowest and highest reading in South-eastern Asia.
- Middle Africa
71.933%
the middle country, of 5 measured · 9 members
Gabon30.678%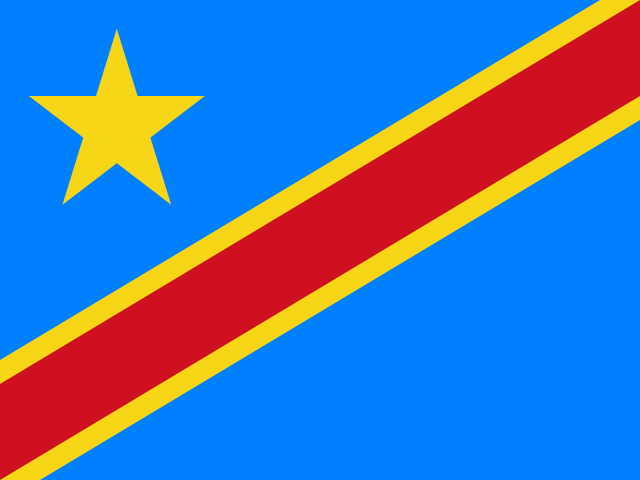 DR Congo96.602%
Lowest and highest reading in Middle Africa.
- Central America
78.513%
the middle country, of 7 measured · 8 members
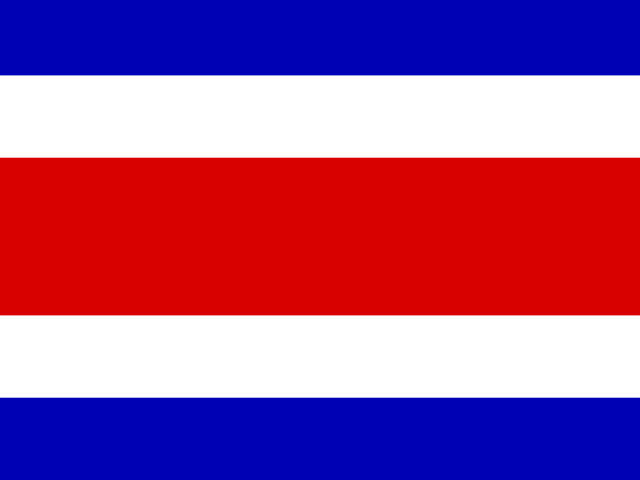 Costa Rica34.024%Honduras79.292%
Lowest and highest reading in Central America.
- Western Africa
79.885%
the middle country, of 7 measured · 16 members
 Benin55.776%
 Niger90.437%
Lowest and highest reading in Western Africa.
- Eastern Africa
92.816%
the middle country, of 6 measured · 19 members
 Kenya79.286%Zambia98.504%
Lowest and highest reading in Eastern Africa.
- Australia and New Zealand
2 of 2 measured — too few for a middle: Australia, New Zealand.
Australia9.064%New Zealand10.861%Lowest and highest reading in Australia and New Zealand.
- Caribbean
2 of 24 measured — too few for a middle: Dominican Republic, Trinidad and Tobago.
 Trinidad and Tobago20.645%
 Dominican Republic77.718%
Lowest and highest reading in Caribbean.
- Central Asia
3 of 5 measured — too few for a middle: Kazakhstan, Kyrgyzstan, Uzbekistan.
 Kazakhstan10.415%
 Kyrgyzstan64.491%
Lowest and highest reading in Central Asia.
- Northern Africa
2 of 6 measured — too few for a middle: Egypt, Morocco.
 Egypt56.119%
 Morocco59.760%
Lowest and highest reading in Northern Africa.
- Northern America
2 of 4 measured — too few for a middle: Canada, United States.
Canada4.302% United States9.692%
Lowest and highest reading in Northern America.
- Southern Africa
2 of 5 measured — too few for a middle: Lesotho, South Africa.
 South Africa82.017%
 Lesotho96.899%
Lowest and highest reading in Southern Africa.
03The whole field at once
The spread
108 countries, one dot each, on one scale — further right is a higher value. Half the countries are above 32.717%; a quarter are above 72.415%, and a quarter below 9.558%. The bar in each row marks that continent’s middle country.
04All 125 ever measured
Every country
In order, highest value first — position 1 is the highest value, the way World Bank Group and UNESCO Institute for Statistics’s own tables read. “=” marks a position shared with another country. World Bank Group and UNESCO Institute for Statistics ranks nobody on this measure; the position is derived here by ordering the published values. Readings run from 2001 to 2023, so two neighbouring rows can describe children a decade apart — check the reading year before comparing. Readings more than ten years older than the edition are listed but not compared. Rich countries sit near zero and much of sub-Saharan Africa above 90%, so the middle of the table is where the distinctions are finest.
Showing 25 of 125 countries































Values for the 2023 edition.
05In this edition
Learning poverty in records
The extremes of the statistic. A record reached by more than one country names none of them.
Highest reading
98.504%
10-year-olds who cannot read and understand a simple text (%)
Lowest reading
2.331%
10-year-olds who cannot read and understand a simple text (%)
06The parts of the index
Inside the number
World Bank Group and UNESCO Institute for Statistics publishes the parts the headline is built from. Each part’s highest and lowest country, and its middle value.
| Part | Highest | Lowest | Middle country |
|---|---|---|---|
| Primary-age children out of school (%)108 countries | DR Congo63.196 | 3 countries share 0.000 | 3.010 |
| Pupils below minimum reading proficiency (%)108 countries | Zambia98.242 | South Korea0.797 | 30.101 |
07The measure
About learning poverty
Learning poverty is the share of 10-year-olds who cannot read and understand a simple story — counting both children who are out of school and pupils who are in school but below the minimum reading level. The World Bank and the UNESCO Institute for Statistics built it as a single warning light for whether a school system is teaching the most basic skill of all.
What the number is: 10-year-olds who cannot read and understand a simple text (%).
What it does not measure
It tests reading only, not mathematics or any other subject, and it sets a minimum bar rather than measuring how well children read above it. Each country's figure comes from its most recent assessment, so two countries can be compared across very different years.
08Where it fits
Connections
Its part in the Country Index, the statistics whose values line up most closely with it across countries, and others on the same subject.
In the Country Index
Context, with no vote
This statistic is published in full under Education & Knowledge, but does not help decide any Country Index standing.
Moves with
Where learning poverty is higher, these tend to be higher too.
- Gender Inequality IndexUNDP Human Development Report Office · 105 countries in commonρ 0.89
- Infant Mortality RateUN IGME · 106 countries in commonρ 0.88
- Under-Five Mortality RateKeyUN IGME · 106 countries in commonρ 0.88
Moves against
Where learning poverty is higher, these tend to be lower.
- Human Capital IndexWorld Bank Group · 107 countries in commonρ −0.93
- Learning-Adjusted Years of SchoolWorld Bank Group · 107 countries in commonρ −0.92
- Climate Readiness (ND-GAIN)Notre Dame Global Adaptation Initiative (ND-GAIN), University of Notre Dame · 105 countries in commonρ −0.90
Rank correlation (ρ, from −1 to 1) across countries, on each statistic’s newest edition, out of 156 statistics sharing at least 80 countries with this one. Two statistics that move together do not cause each other.
09Keep reading
Explore further
The subject
The data, edition by edition
10Questions
Learning poverty: questions and answers
Which country has the lowest learning poverty?
Ireland, at 2.331%, among the 108 countries compared in the 2023 edition.
Which country has the highest learning poverty?
Zambia, at 98.504%, among the 108 countries compared in the 2023 edition.
How many countries does the Learning Poverty cover?
108 in the 2023 edition, and 125 at least once across all editions.
What is the world average learning poverty?
This site does not calculate a world average, which would depend on how countries are weighted. In the middle country of the 108 compared in the 2023 edition, the figure was 32.717%.
Is this World Bank Group and UNESCO Institute for Statistics’s own ranking?
No. World Bank Group and UNESCO Institute for Statistics publishes the values but ranks nobody; the position on this page is derived by Nations Inquiry by ordering the published values, and equal values share a position.
How often is the Learning Poverty published?
This site holds one edition, describing 2023.
Where does the data come from, and can I download it?
From World Bank Group and UNESCO Institute for Statistics, under CC BY 4.0. From World Bank Data360 (Learning Poverty Global Database), each country's most recent reading. The two parts of the headline — children out of school and pupils below minimum reading proficiency — are stored beside it, with female and male rates where published. Every edition is on this site’s Datasets pages as a full table, and downloads as a CSV file with every value unrounded.
11Method
Sources, method and citation
Source
Learning Poverty — World Bank Group and UNESCO Institute for Statistics
From World Bank Data360 (Learning Poverty Global Database), each country's most recent reading. The two parts of the headline — children out of school and pupils below minimum reading proficiency — are stored beside it, with female and male rates where published.
Newest edition
Report year 2023Data year not recorded
Cite the source as: World Bank and UNESCO Institute for Statistics. Learning Poverty Global Database. Washington, DC: World Bank Group.
Licence: CC BY 4.0, checked 2026-09-26.
How this page reads the numbers
- World Bank Group and UNESCO Institute for Statistics ranks nobody on this measure. The position is derived by Nations Inquiry by ordering the published values; equal values share a position.
- Which end is better follows the publisher’s own reading of the measure.
- A country is named at an end only when it holds that value alone. Where several share it, the page says how many and names none first.
- The file gives each country’s most recent reading, so the rows are from different years. Readings from before 2013 are listed but left out of every comparison on this page.
- Values are stored exactly as published and trimmed only for display. “The middle country” is the median of the countries measured, not a world average.
The file itself, column by column — where it came from, what each column holds, and every edition as a CSV — is on its dataset page.
Photographs
The countries at the top of this statistic, from their profiles: Wikimedia Commons, shown in greyscale, each used under the licence named.
- Ireland — derivative work: Jjtkk, CC BY-SA 2.0
- South Korea — Unknown author, CC BY-SA 2.0
- Lithuania — (Jan Mehlich), CC BY-SA 3.0
Cite this page
Nations Inquiry (2026). Learning poverty by country: Learning Poverty, data from World Bank Group and UNESCO Institute for Statistics. https://nationsinquiry.com/statistics/learning-poverty