GGDC · Total Factor Productivity Level
Total factor productivity by country
How much does an economy produce from its capital and workers, compared with the United States?
Of the 120 countries compared in 2023, Egypt had the highest reading, 1.1922, and Venezuela had the lowest reading, 0.0518. In the middle country the figure was 0.6265. Among the 81 countries measured in every edition since 1970, the middle one moved from 0.8445 to 0.6400.
Share
Part ofEconomy & Innovation
Total factor productivity · 2023
Context statistic

Highest of 120Egypt
1.1922012023 · values only
Who leads
The three countries at the highest end of 120 compared, the three at the other end, and the first on each continent.
 1
Photo: Rudolph.A.furtado · CC0, greyscale
 2
Photo: Moonik · CC BY-SA 3.0, greyscale
 3
Photo: Ximonic , Simo Räsänen · CC BY-SA 3.0, greyscale
Lowest in 2023
 Venezuela0.0518
 Central African Republic0.1985
 Tajikistan0.2096
Where a country sits says how it compares with the others measured, and nothing about why.
Highest on each continent
- AfricaEgypt1.1922
- Americas
 United States1.0000
- Asia
 Türkiye1.0925
- Europe
 Norway1.0766
- Oceania
 New Zealand0.8793
3 of 21 measured
- Every region
02Every measured country
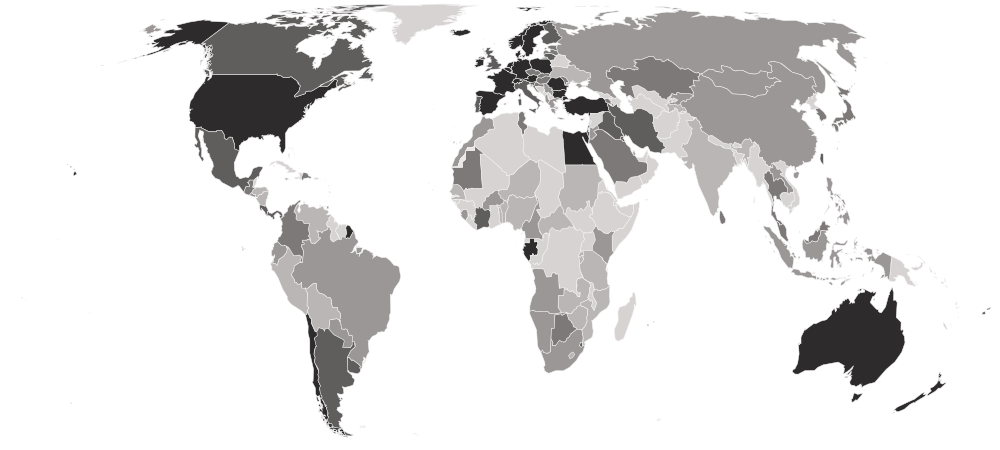
Total factor productivity on a map
Each country is shaded by its value, in five groups holding the same number of countries. Hover a country for its value, or select it to open its profile. Below the map, each continent’s middle country.
Darker is a higher value — the better end.
- 0.0518–0.4224
- 0.4322–0.5762
- 0.5778–0.6608
- 0.6635–0.8349
- 0.8431–1.1922
- No reading in 2023
- Europe
0.7829
the middle country, of 35 measured · 49 members
Norway1.0766 Ukraine0.3099
Highest and lowest reading in Europe.
- Asia
0.6371
the middle country, of 29 measured · 52 members
Türkiye1.0925Tajikistan0.2096Highest and lowest reading in Asia.
- Americas
0.5851
the middle country, of 23 measured · 48 members
United States1.0000Venezuela0.0518Highest and lowest reading in Americas.
- Africa
0.4487
the middle country, of 30 measured · 55 members
Egypt1.1922Central African Republic0.1985Highest and lowest reading in Africa.
- Oceania
3 of 21 measured — too few for a middle: Australia, Fiji, New Zealand.
New Zealand0.8793 Fiji0.7217
Highest and lowest reading in Oceania.
- Every region
20 sub-regions, highest middle country first
- Western Europe
0.9253
the middle country, of 7 measured · 9 members
 Germany1.0218
 France0.8872
Highest and lowest reading in Western Europe.
- Northern Europe
0.8549
the middle country, of 10 measured · 13 members
Norway1.0766 Latvia0.6270
Highest and lowest reading in Northern Europe.
- Southern Europe
0.6647
the middle country, of 9 measured · 17 members
 Spain0.8455
 Albania0.4782
Highest and lowest reading in Southern Europe.
- Eastern Asia
0.6608
the middle country, of 7 measured · 8 members
 Macau0.8303
 Mongolia0.4673
Highest and lowest reading in Eastern Asia.
- Western Asia
0.6462
the middle country, of 10 measured · 19 members
Türkiye1.0925 Jordan0.4576
Highest and lowest reading in Western Asia.
- Central America
0.6213
the middle country, of 7 measured · 8 members
 Costa Rica0.7634
 Nicaragua0.3883
Highest and lowest reading in Central America.
- Eastern Europe
0.6166
the middle country, of 9 measured · 10 members
 Poland0.9658Ukraine0.3099
Highest and lowest reading in Eastern Europe.
- Southern Africa
0.5495
the middle country, of 5 measured · 5 members
 Eswatini0.8349
 Lesotho0.2886
Highest and lowest reading in Southern Africa.
- South-eastern Asia
0.5221
the middle country, of 6 measured · 11 members
 Singapore0.8326
 Laos0.4333
Highest and lowest reading in South-eastern Asia.
- South America
0.5093
the middle country, of 10 measured · 12 members
 Chile0.8673Venezuela0.0518
Highest and lowest reading in South America.
- Western Africa
0.4049
the middle country, of 9 measured · 16 members
 Côte d’Ivoire0.6773
 Nigeria0.2682
Highest and lowest reading in Western Africa.
- Eastern Africa
0.3265
the middle country, of 8 measured · 19 members
 Mauritius0.9662
 Burundi0.2110
Highest and lowest reading in Eastern Africa.
- Australia and New Zealand
2 of 2 measured — too few for a middle: Australia, New Zealand.
New Zealand0.8793 Australia0.8470
Highest and lowest reading in Australia and New Zealand.
- Caribbean
4 of 24 measured — too few for a middle: Barbados, Dominican Republic, Jamaica, Trinidad and Tobago.
 Trinidad and Tobago0.6375
 Barbados0.3241
Highest and lowest reading in Caribbean.
- Central Asia
3 of 5 measured — too few for a middle: Kazakhstan, Kyrgyzstan, Tajikistan.
 Kazakhstan0.5911Tajikistan0.2096
Highest and lowest reading in Central Asia.
- Melanesia
1 of 5 measured — too few for a middle: Fiji.
Fiji0.7217Highest and lowest reading in Melanesia.
- Middle Africa
4 of 9 measured — too few for a middle: Angola, Cameroon, Central African Republic, Gabon.
 Gabon0.8431Central African Republic0.1985
Highest and lowest reading in Middle Africa.
- Northern Africa
4 of 6 measured — too few for a middle: Egypt, Morocco, Sudan, Tunisia.
Egypt1.1922 Sudan0.3519
Highest and lowest reading in Northern Africa.
- Northern America
2 of 4 measured — too few for a middle: Canada, United States.
United States1.0000 Canada0.8093
Highest and lowest reading in Northern America.
- Southern Asia
3 of 9 measured — too few for a middle: India, Iran, Sri Lanka.
 Iran0.8117
 India0.3972
Highest and lowest reading in Southern Asia.
03The whole field at once
The spread
120 countries, one dot each, on one scale — further right is a higher value. Half the countries are above 0.6265; a quarter are above 0.8099, and a quarter below 0.4661. The bar in each row marks that continent’s middle country.
04All 120 ever measured
Every country
In order, highest value first. No rank or position is shown: too many countries share the same value for an order to mean anything. Productivity here is a residual — whatever output the measured inputs do not explain — so it also picks up natural-resource income and errors in measuring capital or prices. That is why a few countries sit above the United States, and why this table is not a league of the best-run economies; no position is derived from it.
Showing 25 of 120 countries





































































Values for 2023. The change column compares 2023 with 2022 only; the sparkline covers the recent editions.
051970–2023 · 54 reference years
Over time
Each point is one year from 1970, all recalculated in the Penn World Table's 11.0 release. Because every year is measured against the United States in that same year, a rising line means catching up with the US, not growth on its own; the US itself is 1 throughout.
- the middle country
- the middle half of countries
- the middle of the 81 countries measured every time
- each continent’s middle country
The same, year by year
| Year | Countries | Middle country | Middle half | Measured every time |
|---|---|---|---|---|
| 2023 | 120 | 0.6265 | 0.4661 – 0.8099 | 0.6400 |
| 2022 | 120 | 0.6207 | 0.4624 – 0.8351 | 0.6852 |
| 2021 | 120 | 0.6172 | 0.4607 – 0.8199 | 0.6749 |
| 2020 | 120 | 0.6231 | 0.4630 – 0.8107 | 0.6726 |
| 2019 | 120 | 0.6401 | 0.4690 – 0.8315 | 0.6814 |
| 2018 | 120 | 0.6447 | 0.4619 – 0.8202 | 0.6895 |
| 2017 | 120 | 0.6552 | 0.4809 – 0.8408 | 0.6803 |
| 2016 | 120 | 0.6508 | 0.4825 – 0.8246 | 0.6880 |
| 2015 | 120 | 0.6436 | 0.4751 – 0.8125 | 0.6913 |
| 2014 | 120 | 0.6517 | 0.4967 – 0.8094 | 0.6770 |
| 2013 | 120 | 0.6378 | 0.4941 – 0.8220 | 0.6777 |
| 2012 | 120 | 0.6666 | 0.4960 – 0.8407 | 0.6899 |
| 2011 | 120 | 0.6668 | 0.4781 – 0.8307 | 0.6896 |
| 2010 | 120 | 0.6510 | 0.4554 – 0.8357 | 0.6950 |
| 2009 | 120 | 0.6619 | 0.4460 – 0.8461 | 0.6912 |
| 2008 | 120 | 0.6736 | 0.4800 – 0.8826 | 0.7162 |
| 2007 | 120 | 0.6862 | 0.4572 – 0.9010 | 0.7245 |
| 2006 | 120 | 0.6672 | 0.4477 – 0.8854 | 0.7270 |
| 2005 | 120 | 0.6549 | 0.4313 – 0.8977 | 0.7289 |
| 2004 | 120 | 0.6379 | 0.4118 – 0.8863 | 0.6951 |
| 2003 | 120 | 0.6434 | 0.4082 – 0.8820 | 0.6877 |
| 2002 | 120 | 0.6500 | 0.3942 – 0.8888 | 0.6969 |
| 2001 | 120 | 0.6517 | 0.3953 – 0.8886 | 0.7038 |
| 2000 | 120 | 0.6544 | 0.3977 – 0.9077 | 0.7121 |
| 1999 | 120 | 0.6684 | 0.3944 – 0.8579 | 0.7120 |
| 1998 | 120 | 0.6588 | 0.3999 – 0.8606 | 0.6992 |
| 1997 | 120 | 0.6920 | 0.4248 – 0.8665 | 0.7319 |
| 1996 | 120 | 0.6727 | 0.4293 – 0.8532 | 0.7421 |
| 1995 | 120 | 0.6659 | 0.4478 – 0.8719 | 0.7273 |
| 1994 | 120 | 0.6461 | 0.4609 – 0.8656 | 0.7388 |
| 1993 | 105 | 0.6933 | 0.5308 – 0.9142 | 0.7438 |
| 1992 | 105 | 0.6976 | 0.5329 – 0.9259 | 0.7596 |
| 1991 | 105 | 0.7212 | 0.5462 – 0.8924 | 0.7483 |
| 1990 | 105 | 0.7366 | 0.5556 – 0.9378 | 0.7781 |
| 1989 | 105 | 0.7728 | 0.5571 – 0.9102 | 0.7784 |
| 1988 | 105 | 0.7654 | 0.5469 – 0.9336 | 0.7784 |
| 1987 | 105 | 0.7877 | 0.5448 – 0.9716 | 0.7998 |
| 1986 | 105 | 0.7571 | 0.5561 – 0.9729 | 0.7931 |
| 1985 | 105 | 0.7825 | 0.5868 – 0.9397 | 0.8141 |
| 1984 | 105 | 0.8120 | 0.5980 – 0.9851 | 0.8264 |
| 1983 | 105 | 0.8153 | 0.6037 – 0.9982 | 0.8341 |
| 1982 | 105 | 0.8311 | 0.6317 – 1.0151 | 0.8457 |
| 1981 | 105 | 0.8310 | 0.6111 – 1.0235 | 0.8320 |
| 1980 | 105 | 0.8450 | 0.6335 – 1.0498 | 0.8517 |
| 1979 | 94 | 0.8775 | 0.6382 – 1.0139 | 0.8830 |
| 1978 | 94 | 0.8409 | 0.6714 – 0.9868 | 0.8546 |
| 1977 | 94 | 0.8366 | 0.6730 – 1.0262 | 0.8593 |
| 1976 | 93 | 0.8813 | 0.6566 – 1.0361 | 0.8813 |
| 1975 | 93 | 0.8814 | 0.6572 – 1.0411 | 0.8814 |
| 1974 | 92 | 0.8924 | 0.6314 – 1.0380 | 0.8962 |
| 1973 | 81 | 0.8451 | 0.6567 – 0.9814 | 0.8451 |
| 1972 | 81 | 0.8664 | 0.6452 – 0.9638 | 0.8664 |
| 1971 | 81 | 0.8521 | 0.5604 – 0.9809 | 0.8521 |
| 1970 | 81 | 0.8445 | 0.6249 – 0.9476 | 0.8445 |
062022 → 2023
Who rose and fell
The biggest changes in value between the two newest editions — reference years recalculated in one report, not two separate publications. Places are shown second, because they also move when other countries do.
Improved most
before → after- Macau0.3982 → 0.8303+0.4321
- Fiji0.6547 → 0.7217+0.0670
 Moldova0.5376 → 0.6035+0.0658
 Kyrgyzstan0.4146 → 0.4721+0.0576
- Barbados0.2860 → 0.3241+0.0380
120 countries were measured in both 2022 and 2023.
07Across every edition
Total factor productivity in records
The extremes of the statistic. A record reached by more than one country names none of them.
Highest reading on record
3.2975
TFP level at current PPPs (USA = 1)
Lowest reading on record
0.0518
TFP level at current PPPs (USA = 1)
Biggest improvement between editions
+0.6290
1.0803 → 1.7092
Biggest decline between editions
−0.9305
3.2975 → 2.3670
Most improved since first measured
+0.4612
0.6153 → 1.0766
At the top most often
20 of 54
editions, alone at the first-listed end
08The measure
About total factor productivity
Total factor productivity measures how much output an economy gets from its capital, its workers and their schooling, compared with the United States in the same year. A level of 0.5 means the country produces about half what the US would with the same inputs. It is the Penn World Table's best-known measure, and the standard way economists compare how efficiently countries use what they have.
What the number is: TFP level at current PPPs (USA = 1).
09Where it fits
Connections
Its part in the Country Index, the statistics whose values line up most closely with it across countries, and others on the same subject.
In the Country Index
Context, with no vote
This statistic is published in full under Economy & Innovation, but does not help decide any Country Index standing.
Moves with
Where total factor productivity is higher, these tend to be higher too.
- Labour Productivity per Hour WorkedILO · 118 countries in commonρ 0.84
- GDP per Person EmployedWorld Bank Group · 116 countries in commonρ 0.83
- Actual Individual Consumption per Capita (PPP)World Bank Group · 116 countries in commonρ 0.82
Moves against
Where total factor productivity is higher, these tend to be lower.
- Agriculture, Forestry and Fishing Value Added (% of GDP)World Bank Group · 106 countries in commonρ −0.69
- Children's Climate Risk IndexUNICEF · 111 countries in commonρ −0.69
- Vulnerable EmploymentKeyILO · 117 countries in commonρ −0.68
Rank correlation (ρ, from −1 to 1) across countries, on each statistic’s newest edition, out of 323 statistics sharing at least 80 countries with this one. Two statistics that move together do not cause each other.
10Keep reading
Explore further
The subject
The countries at either end
More from GGDC
11Questions
Total factor productivity: questions and answers
Which country has the highest total factor productivity?
Egypt, at 1.1922, among the 120 countries compared in 2023.
Which country has the lowest total factor productivity?
Venezuela, at 0.0518, among the 120 countries compared in 2023.
How many countries does the Total Factor Productivity Level cover?
120 in 2023. The number measured varies from 81 to 120 between editions.
What is the world average total factor productivity?
This site does not calculate a world average, which would depend on how countries are weighted. In the middle country of the 120 compared in 2023, the figure was 0.6265.
Is this Groningen Growth and Development Centre (GGDC)’s own ranking?
No ranking is shown. Groningen Growth and Development Centre (GGDC) publishes values only, and too many countries share the same value for an ordering to mean anything, so none is derived.
How often is the Total Factor Productivity Level published?
This site holds 54 reference years, 1970–2023, all recalculated in Groningen Growth and Development Centre (GGDC)’s 2025 report on one method — not 54 separate publications.
Where does the data come from, and can I download it?
From Groningen Growth and Development Centre (GGDC), under CC BY 4.0. From Penn World Table 11.0 (column ctfp), published by the Groningen Growth and Development Centre. It covers the countries for which the table can estimate capital stocks and employment. Every edition is on this site’s Datasets pages as a full table, and downloads as a CSV file with every value unrounded.
12Method
Sources, method and citation
Source
Total Factor Productivity Level — Groningen Growth and Development Centre (GGDC)
From Penn World Table 11.0 (column ctfp), published by the Groningen Growth and Development Centre. It covers the countries for which the table can estimate capital stocks and employment.
Newest edition
Report year 2023Data year 2023
Cite the source as: Feenstra, Robert C., Robert Inklaar and Marcel P. Timmer (2015), "The Next Generation of the Penn World Table", American Economic Review, 105(10), 3150–3182. Penn World Table version 11.0, www.ggdc.net/pwt.
Licence: CC BY 4.0, checked 2026-09-29.
How this page reads the numbers
- No rank or position is shown: Groningen Growth and Development Centre (GGDC) publishes values only, and too many countries share the same value for an ordering to mean anything.
- Which end is better follows the publisher’s own reading of the measure.
- A country is named at an end only when it holds that value alone. Where several share it, the page says how many and names none first.
- Values are stored exactly as published and trimmed only for display. “The middle country” is the median of the countries measured, not a world average.
The file itself, column by column — where it came from, what each column holds, and every edition as a CSV — is on its dataset page.
Photographs
The countries at the top of this statistic, from their profiles: Wikimedia Commons, shown in greyscale, each used under the licence named.
- Egypt — Rudolph.A.furtado, CC0
- Türkiye — Moonik, CC BY-SA 3.0
- Norway — Ximonic , Simo Räsänen, CC BY-SA 3.0
Cite this page
Nations Inquiry (2026). Total factor productivity by country: Total Factor Productivity Level, data from Groningen Growth and Development Centre (GGDC). https://nationsinquiry.com/statistics/total-factor-productivity