GGDC · Price Level of Household Consumption
Price level (cost of living) by country
How expensive is each country compared with the United States?
Of the 185 countries compared in 2023, Venezuela had the highest reading, 65.54493, and Egypt had the lowest reading, 0.17743. In the middle country the figure was 0.52343. Among the 111 countries measured in every edition since 1960, the middle one moved from 0.08461 to 0.49421.
Share
Part ofEconomy & Innovation
Price level (cost of living) · 2023
Context statistic

Highest of 185Venezuela
65.54493012023 · values only
The highest and the lowest
The three countries with the highest values of 185 compared, the three with the lowest, and the highest on each continent. This statistic has no better end, so no country is shown as leading.
- 1
- 2

- 3

Highest on each continent
- Africa
 South Sudan0.89513
- AmericasVenezuela65.54493
- Asia
 Israel1.16477
- Europe
 Switzerland1.40999
- Oceania
 Australia1.07365
3 of 21 measured
- Every region
02Every measured country
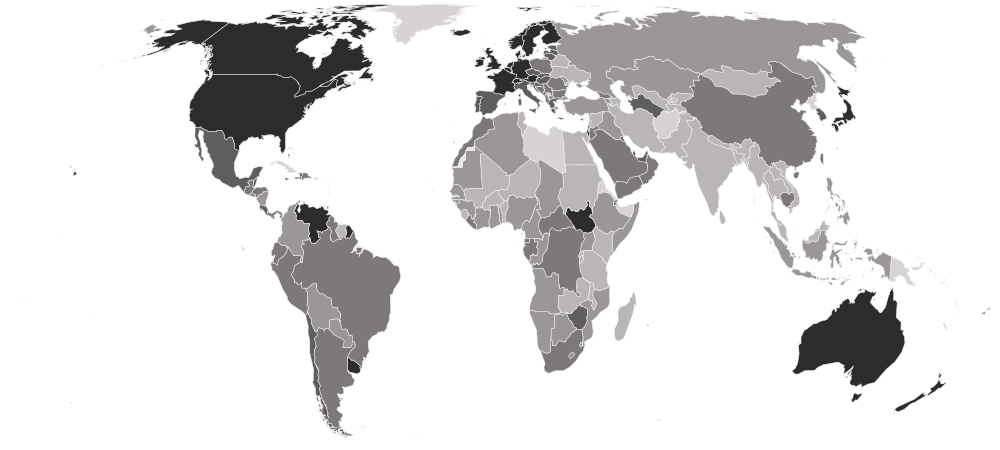
Price level (cost of living) on a map
Each country is shaded by its value, in five groups holding the same number of countries. Hover a country for its value, or select it to open its profile. Below the map, each continent’s middle country.
Darker is a higher value. This statistic has no better end, so the shades describe size, not success.
- 0.17743–0.35238
- 0.35270–0.44347
- 0.44424–0.58272
- 0.58339–0.82585
- 0.82904–65.54493
- No reading in 2023
- Europe
0.75001
the middle country, of 39 measured · 49 members
Switzerland1.40999 Belarus0.28902
Highest and lowest reading in Europe.
- Americas
0.66399
the middle country, of 43 measured · 48 members
Venezuela65.54493 Suriname0.33683
Highest and lowest reading in Americas.
- Asia
0.43165
the middle country, of 48 measured · 52 members
Israel1.16477 Myanmar0.18905
Highest and lowest reading in Asia.
- Africa
0.38791
the middle country, of 52 measured · 55 members
South Sudan0.89513 Egypt0.17743
Highest and lowest reading in Africa.
- Oceania
3 of 21 measured — too few for a middle: Australia, Fiji, New Zealand.
Australia1.07365 Fiji0.42782
Highest and lowest reading in Oceania.
- Every region
20 sub-regions, highest middle country first
- Northern Europe
1.02257
the middle country, of 10 measured · 13 members
 Iceland1.30275
 Lithuania0.65956
Highest and lowest reading in Northern Europe.
- Western Europe
0.94747
the middle country, of 7 measured · 9 members
Switzerland1.40999 Germany0.89559
Highest and lowest reading in Western Europe.
- Caribbean
0.83166
the middle country, of 20 measured · 24 members
Barbados1.50705 Dominican Republic0.45478
Highest and lowest reading in Caribbean.
- Eastern Asia
0.71296
the middle country, of 7 measured · 8 members
 Hong Kong0.85451
 Mongolia0.34699
Highest and lowest reading in Eastern Asia.
- Southern Europe
0.69429
the middle country, of 12 measured · 17 members
 Italy0.82585
 North Macedonia0.41198
Highest and lowest reading in Southern Europe.
- Central America
0.56078
the middle country, of 8 measured · 8 members
 Costa Rica0.73788
 Nicaragua0.40188
Highest and lowest reading in Central America.
- Eastern Europe
0.52852
the middle country, of 10 measured · 10 members
 Slovakia0.75001Belarus0.28902
Highest and lowest reading in Eastern Europe.
- Western Asia
0.52814
the middle country, of 18 measured · 19 members
Israel1.16477 Syria0.20757
Highest and lowest reading in Western Asia.
- South America
0.51288
the middle country, of 12 measured · 12 members
Venezuela65.54493Suriname0.33683Highest and lowest reading in South America.
- Middle Africa
0.47941
the middle country, of 9 measured · 9 members
 São Tomé and Príncipe0.56267
 Cameroon0.35882
Highest and lowest reading in Middle Africa.
- Eastern Africa
0.39208
the middle country, of 17 measured · 19 members
South Sudan0.89513 Madagascar0.28693
Highest and lowest reading in Eastern Africa.
- Southern Africa
0.38899
the middle country, of 5 measured · 5 members
 South Africa0.45351
 Lesotho0.35270
Highest and lowest reading in Southern Africa.
- Western Africa
0.36987
the middle country, of 16 measured · 16 members
 Liberia0.57850
 Sierra Leone0.25673
Highest and lowest reading in Western Africa.
- South-eastern Asia
0.35715
the middle country, of 10 measured · 11 members
 Singapore0.85133Myanmar0.18905
Highest and lowest reading in South-eastern Asia.
- Northern Africa
0.32092
the middle country, of 5 measured · 6 members
 Morocco0.44945Egypt0.17743
Highest and lowest reading in Northern Africa.
- Central Asia
0.31357
the middle country, of 5 measured · 5 members
 Turkmenistan0.59890
 Uzbekistan0.28712
Highest and lowest reading in Central Asia.
- Southern Asia
0.29855
the middle country, of 8 measured · 9 members
 Maldives0.70680
 Pakistan0.20088
Highest and lowest reading in Southern Asia.
- Australia and New Zealand
2 of 2 measured — too few for a middle: Australia, New Zealand.
Australia1.07365 New Zealand1.02108
Highest and lowest reading in Australia and New Zealand.
- Melanesia
1 of 5 measured — too few for a middle: Fiji.
Fiji0.42782Highest and lowest reading in Melanesia.
- Northern America
3 of 4 measured — too few for a middle: Bermuda, Canada, United States.
 Bermuda1.38626
 Canada0.98606
Highest and lowest reading in Northern America.
03The whole field at once
The spread
185 countries, one dot each, on one scale — further right is a higher value. Half the countries are above 0.52343; a quarter are above 0.74832, and a quarter below 0.37148. The bar in each row marks that continent’s middle country.
04All 185 ever measured
Every country
In order, highest value first. No rank or position is shown: too many countries share the same value for an order to mean anything. Neither end is better. Richer countries are usually more expensive, because services cost more where wages are high, and a cheap country is cheap for visitors and competitive for exporters. A country at the very top can be an artefact of an exchange rate that stopped tracking prices; the Penn World Table flags such cases as outliers, and the flag is in the downloadable file.
Showing 25 of 185 countries



























































































































Values for 2023. The change column compares 2023 with 2022 only; the sparkline covers the recent editions.
051960–2023 · 64 reference years
Over time
Each point is one year from 1960, all recalculated in Penn World Table 11.0 and all measured against the same yardstick, US prices in 2021 — so even the United States reads below 1 in earlier years and above 1 once its own prices rose.
- the middle country
- the middle half of countries
- the middle of the 111 countries measured every time
- each continent’s middle country
The same, year by year
| Year | Countries | Middle country | Middle half | Measured every time |
|---|---|---|---|---|
| 2023 | 185 | 0.52343 | 0.37148 – 0.74832 | 0.49421 |
| 2022 | 185 | 0.49402 | 0.36702 – 0.68151 | 0.47463 |
| 2021 | 185 | 0.47401 | 0.35219 – 0.69778 | 0.46660 |
| 2020 | 185 | 0.44759 | 0.33820 – 0.63528 | 0.43664 |
| 2019 | 185 | 0.44902 | 0.34784 – 0.65278 | 0.44623 |
| 2018 | 185 | 0.47049 | 0.35262 – 0.69634 | 0.46916 |
| 2017 | 185 | 0.44317 | 0.34288 – 0.67367 | 0.43413 |
| 2016 | 185 | 0.43229 | 0.33519 – 0.65201 | 0.41928 |
| 2015 | 185 | 0.44077 | 0.34628 – 0.65039 | 0.42300 |
| 2014 | 185 | 0.48974 | 0.37911 – 0.68571 | 0.47885 |
| 2013 | 185 | 0.48303 | 0.39508 – 0.69060 | 0.47255 |
| 2012 | 185 | 0.45696 | 0.37162 – 0.65542 | 0.45164 |
| 2011 | 185 | 0.47011 | 0.38130 – 0.63821 | 0.44910 |
| 2010 | 185 | 0.43688 | 0.35071 – 0.61837 | 0.41660 |
| 2009 | 185 | 0.43776 | 0.34479 – 0.63479 | 0.41856 |
| 2008 | 185 | 0.46436 | 0.37227 – 0.64760 | 0.44812 |
| 2007 | 184 | 0.41790 | 0.32944 – 0.61201 | 0.39789 |
| 2006 | 184 | 0.40173 | 0.29419 – 0.56783 | 0.38063 |
| 2005 | 184 | 0.38593 | 0.27404 – 0.54535 | 0.36247 |
| 2004 | 182 | 0.35932 | 0.26409 – 0.53017 | 0.35803 |
| 2003 | 182 | 0.33949 | 0.23545 – 0.49261 | 0.32038 |
| 2002 | 182 | 0.30976 | 0.21567 – 0.47723 | 0.29098 |
| 2001 | 182 | 0.29086 | 0.20763 – 0.47343 | 0.29565 |
| 2000 | 182 | 0.29893 | 0.20798 – 0.49308 | 0.30531 |
| 1999 | 182 | 0.30593 | 0.22015 – 0.50565 | 0.31123 |
| 1998 | 182 | 0.32082 | 0.22903 – 0.51031 | 0.32853 |
| 1997 | 182 | 0.32267 | 0.22126 – 0.52048 | 0.33321 |
| 1996 | 182 | 0.32857 | 0.23221 – 0.49354 | 0.33586 |
| 1995 | 182 | 0.32829 | 0.23583 – 0.50355 | 0.33548 |
| 1994 | 182 | 0.32135 | 0.21276 – 0.47893 | 0.32705 |
| 1993 | 182 | 0.32637 | 0.22914 – 0.46789 | 0.33666 |
| 1992 | 182 | 0.32946 | 0.22361 – 0.47251 | 0.34729 |
| 1991 | 182 | 0.32596 | 0.21520 – 0.45767 | 0.34205 |
| 1990 | 182 | 0.32197 | 0.21779 – 0.43389 | 0.34352 |
| 1989 | 159 | 0.32544 | 0.23249 – 0.42434 | 0.32614 |
| 1988 | 158 | 0.31640 | 0.22996 – 0.43741 | 0.32134 |
| 1987 | 158 | 0.30505 | 0.22320 – 0.41789 | 0.30877 |
| 1986 | 158 | 0.28586 | 0.20621 – 0.38054 | 0.28614 |
| 1985 | 158 | 0.26268 | 0.20566 – 0.35021 | 0.25650 |
| 1984 | 158 | 0.26601 | 0.21441 – 0.35078 | 0.26622 |
| 1983 | 158 | 0.28182 | 0.22354 – 0.37196 | 0.28990 |
| 1982 | 158 | 0.28671 | 0.22402 – 0.37124 | 0.30750 |
| 1981 | 158 | 0.28455 | 0.22048 – 0.37328 | 0.31149 |
| 1980 | 158 | 0.28579 | 0.21430 – 0.37861 | 0.29702 |
| 1979 | 158 | 0.24586 | 0.18659 – 0.34051 | 0.26572 |
| 1978 | 158 | 0.22447 | 0.16445 – 0.29444 | 0.23454 |
| 1977 | 158 | 0.20197 | 0.15591 – 0.27302 | 0.21035 |
| 1976 | 158 | 0.18526 | 0.14090 – 0.25226 | 0.19173 |
| 1975 | 158 | 0.18524 | 0.13569 – 0.24418 | 0.18703 |
| 1974 | 158 | 0.16322 | 0.12367 – 0.21980 | 0.16111 |
| 1973 | 158 | 0.13788 | 0.10422 – 0.19762 | 0.13687 |
| 1972 | 158 | 0.12248 | 0.08798 – 0.16509 | 0.12065 |
| 1971 | 158 | 0.11371 | 0.08310 – 0.14995 | 0.11231 |
| 1970 | 158 | 0.10599 | 0.07887 – 0.13894 | 0.10655 |
| 1969 | 114 | 0.10140 | 0.08040 – 0.13468 | 0.10122 |
| 1968 | 114 | 0.09857 | 0.07669 – 0.13084 | 0.09809 |
| 1967 | 114 | 0.09663 | 0.07555 – 0.13306 | 0.09641 |
| 1966 | 114 | 0.09445 | 0.07450 – 0.12947 | 0.09358 |
| 1965 | 114 | 0.09284 | 0.07291 – 0.12462 | 0.09252 |
| 1964 | 114 | 0.08991 | 0.07118 – 0.12173 | 0.08953 |
| 1963 | 113 | 0.08649 | 0.06906 – 0.11730 | 0.08559 |
| 1962 | 113 | 0.08582 | 0.06929 – 0.11527 | 0.08578 |
| 1961 | 112 | 0.08478 | 0.06550 – 0.11402 | 0.08411 |
| 1960 | 111 | 0.08461 | 0.06474 – 0.11034 | 0.08461 |
062022 → 2023
Who rose and fell
The biggest changes in value between the two newest editions — reference years recalculated in one report, not two separate publications. Places are shown second, because they also move when other countries do.
Rose most
before → after- Venezuela46.12200 → 65.54493+19.42293
- South Sudan0.56659 → 0.89513+0.32854
- Turks and Caicos Islands1.30266 → 1.47185+0.16920
 Ireland1.08080 → 1.20759+0.12679
- Costa Rica0.61582 → 0.73788+0.12205
185 countries were measured in both 2022 and 2023.
07Across every edition
Price level (cost of living) in records
The extremes of the statistic. A record reached by more than one country names none of them.
Highest reading on record
65.54493
Price level of household consumption (US output price level in 2021 = 1)
Lowest reading on record
0.01407
Price level of household consumption (US output price level in 2021 = 1)
Biggest rise between editions
+19.42293
46.12200 → 65.54493
Biggest fall between editions
−3.55890
19.92844 → 16.36955
Biggest change since first measured
+65.40030
0.14463 → 65.54493
Highest most often
15 of 64
editions, alone at the first-listed end
08The measure
About price level (cost of living)
The price level of household consumption says how expensive a country is: what the things households buy cost there, converted at market exchange rates, compared with prices in the United States. A value of 0.5 means a basket of consumer goods and services costs about half what the same basket cost in the US in 2021; above 1, more.
What the number is: Price level of household consumption (US output price level in 2021 = 1).
09Where it fits
Connections
Its part in the Country Index, the statistics whose values line up most closely with it across countries, and others on the same subject.
In the Country Index
Context, with no vote
This statistic is published in full under Economy & Innovation, but does not help decide any Country Index standing.
Moves with
Where price level (cost of living) is higher, these tend to be higher too.
- Anthropic AI Usage IndexAnthropic · 120 countries in commonρ 0.82
- Human Capital Wealth per CapitaWorld Bank Group · 149 countries in commonρ 0.80
- World Energy Trilemma IndexKeyWorld Energy Council · 126 countries in commonρ 0.79
Moves against
Where price level (cost of living) is higher, these tend to be lower.
- Informal Employment RateILO · 86 countries in commonρ −0.77
- Agriculture, Forestry and Fishing Value Added (% of GDP)World Bank Group · 152 countries in commonρ −0.74
- Share of Dietary Energy Supply from Cereals, Roots and TubersFAO · 161 countries in commonρ −0.73
Rank correlation (ρ, from −1 to 1) across countries, on each statistic’s newest edition, out of 380 statistics sharing at least 80 countries with this one. Two statistics that move together do not cause each other.
10Keep reading
Explore further
The subject
More from GGDC
11Questions
Price level (cost of living): questions and answers
Which country has the highest price level (cost of living)?
Venezuela, at 65.54493, among the 185 countries compared in 2023.
Which country has the lowest price level (cost of living)?
Egypt, at 0.17743, among the 185 countries compared in 2023.
How many countries does the Price Level of Household Consumption cover?
185 in 2023. The number measured varies from 111 to 185 between editions.
What is the world average price level (cost of living)?
This site does not calculate a world average, which would depend on how countries are weighted. In the middle country of the 185 compared in 2023, the figure was 0.52343.
Is this Groningen Growth and Development Centre (GGDC)’s own ranking?
No ranking is shown. Groningen Growth and Development Centre (GGDC) publishes values only, and too many countries share the same value for an ordering to mean anything, so none is derived.
How often is the Price Level of Household Consumption published?
This site holds 64 reference years, 1960–2023, all recalculated in Groningen Growth and Development Centre (GGDC)’s 2025 report on one method — not 64 separate publications.
Where does the data come from, and can I download it?
From Groningen Growth and Development Centre (GGDC), under CC BY 4.0. From Penn World Table 11.0 (column pl_c), published by the Groningen Growth and Development Centre. The file also carries the table's own flags: whether each year's prices come from an international price survey or are extrapolated from one, and whether the country's price level is treated as an outlier. Every edition is on this site’s Datasets pages as a full table, and downloads as a CSV file with every value unrounded.
12Method
Sources, method and citation
Source
Price Level of Household Consumption — Groningen Growth and Development Centre (GGDC)
From Penn World Table 11.0 (column pl_c), published by the Groningen Growth and Development Centre. The file also carries the table's own flags: whether each year's prices come from an international price survey or are extrapolated from one, and whether the country's price level is treated as an outlier.
Newest edition
Report year 2023Data year 2023
Cite the source as: Feenstra, Robert C., Robert Inklaar and Marcel P. Timmer (2015), "The Next Generation of the Penn World Table", American Economic Review, 105(10), 3150–3182. Penn World Table version 11.0, www.ggdc.net/pwt.
Licence: CC BY 4.0, checked 2026-09-29.
How this page reads the numbers
- No rank or position is shown: Groningen Growth and Development Centre (GGDC) publishes values only, and too many countries share the same value for an ordering to mean anything.
- This statistic has no better end, so the page describes higher and lower values and never calls a country a leader.
- A country is named at an end only when it holds that value alone. Where several share it, the page says how many and names none first.
- Values are stored exactly as published and trimmed only for display. “The middle country” is the median of the countries measured, not a world average.
The file itself, column by column — where it came from, what each column holds, and every edition as a CSV — is on its dataset page.
Cite this page
Nations Inquiry (2026). Price level (cost of living) by country: Price Level of Household Consumption, data from Groningen Growth and Development Centre (GGDC). https://nationsinquiry.com/statistics/consumption-price-level