ILO · Average Monthly Earnings of Employees
Average monthly earnings by country
How much do employees earn in a month, in dollars of equal purchasing power?
Luxembourg placed first of the 75 countries compared in 2024, at 9,307, and Rwanda last, at 193. In the middle country the figure was 1,636. Among the 31 countries measured in every edition since 2002, the middle one moved from 1,100 to 4,065.
Share
Average monthly earnings · 2024
Context statistic

Highest of 75Luxembourg
9,307012024 · position · derived
Who leads
The three countries at the highest end of 75 compared, the three at the other end, and the first on each continent.
 1
Photo: Michal Osmenda from Brussels, Belgium · CC BY-SA 2.0, greyscale
 2
Photo: Gf uip · CC BY-SA 3.0, greyscale
 3
Photo: Traveler100 · CC BY-SA 3.0, greyscale


Highest on each continent
- Africa
 Mauritius1,629
- Americas
 United States5,985
- Asia
 Cyprus4,566
- EuropeLuxembourg9,307
- Oceania
 Fiji1,503
1 of 21 measured
- Every region
02Every measured country
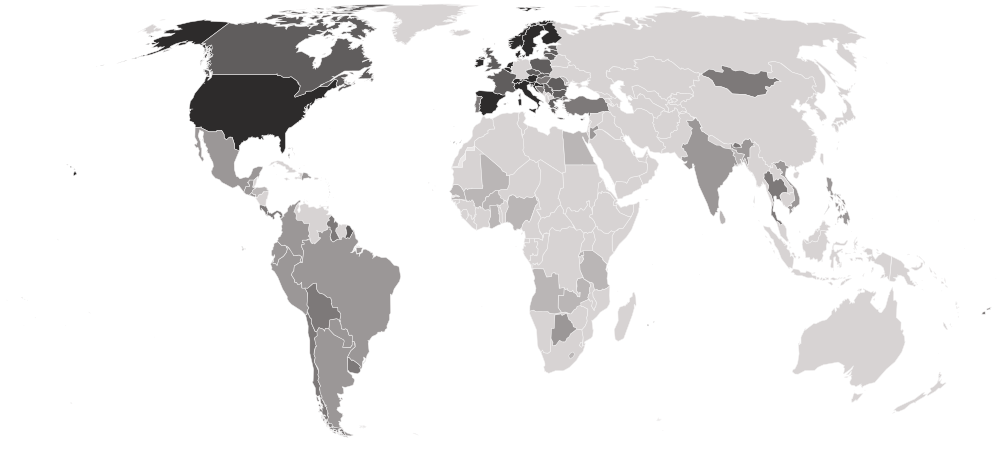
Average monthly earnings on a map
Each country is shaded by its value, in five groups holding the same number of countries. Hover a country for its value, or select it to open its profile. Below the map, each continent’s middle country.
Darker is a higher value — the better end.
- 193–864
- 893–1,250
- 1,352–2,311
- 2,451–4,566
- 4,622–9,307
- No reading in 2024 (94 measured in an earlier edition)
- Europe
4,310
the middle country, of 30 measured · 49 members
Luxembourg9,307 Moldova864
Highest and lowest reading in Europe.
- Americas
1,249
the middle country, of 20 measured · 48 members
United States5,985 Honduras862
Highest and lowest reading in Americas.
- Asia
1,198
the middle country, of 11 measured · 52 members
Cyprus4,566 Bangladesh470
Highest and lowest reading in Asia.
- Africa
555
the middle country, of 13 measured · 55 members
Mauritius1,629 Rwanda193
Highest and lowest reading in Africa.
- Oceania
1 of 21 measured — too few for a middle: Fiji.
Fiji1,503Highest and lowest reading in Oceania.
- Every region
18 sub-regions, highest middle country first
- Western Europe
7,033
the middle country, of 6 measured · 9 members
Luxembourg9,307 France3,064
Highest and lowest reading in Western Europe.
- Northern Europe
5,317
the middle country, of 9 measured · 13 members
 Norway6,749
 Lithuania4,001
Highest and lowest reading in Northern Europe.
- Southern Europe
4,084
the middle country, of 8 measured · 17 members
 Italy5,326
 Portugal2,096
Highest and lowest reading in Southern Europe.
- Eastern Europe
3,076
the middle country, of 7 measured · 10 members
 Czechia4,172Moldova864
Highest and lowest reading in Eastern Europe.
- South America
1,249
the middle country, of 10 measured · 12 members
 Chile2,079
 Peru964
Highest and lowest reading in South America.
- Central America
1,023
the middle country, of 6 measured · 8 members
 Costa Rica1,843Honduras862
Highest and lowest reading in Central America.
- Western Africa
546
the middle country, of 5 measured · 16 members
 Senegal738
 Nigeria288
Highest and lowest reading in Western Africa.
- Caribbean
2 of 24 measured — too few for a middle: Bahamas, Dominican Republic.
 Bahamas2,660
 Dominican Republic1,173
Highest and lowest reading in Caribbean.
- Eastern Africa
4 of 19 measured — too few for a middle: Mauritius, Rwanda, Tanzania, Zambia.
Mauritius1,629Rwanda193Highest and lowest reading in Eastern Africa.
- Eastern Asia
1 of 8 measured — too few for a middle: Mongolia.
 Mongolia1,478
Highest and lowest reading in Eastern Asia.
- Melanesia
1 of 5 measured — too few for a middle: Fiji.
Fiji1,503Highest and lowest reading in Melanesia.
- Middle Africa
1 of 9 measured — too few for a middle: Angola.
 Angola359
Highest and lowest reading in Middle Africa.
- Northern Africa
1 of 6 measured — too few for a middle: Egypt.
 Egypt713
Highest and lowest reading in Northern Africa.
- Northern America
2 of 4 measured — too few for a middle: Canada, United States.
United States5,985 Canada4,505
Highest and lowest reading in Northern America.
- South-eastern Asia
3 of 11 measured — too few for a middle: Philippines, Thailand, Vietnam.
 Thailand1,515
 Philippines893
Highest and lowest reading in South-eastern Asia.
- Southern Africa
2 of 5 measured — too few for a middle: Botswana, Lesotho.
 Botswana1,232
 Lesotho406
Highest and lowest reading in Southern Africa.
- Southern Asia
4 of 9 measured — too few for a middle: Bangladesh, Bhutan, India, Sri Lanka.
 Bhutan1,352Bangladesh470
Highest and lowest reading in Southern Asia.
- Western Asia
3 of 19 measured — too few for a middle: Cyprus, Jordan, Türkiye.
Cyprus4,566 Jordan1,094
Highest and lowest reading in Western Asia.
03The whole field at once
The spread
75 countries, one dot each, on one scale — further right is a higher value. Half the countries are above 1,636; a quarter are above 4,118, and a quarter below 1,023. The bar in each row marks that continent’s middle country.
04All 169 ever measured
Every country
In order, highest value first. “=” marks a position shared with another country. International Labour Organization (ILO) ranks nobody on this measure; the position is derived here by ordering the published values. Only employees are counted. Where most people work for themselves or informally, the few with a wage job are often the better paid, so the average flatters poorer countries. It is also a mean, pulled up by the highest earners, so it sits above what a typical employee takes home.
Showing 25 of 169 countries






































































































Values for 2024. The change column compares 2024 with 2023 only; the sparkline covers the recent editions.
052002–2024 · 22 reference years
Over time
Each point is one year, in constant 2021 purchasing-power dollars, so a rising line means pay that buys more, not merely more money. A “Break in series” flag in the data marks a change of survey that can move the level by itself.
- the middle country
- the middle half of countries
- the middle of the 31 countries measured every time
- each continent’s middle country
The same, year by year
| Year | Countries | Middle country | Middle half | Measured every time |
|---|---|---|---|---|
| 2024 | 75 | 1,636 | 1,023 – 4,118 | 4,065 |
| 2023 | 79 | 1,385 | 857 – 3,417 | 3,410 |
| 2022 | 97 | 1,424 | 811 – 3,227 | 3,227 |
| 2021 | 90 | 1,579 | 862 – 3,447 | 3,184 |
| 2020 | 94 | 1,569 | 871 – 3,394 | 3,057 |
| 2019 | 115 | 1,236 | 716 – 2,787 | 2,803 |
| 2018 | 100 | 1,338 | 773 – 2,735 | 2,625 |
| 2017 | 102 | 1,266 | 704 – 2,811 | 2,445 |
| 2016 | 104 | 1,273 | 838 – 2,621 | 2,458 |
| 2015 | 98 | 1,351 | 783 – 2,741 | 2,328 |
| 2014 | 103 | 1,243 | 769 – 2,482 | 2,188 |
| 2013 | 98 | 1,202 | 734 – 2,562 | 2,121 |
| 2012 | 99 | 1,171 | 719 – 2,457 | 2,052 |
| 2011 | 96 | 1,120 | 695 – 2,363 | 2,022 |
| 2010 | 93 | 1,072 | 631 – 2,295 | 1,901 |
| 2009 | 87 | 1,169 | 609 – 2,448 | 1,852 |
| 2008 | 77 | 1,009 | 618 – 2,475 | 1,641 |
| 2007 | 81 | 927 | 586 – 2,326 | 1,573 |
| 2006 | 78 | 792 | 538 – 2,099 | 1,079 |
| 2005 | 80 | 662 | 466 – 1,789 | 999 |
| 2004 | 71 | 718 | 479 – 1,924 | 1,111 |
| 2002 | 65 | 669 | 439 – 1,984 | 1,100 |
062023 → 2024
Who rose and fell
The biggest changes in value between the two newest editions — reference years recalculated in one report, not two separate publications. Places are shown second, because they also move when other countries do.
Improved most
before → after Croatia2,965 → 4,622 · 25th → 15th+1,657
- Bahamas1,796 → 2,660 · 35th → 28th+864
- Mauritius933 → 1,629 · 56th → 39th+696
- United States5,334 → 5,985 · 10th → 8th+651
- Lithuania3,372 → 4,001 · 22nd → 22nd+629
Declined most
before → after- Norway7,138 → 6,749 · 3rd → 5th−389
 Sweden5,600 → 5,317 · 8th → 12th−283
 Ghana783 → 546 · 66th → 69th−236
- Angola502 → 359 · 75th → 73rd−142
 Burkina Faso526 → 516 · 72nd → 70th−10
70 countries were measured in both 2023 and 2024. The field changed from 79 to 75 countries, so a place can move for reasons that have nothing to do with the country itself.
07Across every edition
Average monthly earnings in records
The extremes of the statistic. A record reached by more than one country names none of them.
Highest reading on record
9,307
Average monthly earnings of employees (2021 PPP $)
Lowest reading on record
4
Average monthly earnings of employees (2021 PPP $)
Biggest improvement between editions
+2,749
3,840 → 6,588
Biggest decline between editions
−2,584
4,246 → 1,662
Most improved since first measured
+6,335
2,972 → 9,307
At the top most often
16 of 22
editions, alone at the first-listed end
08By sex
Inside the number
International Labour Organization (ILO) also publishes separate female and male readings. The gap between them, where both exist.
Of the 75 countries with both readings, the women reading is higher in 5, the men reading in 70. The widest gaps each way:
09The measure
About average monthly earnings
This is what employees earn in a month on average, before tax, converted by the International Labour Organization into dollars of equal purchasing power so that a month’s pay can be compared across countries with very different prices.
What the number is: Average monthly earnings of employees (2021 PPP $).
10Where it fits
Connections
Its part in the Country Index, the statistics whose values line up most closely with it across countries, and others on the same subject.
In the Country Index
Context, with no vote
This statistic is published in full under Economy & Innovation and Work & Labour, but does not help decide any Country Index standing.
Economy & InnovationWork & LabourWhich statistics vote, and why
Moves with
Where average monthly earnings is higher, these tend to be higher too.
No statistic lines up this closely.
Moves against
Where average monthly earnings is higher, these tend to be lower.
No statistic lines up this closely.
Rank correlation (ρ, from −1 to 1) across countries, on each statistic’s newest edition, out of 0 statistics sharing at least 80 countries with this one. Two statistics that move together do not cause each other.
11Keep reading
Explore further
The subject
The countries at either end
12Questions
Average monthly earnings: questions and answers
Which country has the highest average monthly earnings?
Luxembourg, at 9,307, among the 75 countries compared in 2024.
Which country has the lowest average monthly earnings?
Rwanda, at 193, among the 75 countries compared in 2024.
How many countries does the Average Monthly Earnings of Employees cover?
75 in 2024, and 169 at least once across all editions. The number measured varies from 65 to 115 between editions.
What is the world average average monthly earnings?
This site does not calculate a world average, which would depend on how countries are weighted. In the middle country of the 75 compared in 2024, the figure was 1,636.
Is this International Labour Organization (ILO)’s own ranking?
No. International Labour Organization (ILO) publishes the values but ranks nobody; the position on this page is derived by Nations Inquiry by ordering the published values, and equal values share a position.
How often is the Average Monthly Earnings of Employees published?
This site holds 22 reference years, 2002–2024, all recalculated in International Labour Organization (ILO)’s 2026 report on one method — not 22 separate publications.
Where does the data come from, and can I download it?
From International Labour Organization (ILO), under CC BY 4.0. Read from ILOSTAT directly, in the 2021 purchasing-power dollars the ILO itself publishes beside local currency and US dollars. Every edition is on this site’s Datasets pages as a full table, and downloads as a CSV file with every value unrounded.
13Method
Sources, method and citation
Source
Average Monthly Earnings of Employees — International Labour Organization (ILO)
Read from ILOSTAT directly, in the 2021 purchasing-power dollars the ILO itself publishes beside local currency and US dollars.
Newest edition
Report year 2024Data year 2024
Cite the source as: International Labour Organization. ILOSTAT. Geneva: ILO.
Licence: CC BY 4.0, checked 2026-09-29.
How this page reads the numbers
- International Labour Organization (ILO) ranks nobody on this measure. The position is derived by Nations Inquiry by ordering the published values; equal values share a position.
- Which end is better follows the publisher’s own reading of the measure.
- A country is named at an end only when it holds that value alone. Where several share it, the page says how many and names none first.
- Values are stored exactly as published and trimmed only for display. “The middle country” is the median of the countries measured, not a world average.
The file itself, column by column — where it came from, what each column holds, and every edition as a CSV — is on its dataset page.
Photographs
The countries at the top of this statistic, from their profiles: Wikimedia Commons, shown in greyscale, each used under the licence named.
- Luxembourg — Michal Osmenda from Brussels, Belgium, CC BY-SA 2.0
- Belgium — Gf uip, CC BY-SA 3.0
- Netherlands — Traveler100, CC BY-SA 3.0
Cite this page
Nations Inquiry (2026). Average monthly earnings by country: Average Monthly Earnings of Employees, data from International Labour Organization (ILO). https://nationsinquiry.com/statistics/average-monthly-earnings