Ana Carolina Garriga, University of Essex · Central Bank Independence Index
Central bank independence by country
How far does the law shield a country's central bank from its government?
Of the 191 countries compared in 2023, Bosnia and Herzegovina had the highest reading, 0.974, and Tuvalu had the lowest reading, 0.006. In the middle country the figure was 0.608. Among the 88 countries measured in every edition since 1970, the middle one moved from 0.370 to 0.607.
Central bank independence · 2023
Context statistic

Highest of 191Bosnia and Herzegovina
0.974012023 · values only
The highest and the lowest
The three countries with the highest values of 191 compared, the three with the lowest, and the highest on each continent. This statistic has no better end, so no country is shown as leading.
- 1
- 2

- 3
Highest on each continent
- Africa
8 countries share 0.841
- Americas
 Peru0.811
 - AsiaArmenia0.889
- Europe
- Oceania
 Solomon Islands0.715
 - Every region
02Every measured country
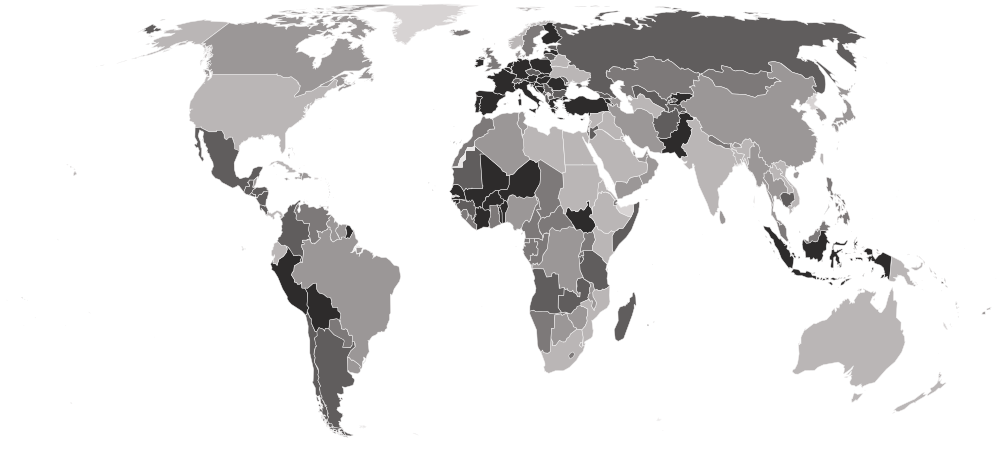
Central bank independence on a map
Each country is shaded by its value, in five groups holding the same number of countries. Hover a country for its value, or select it to open its profile. Below the map, each continent’s middle country.
Darker is a higher value. This statistic has no better end, so the shades describe size, not success.
- 0.006–0.423
- 0.431–0.552
- 0.554–0.634
- 0.636–0.780
- 0.782–0.974
- No reading in 2023
- Europe
0.796
the middle country, of 40 measured · 49 members
Bosnia and Herzegovina0.974 San Marino0.213
Highest and lowest reading in Europe.
- Americas
0.626
the middle country, of 40 measured · 48 members
Peru0.811 Bermuda0.100
Highest and lowest reading in Americas.
- Africa
0.601
the middle country, of 54 measured · 55 members
8 share 0.841
 Ethiopia0.304
Highest and lowest reading in Africa.
- Asia
0.507
the middle country, of 48 measured · 52 members
Armenia0.889 Vietnam0.150
Highest and lowest reading in Asia.
- Oceania
0.473
the middle country, of 9 measured · 21 members
Solomon Islands0.715 Tuvalu0.006
Highest and lowest reading in Oceania.
- Every region
21 sub-regions, highest middle country first
- Southern Europe
0.796
the middle country, of 13 measured · 17 members
Bosnia and Herzegovina0.974San Marino0.213Highest and lowest reading in Southern Europe.
- Western Europe
0.796
the middle country, of 7 measured · 9 members
6 share 0.796
 Switzerland0.752
Highest and lowest reading in Western Europe.
- Eastern Europe
0.765
the middle country, of 10 measured · 10 members
 Romania0.879
 Belarus0.369
Highest and lowest reading in Eastern Europe.
- Western Africa
0.756
the middle country, of 16 measured · 16 members
8 share 0.841
 Gambia0.504
Highest and lowest reading in Western Africa.
- Northern Europe
0.692
the middle country, of 10 measured · 13 members
3 share 0.796
 Norway0.419
Highest and lowest reading in Northern Europe.
- Central America
0.681
the middle country, of 8 measured · 8 members
 Costa Rica0.735
 Panama0.254
Highest and lowest reading in Central America.
- Central Asia
0.651
the middle country, of 5 measured · 5 members
 Kyrgyzstan0.843
 Turkmenistan0.264
Highest and lowest reading in Central Asia.
- Caribbean
0.633
the middle country, of 17 measured · 24 members
 Barbados0.737
 Cayman Islands0.301
Highest and lowest reading in Caribbean.
- Middle Africa
0.608
the middle country, of 9 measured · 9 members
 Angola0.693
 São Tomé and Príncipe0.449
Highest and lowest reading in Middle Africa.
- South America
0.601
the middle country, of 12 measured · 12 members
Peru0.811 Ecuador0.213
Highest and lowest reading in South America.
- Eastern Africa
0.589
the middle country, of 18 measured · 19 members
 South Sudan0.782Ethiopia0.304
Highest and lowest reading in Eastern Africa.
- Southern Africa
0.522
the middle country, of 5 measured · 5 members
 Lesotho0.602
 South Africa0.354
Highest and lowest reading in Southern Africa.
- Southern Asia
0.521
the middle country, of 9 measured · 9 members
 Pakistan0.811
 India0.356
Highest and lowest reading in Southern Asia.
- South-eastern Asia
0.514
the middle country, of 11 measured · 11 members
 Indonesia0.827Vietnam0.150
Highest and lowest reading in South-eastern Asia.
- Eastern Asia
0.483
the middle country, of 5 measured · 8 members
 Mongolia0.634
 Taiwan0.273
Highest and lowest reading in Eastern Asia.
- Western Asia
0.472
the middle country, of 18 measured · 19 members
Armenia0.889 Lebanon0.323
Highest and lowest reading in Western Asia.
- Northern Africa
0.422
the middle country, of 6 measured · 6 members
 Morocco0.613
 Sudan0.316
Highest and lowest reading in Northern Africa.
- Australia and New Zealand
2 of 2 measured — too few for a middle: Australia, New Zealand.
 New Zealand0.399
 Australia0.354
Highest and lowest reading in Australia and New Zealand.
- Melanesia
4 of 5 measured — too few for a middle: Fiji, Papua New Guinea, Solomon Islands, Vanuatu.
Solomon Islands0.715 Papua New Guinea0.420
Highest and lowest reading in Melanesia.
- Northern America
3 of 4 measured — too few for a middle: Bermuda, Canada, United States.
 Canada0.478Bermuda0.100
Highest and lowest reading in Northern America.
- Polynesia
3 of 7 measured — too few for a middle: Samoa, Tonga, Tuvalu.
 Tonga0.554Tuvalu0.006
Highest and lowest reading in Polynesia.
03The whole field at once
The spread
191 countries, one dot each, on one scale — further right is a higher value. Half the countries are above 0.608; a quarter are above 0.736, and a quarter below 0.472. The bar in each row marks that continent’s middle country.
04All 191 ever measured
Every country
In order, highest value first. No rank or position is shown: too many countries share the same value for an order to mean anything. This is the law on paper, not the bank in practice: a governor can be leaned on under a strong statute, and left alone under a weak one. Countries that share a central bank — the CFA franc zones, the Eastern Caribbean, most of the euro area — share one reading, so the table has long runs of identical values.
Showing 25 of 191 countries























































































Values for 2023. The change column compares 2023 with 2022 only; the sparkline covers the recent editions.
051970–2023 · 54 editions
Over time
Each point is one year from 1970. The line moves only when the law changes, so it runs flat for years and then steps up or down at a statutory reform — a step tells you a law was rewritten, not that practice changed.
- the middle country
- the middle half of countries
- the middle of the 88 countries measured every time
- each continent’s middle country
The same, year by year
| Year | Countries | Middle country | Middle half | Measured every time |
|---|---|---|---|---|
| 2023 | 191 | 0.608 | 0.472 – 0.736 | 0.607 |
| 2022 | 191 | 0.608 | 0.472 – 0.736 | 0.613 |
| 2021 | 191 | 0.608 | 0.471 – 0.733 | 0.594 |
| 2020 | 191 | 0.608 | 0.471 – 0.733 | 0.594 |
| 2019 | 191 | 0.602 | 0.466 – 0.733 | 0.594 |
| 2018 | 191 | 0.608 | 0.460 – 0.733 | 0.599 |
| 2017 | 191 | 0.608 | 0.466 – 0.733 | 0.609 |
| 2016 | 191 | 0.608 | 0.466 – 0.733 | 0.609 |
| 2015 | 191 | 0.608 | 0.466 – 0.734 | 0.609 |
| 2014 | 191 | 0.608 | 0.455 – 0.734 | 0.609 |
| 2013 | 191 | 0.608 | 0.452 – 0.736 | 0.609 |
| 2012 | 191 | 0.608 | 0.450 – 0.736 | 0.609 |
| 2011 | 191 | 0.601 | 0.442 – 0.738 | 0.599 |
| 2010 | 190 | 0.594 | 0.431 – 0.738 | 0.599 |
| 2009 | 189 | 0.559 | 0.411 – 0.688 | 0.551 |
| 2008 | 189 | 0.540 | 0.405 – 0.685 | 0.541 |
| 2007 | 189 | 0.530 | 0.409 – 0.685 | 0.541 |
| 2006 | 189 | 0.522 | 0.404 – 0.685 | 0.528 |
| 2005 | 188 | 0.513 | 0.404 – 0.685 | 0.505 |
| 2004 | 187 | 0.506 | 0.402 – 0.685 | 0.497 |
| 2003 | 187 | 0.506 | 0.396 – 0.685 | 0.497 |
| 2002 | 186 | 0.502 | 0.394 – 0.684 | 0.497 |
| 2001 | 183 | 0.491 | 0.392 – 0.662 | 0.477 |
| 2000 | 182 | 0.490 | 0.392 – 0.640 | 0.468 |
| 1999 | 179 | 0.476 | 0.392 – 0.635 | 0.458 |
| 1998 | 178 | 0.472 | 0.390 – 0.633 | 0.443 |
| 1997 | 178 | 0.454 | 0.384 – 0.617 | 0.428 |
| 1996 | 172 | 0.450 | 0.372 – 0.608 | 0.421 |
| 1995 | 171 | 0.437 | 0.358 – 0.601 | 0.408 |
| 1994 | 168 | 0.422 | 0.355 – 0.562 | 0.392 |
| 1993 | 166 | 0.411 | 0.347 – 0.543 | 0.392 |
| 1992 | 159 | 0.403 | 0.318 – 0.505 | 0.390 |
| 1991 | 148 | 0.392 | 0.308 – 0.477 | 0.380 |
| 1990 | 139 | 0.392 | 0.302 – 0.462 | 0.378 |
| 1989 | 134 | 0.391 | 0.297 – 0.459 | 0.375 |
| 1988 | 133 | 0.389 | 0.277 – 0.450 | 0.371 |
| 1987 | 131 | 0.389 | 0.275 – 0.451 | 0.370 |
| 1986 | 131 | 0.389 | 0.275 – 0.451 | 0.370 |
| 1985 | 131 | 0.389 | 0.275 – 0.451 | 0.370 |
| 1984 | 130 | 0.385 | 0.274 – 0.448 | 0.370 |
| 1983 | 128 | 0.385 | 0.273 – 0.448 | 0.370 |
| 1982 | 118 | 0.375 | 0.271 – 0.434 | 0.370 |
| 1981 | 116 | 0.375 | 0.270 – 0.431 | 0.370 |
| 1980 | 115 | 0.372 | 0.266 – 0.427 | 0.370 |
| 1979 | 112 | 0.372 | 0.265 – 0.425 | 0.370 |
| 1978 | 108 | 0.372 | 0.264 – 0.418 | 0.370 |
| 1977 | 108 | 0.372 | 0.264 – 0.416 | 0.370 |
| 1976 | 108 | 0.371 | 0.262 – 0.416 | 0.366 |
| 1975 | 105 | 0.372 | 0.263 – 0.415 | 0.366 |
| 1974 | 104 | 0.375 | 0.263 – 0.416 | 0.370 |
| 1973 | 102 | 0.373 | 0.263 – 0.416 | 0.370 |
| 1972 | 97 | 0.377 | 0.264 – 0.417 | 0.370 |
| 1971 | 90 | 0.370 | 0.253 – 0.409 | 0.370 |
| 1970 | 89 | 0.370 | 0.251 – 0.409 | 0.370 |
062022 → 2023
Who rose and fell
The biggest changes in value between the two newest editions. Places are shown second, because they also move when other countries do.
Rose most
before → after- South Sudan0.738 → 0.782+0.044
- New Zealand0.359 → 0.399+0.040
 Mauritius0.367 → 0.400+0.033
 Algeria0.400 → 0.431+0.031
191 countries were measured in both 2022 and 2023.
07Across every edition
Central bank independence in records
The extremes of the statistic. A record reached by more than one country names none of them.
Highest reading on record
0.974
CBI index (0–1, where 1 is the most statutory independence)
Lowest reading on record
0.006
CBI index (0–1, where 1 is the most statutory independence)
Biggest rise between editions
+0.634
0.161 → 0.795
Biggest fall between editions
−0.614
0.827 → 0.213
Biggest change since first measured
+0.724
0.072 → 0.796
Highest most often
27 of 54
editions, alone at the first-listed end
08The measure
About central bank independence
The Central Bank Independence Index reads each country’s central bank law and scores how far it shields the bank from the government, from 0 to 1. Coded by Ana Carolina Garriga at the University of Essex on the standard Cukierman–Webb–Neyapti scheme, it covers nearly every country back to 1970.
What the number is: CBI index (0–1, where 1 is the most statutory independence).
What it does not measure
It reads the statute, not the practice: it does not show whether a government actually leans on its central bank, and it makes no judgement on whether more independence is better.
09Where it fits
Connections
Its part in the Country Index, the statistics whose values line up most closely with it across countries, and others on the same subject.
In the Country Index
Context, with no vote
This statistic is published in full under Governance & Institutions and Money & Public Finance, but does not help decide any Country Index standing.
Governance & InstitutionsMoney & Public FinanceWhich statistics vote, and why
Moves with
Where central bank independence is higher, these tend to be higher too.
No statistic lines up this closely.
Moves against
Where central bank independence is higher, these tend to be lower.
- Informal Employment RateILO · 92 countries in commonρ −0.42
Rank correlation (ρ, from −1 to 1) across countries, on each statistic’s newest edition, out of 189 statistics sharing at least 80 countries with this one. Two statistics that move together do not cause each other.
10Keep reading
Explore further
11Questions
Central bank independence: questions and answers
Which country has the highest central bank independence?
Bosnia and Herzegovina, at 0.974, among the 191 countries compared in 2023.
Which country has the lowest central bank independence?
Tuvalu, at 0.006, among the 191 countries compared in 2023.
How many countries does the Central Bank Independence Index cover?
191 in 2023. The number measured varies from 89 to 191 between editions.
What is the world average central bank independence?
This site does not calculate a world average, which would depend on how countries are weighted. In the middle country of the 191 compared in 2023, the figure was 0.608.
Is this Ana Carolina Garriga, University of Essex’s own ranking?
No ranking is shown. Ana Carolina Garriga, University of Essex publishes values only, and too many countries share the same value for an ordering to mean anything, so none is derived.
How often is the Central Bank Independence Index published?
This site holds 54 editions, describing 1970 to 2023.
Where does the data come from, and can I download it?
From Ana Carolina Garriga, University of Essex, under CC0 1.0. From the author’s own Harvard Dataverse deposit. Only her two index columns are republished — the unweighted headline and the weighted variant beside it; the deposit’s merged economic and political series belong to other publishers and are left out. Every edition is on this site’s Datasets pages as a full table, and downloads as a CSV file with every value unrounded.
12Method
Sources, method and citation
Source
Central Bank Independence Index — Ana Carolina Garriga, University of Essex
From the author’s own Harvard Dataverse deposit. Only her two index columns are republished — the unweighted headline and the weighted variant beside it; the deposit’s merged economic and political series belong to other publishers and are left out.
Newest edition
Report year 2023Data year 2023
Cite the source as: Garriga, Ana Carolina (2025). "Revisiting Central Bank Independence in the World: An Extended Dataset." International Studies Quarterly 69(2), sqaf024. https://doi.org/10.1093/isq/sqaf024. Data: Harvard Dataverse, doi:10.7910/DVN/NWUUEY, version 1.0.
Licence: CC0 1.0, checked 2026-09-26.
How this page reads the numbers
- No rank or position is shown: Ana Carolina Garriga, University of Essex publishes values only, and too many countries share the same value for an ordering to mean anything.
- This statistic has no better end, so the page describes higher and lower values and never calls a country a leader.
- A country is named at an end only when it holds that value alone. Where several share it, the page says how many and names none first.
- Values are stored exactly as published and trimmed only for display. “The middle country” is the median of the countries measured, not a world average.
The file itself, column by column — where it came from, what each column holds, and every edition as a CSV — is on its dataset page.
Cite this page
Nations Inquiry (2026). Central bank independence by country: Central Bank Independence Index, data from Ana Carolina Garriga, University of Essex. https://nationsinquiry.com/statistics/central-bank-independence