GGDC · Historical GDP per Capita (Maddison)
Historical GDP per capita by country
How rich was each country, per person, over the last two centuries?
Qatar placed first of the 166 countries compared in 2022, at 149,171, and Central African Republic last, at 596. In the middle country the figure was 12,890. Among the 27 countries measured in every edition since 1820, the middle one moved from 1,441 to 38,269.
Share
Historical GDP per capita · 2022
Context statistic

Highest of 166Qatar
149,171012022 · position · derived
Who leads
The three countries at the highest end of 166 compared, the three at the other end, and the first on each continent.
 1
Photo: Haakon S. Krohn derivative work: JamesA · CC BY-SA 3.0, greyscale
 2
Photo: Ximonic , Simo Räsänen · CC BY-SA 3.0, greyscale
 3
Photo: Khairul Nizam . · CC BY 2.0, greyscale
Lowest in 2022
- 166
 Central African Republic596
- 165
 Burundi717
- 164
 Liberia811
Positions out of 166. Where a country sits says how it compares with the others measured, and nothing about why.
Highest on each continent
- Africa
 Seychelles31,055
- Americas
 United States58,487
- AsiaQatar149,171
- Europe
 Norway88,366
- Oceania
 Australia52,049
2 of 21 measured
- Every region
02Every measured country
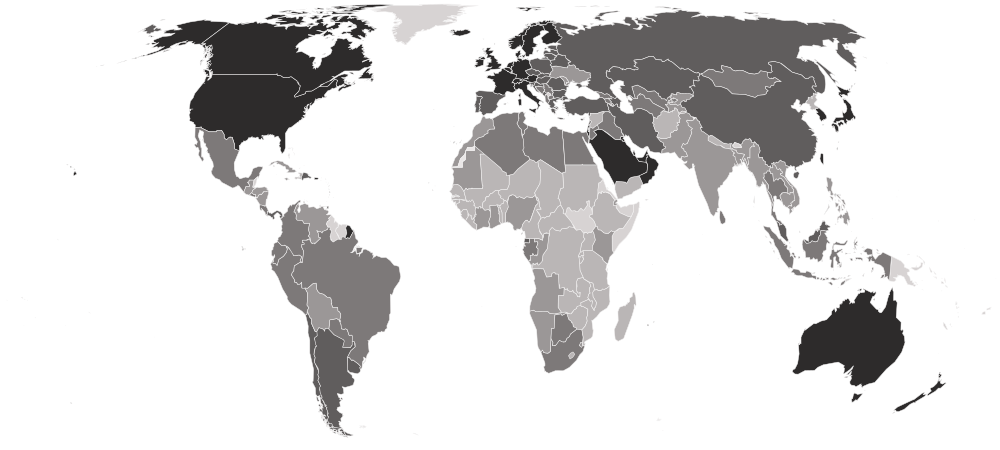
Historical GDP per capita on a map
Each country is shaded by its value, in five groups holding the same number of countries. Hover a country for its value, or select it to open its profile. Below the map, each continent’s middle country.
Darker is a higher value — the better end.
- 596–3,342
- 3,404–8,522
- 8,763–17,235
- 17,683–34,123
- 34,496–149,171
- No reading in 2022
- Europe
32,247
the middle country, of 39 measured · 49 members
Norway88,366 Moldova6,675
Highest and lowest reading in Europe.
- Asia
13,640
the middle country, of 46 measured · 52 members
Qatar149,171 Afghanistan1,358
Highest and lowest reading in Asia.
- Americas
12,154
the middle country, of 28 measured · 48 members
United States58,487 Haiti1,546
Highest and lowest reading in Americas.
- Africa
2,812
the middle country, of 51 measured · 55 members
Seychelles31,055Central African Republic596Highest and lowest reading in Africa.
- Oceania
2 of 21 measured — too few for a middle: Australia, New Zealand.
Australia52,049 New Zealand38,250
Highest and lowest reading in Oceania.
- Every region
19 sub-regions, highest middle country first
- Western Europe
46,648
the middle country, of 7 measured · 9 members
 Switzerland63,323
 France39,066
Highest and lowest reading in Western Europe.
- Northern Europe
41,424
the middle country, of 10 measured · 13 members
Norway88,366 Latvia27,220
Highest and lowest reading in Northern Europe.
- Eastern Asia
38,269
the middle country, of 7 measured · 8 members
 Taiwan53,143
 North Korea1,569
Highest and lowest reading in Eastern Asia.
- Southern Europe
26,135
the middle country, of 12 measured · 17 members
 Italy36,224
 Bosnia and Herzegovina12,143
Highest and lowest reading in Southern Europe.
- Eastern Europe
25,818
the middle country, of 10 measured · 10 members
 Poland32,468Moldova6,675
Highest and lowest reading in Eastern Europe.
- Western Asia
22,522
the middle country, of 18 measured · 19 members
Qatar149,171 Yemen1,959
Highest and lowest reading in Western Asia.
- South America
13,616
the middle country, of 10 measured · 12 members
 Chile22,741
 Venezuela5,267
Highest and lowest reading in South America.
- Central Asia
12,559
the middle country, of 5 measured · 5 members
 Kazakhstan26,492
 Kyrgyzstan5,305
Highest and lowest reading in Central Asia.
- Northern Africa
11,835
the middle country, of 6 measured · 6 members
 Algeria13,506
 Sudan2,405
Highest and lowest reading in Northern Africa.
- Caribbean
10,452
the middle country, of 9 measured · 24 members
 Puerto Rico35,281Haiti1,546
Highest and lowest reading in Caribbean.
- Central America
9,219
the middle country, of 7 measured · 8 members
 Panama23,557
 Nicaragua5,093
Highest and lowest reading in Central America.
- Southern Africa
8,522
the middle country, of 5 measured · 5 members
 Botswana16,352
 Lesotho2,313
Highest and lowest reading in Southern Africa.
- South-eastern Asia
8,371
the middle country, of 9 measured · 11 members
 Singapore80,320
 Cambodia3,944
Highest and lowest reading in South-eastern Asia.
- Southern Asia
5,532
the middle country, of 7 measured · 9 members
 Iran18,473Afghanistan1,358
Highest and lowest reading in Southern Asia.
- Middle Africa
3,752
the middle country, of 9 measured · 9 members
 Equatorial Guinea22,707Central African Republic596
Highest and lowest reading in Middle Africa.
- Eastern Africa
2,198
the middle country, of 15 measured · 19 members
Seychelles31,055Burundi717Highest and lowest reading in Eastern Africa.
- Western Africa
1,910
the middle country, of 16 measured · 16 members
 Cabo Verde7,203Liberia811
Highest and lowest reading in Western Africa.
- Australia and New Zealand
2 of 2 measured — too few for a middle: Australia, New Zealand.
Australia52,049New Zealand38,250Highest and lowest reading in Australia and New Zealand.
- Northern America
2 of 4 measured — too few for a middle: Canada, United States.
United States58,487 Canada45,530
Highest and lowest reading in Northern America.
03The whole field at once
The spread
166 countries, one dot each, on one scale — further right is a higher value. Half the countries are above 12,890; a quarter are above 29,337, and a quarter below 4,376. The bar in each row marks that continent’s middle country.
04All 166 ever measured
Every country
In order, highest value first. “=” marks a position shared with another country. Maddison Project, Groningen Growth and Development Centre (GGDC) ranks nobody on this measure; the position is derived here by ordering the published values. For today's incomes, use the World Bank's GDP per capita, which this site keeps current; this table is for history, and its dollars are on a different price base. Figures before the twentieth century are scholarly estimates built from wages, prices and output records, and they can change a good deal between releases.
Showing 25 of 166 countries


































































































Values for 2022. The change column compares 2022 with 2021 only; the sparkline covers the recent editions.
051820–2022 · 112 reference years
Over time
Each point is one year of the database's 2023 release, which recalculates the whole history at once. Before 1950 fewer countries are covered, and a year appears as a table only when at least fifty countries have an estimate — so a country's early line has gaps where the database has no figure for enough countries.
- the middle country
- the middle half of countries
- the middle of the 27 countries measured every time
- each continent’s middle country
The same, year by year
| Year | Countries | Middle country | Middle half | Measured every time |
|---|---|---|---|---|
| 2022 | 166 | 12,890 | 4,376 – 29,337 | 38,269 |
| 2021 | 166 | 12,406 | 4,314 – 27,906 | 37,678 |
| 2020 | 166 | 11,632 | 4,257 – 26,374 | 35,854 |
| 2019 | 166 | 12,515 | 4,328 – 27,938 | 38,333 |
| 2018 | 166 | 12,044 | 4,153 – 27,536 | 38,404 |
| 2017 | 166 | 12,013 | 3,930 – 26,477 | 38,037 |
| 2016 | 166 | 12,128 | 3,725 – 25,169 | 37,344 |
| 2015 | 166 | 11,929 | 3,654 – 24,604 | 36,987 |
| 2014 | 166 | 11,874 | 3,729 – 24,082 | 36,440 |
| 2013 | 166 | 11,557 | 3,751 – 23,181 | 35,661 |
| 2012 | 166 | 11,101 | 4,071 – 23,711 | 35,244 |
| 2011 | 166 | 11,029 | 3,935 – 22,968 | 34,979 |
| 2010 | 166 | 10,721 | 3,809 – 23,210 | 34,766 |
| 2009 | 166 | 10,262 | 3,698 – 22,434 | 34,055 |
| 2008 | 166 | 10,260 | 3,593 – 24,240 | 35,943 |
| 2007 | 166 | 9,900 | 3,428 – 22,564 | 36,311 |
| 2006 | 166 | 9,246 | 2,990 – 21,489 | 35,714 |
| 2005 | 166 | 8,338 | 2,947 – 20,964 | 34,872 |
| 2004 | 166 | 7,908 | 2,695 – 19,666 | 34,472 |
| 2003 | 166 | 7,405 | 2,464 – 18,466 | 33,918 |
| 2002 | 166 | 7,149 | 2,346 – 17,701 | 33,271 |
| 2001 | 166 | 6,916 | 2,255 – 17,134 | 33,246 |
| 2000 | 166 | 6,691 | 2,213 – 15,004 | 32,690 |
| 1999 | 166 | 6,421 | 2,188 – 14,779 | 30,987 |
| 1998 | 166 | 6,239 | 2,095 – 15,074 | 30,077 |
| 1997 | 166 | 6,042 | 2,113 – 14,851 | 29,260 |
| 1996 | 166 | 5,699 | 2,106 – 13,673 | 28,472 |
| 1995 | 166 | 5,570 | 2,006 – 13,035 | 27,861 |
| 1994 | 166 | 5,421 | 1,953 – 12,615 | 27,278 |
| 1993 | 166 | 5,283 | 1,957 – 12,280 | 26,349 |
| 1992 | 165 | 5,530 | 1,971 – 12,002 | 25,790 |
| 1991 | 165 | 5,616 | 1,983 – 12,012 | 25,792 |
| 1990 | 166 | 5,769 | 2,084 – 12,811 | 26,003 |
| 1989 | 165 | 5,915 | 2,181 – 12,758 | 26,078 |
| 1988 | 165 | 6,089 | 2,227 – 12,720 | 25,112 |
| 1987 | 165 | 6,194 | 2,168 – 12,683 | 24,409 |
| 1986 | 165 | 6,204 | 2,142 – 12,404 | 23,498 |
| 1985 | 165 | 6,268 | 2,128 – 11,848 | 22,579 |
| 1984 | 164 | 6,172 | 2,048 – 11,973 | 21,869 |
| 1983 | 164 | 6,245 | 2,134 – 11,890 | 21,366 |
| 1982 | 164 | 6,436 | 2,097 – 11,565 | 21,123 |
| 1981 | 164 | 6,264 | 1,957 – 12,080 | 20,935 |
| 1980 | 164 | 6,359 | 2,002 – 12,233 | 20,640 |
| 1979 | 150 | 5,414 | 1,804 – 11,860 | 20,275 |
| 1978 | 150 | 5,348 | 1,789 – 11,445 | 19,230 |
| 1977 | 150 | 5,160 | 1,759 – 10,834 | 19,110 |
| 1976 | 150 | 4,907 | 1,725 – 10,812 | 18,600 |
| 1975 | 150 | 4,599 | 1,711 – 9,945 | 18,237 |
| 1974 | 150 | 4,537 | 1,751 – 9,889 | 18,109 |
| 1973 | 164 | 5,236 | 1,883 – 9,983 | 17,908 |
| 1972 | 150 | 4,421 | 1,683 – 9,350 | 17,110 |
| 1971 | 150 | 4,229 | 1,654 – 9,076 | 16,004 |
| 1970 | 150 | 3,967 | 1,583 – 8,592 | 15,492 |
| 1969 | 149 | 3,720 | 1,551 – 8,069 | 14,655 |
| 1968 | 149 | 3,524 | 1,510 – 7,696 | 14,513 |
| 1967 | 149 | 3,489 | 1,470 – 7,382 | 13,476 |
| 1966 | 149 | 3,351 | 1,510 – 7,184 | 12,930 |
| 1965 | 149 | 3,351 | 1,505 – 6,741 | 12,328 |
| 1964 | 149 | 3,158 | 1,486 – 6,591 | 12,062 |
| 1963 | 149 | 2,958 | 1,436 – 6,059 | 11,576 |
| 1962 | 149 | 2,847 | 1,400 – 5,923 | 11,078 |
| 1961 | 149 | 2,868 | 1,321 – 5,461 | 10,882 |
| 1960 | 149 | 2,813 | 1,326 – 5,088 | 10,391 |
| 1959 | 149 | 2,667 | 1,288 – 4,957 | 9,645 |
| 1958 | 149 | 2,576 | 1,270 – 4,844 | 9,416 |
| 1957 | 149 | 2,573 | 1,253 – 4,721 | 9,111 |
| 1956 | 149 | 2,447 | 1,256 – 4,565 | 8,603 |
| 1955 | 149 | 2,364 | 1,195 – 4,313 | 8,348 |
| 1954 | 149 | 2,291 | 1,175 – 4,124 | 8,273 |
| 1953 | 149 | 2,276 | 1,157 – 4,062 | 7,818 |
| 1952 | 149 | 2,193 | 1,121 – 3,937 | 7,450 |
| 1951 | 143 | 2,251 | 1,072 – 3,785 | 7,548 |
| 1950 | 143 | 2,115 | 1,044 – 3,759 | 7,015 |
| 1949 | 60 | 3,319 | 2,348 – 6,910 | 6,604 |
| 1948 | 58 | 3,265 | 2,315 – 6,828 | 6,307 |
| 1947 | 55 | 3,231 | 2,289 – 6,548 | 5,925 |
| 1946 | 54 | 3,121 | 2,351 – 6,528 | 5,918 |
| 1945 | 54 | 2,988 | 1,812 – 5,744 | 5,499 |
| 1944 | 53 | 3,070 | 2,087 – 5,874 | 5,322 |
| 1943 | 56 | 2,901 | 2,064 – 6,124 | 5,893 |
| 1942 | 58 | 2,888 | 2,069 – 6,022 | 5,303 |
| 1941 | 57 | 2,997 | 2,036 – 5,916 | 5,295 |
| 1940 | 58 | 3,034 | 2,055 – 6,042 | 6,311 |
| 1939 | 61 | 2,976 | 2,042 – 5,432 | 6,529 |
| 1938 | 67 | 2,633 | 1,703 – 5,172 | 5,721 |
| 1937 | 64 | 2,837 | 1,888 – 5,044 | 5,485 |
| 1936 | 65 | 2,590 | 1,741 – 4,790 | 5,227 |
| 1935 | 64 | 2,667 | 1,773 – 4,744 | 4,930 |
| 1934 | 64 | 2,473 | 1,719 – 4,619 | 4,763 |
| 1933 | 66 | 2,424 | 1,577 – 4,472 | 4,516 |
| 1932 | 63 | 2,268 | 1,691 – 4,601 | 4,686 |
| 1931 | 65 | 2,397 | 1,669 – 4,737 | 5,241 |
| 1930 | 64 | 2,548 | 1,720 – 5,086 | 5,781 |
| 1929 | 67 | 2,566 | 1,577 – 5,009 | 5,679 |
| 1928 | 62 | 2,530 | 1,683 – 5,225 | 5,609 |
| 1927 | 62 | 2,457 | 1,665 – 4,880 | 5,080 |
| 1926 | 63 | 2,423 | 1,636 – 4,639 | 4,750 |
| 1925 | 61 | 2,455 | 1,708 – 4,733 | 4,903 |
| 1924 | 60 | 2,413 | 1,690 – 4,781 | 4,787 |
| 1923 | 57 | 2,348 | 1,659 – 4,514 | 4,514 |
| 1922 | 55 | 2,405 | 1,721 – 4,578 | 4,570 |
| 1921 | 57 | 2,203 | 1,561 – 4,222 | 4,222 |
| 1920 | 57 | 2,284 | 1,594 – 4,248 | 4,248 |
| 1913 | 72 | 1,858 | 1,283 – 4,133 | 4,836 |
| 1912 | 50 | 2,113 | 1,316 – 5,484 | 4,806 |
| 1911 | 54 | 1,934 | 1,261 – 4,495 | 4,481 |
| 1910 | 54 | 2,278 | 1,354 – 4,496 | 4,485 |
| 1908 | 50 | 2,320 | 1,233 – 4,729 | 4,020 |
| 1907 | 50 | 2,295 | 1,204 – 4,692 | 4,063 |
| 1906 | 51 | 2,276 | 1,154 – 4,261 | 3,822 |
| 1870 | 67 | 1,356 | 962 – 2,161 | 2,340 |
| 1820 | 54 | 967 | 836 – 1,435 | 1,441 |
062021 → 2022
Who rose and fell
The biggest changes in value between the two newest editions — reference years recalculated in one report, not two separate publications. Places are shown second, because they also move when other countries do.
Improved most
before → after- Qatar143,469 → 149,171 · 1st → 1st+5,702
 Kuwait66,418 → 71,534 · 5th → 5th+5,115
 United Arab Emirates72,460 → 77,204 · 4th → 4th+4,744
 Saudi Arabia49,841 → 53,517 · 13th → 10th+3,676
 Ireland57,278 → 60,257 · 8th → 7th+2,979
166 countries were measured in both 2021 and 2022.
07Across every edition
Historical GDP per capita in records
The extremes of the statistic. A record reached by more than one country names none of them.
Highest reading on record
160,051
GDP per capita (2011 international $)
Lowest reading on record
378
GDP per capita (2011 international $)
Biggest improvement between editions
+20,730
134,803 → 155,533
Biggest decline between editions
−16,264
29,157 → 12,893
Most improved since first measured
+100,735
48,436 → 149,171
At the top most often
45 of 112
editions, alone at the first-listed end
08The measure
About Historical GDP per capita
Historical GDP per capita follows each country's output per person back to 1820, in 2011 international dollars, from the Maddison Project Database. It joins economic historians' reconstructions of old national accounts onto modern statistics, so that incomes two centuries apart can be set on one scale.
What the number is: GDP per capita (2011 international $).
09Where it fits
Connections
Its part in the Country Index, the statistics whose values line up most closely with it across countries, and others on the same subject.
In the Country Index
Context, with no vote
This statistic is published in full under Economy & Innovation and Development & Human Capital, but does not help decide any Country Index standing.
Economy & InnovationDevelopment & Human CapitalWhich statistics vote, and why
Moves with
Where Historical GDP per capita is higher, these tend to be higher too.
- GNI per Capita (PPP)World Bank Group · 98 countries in commonρ 0.98
- GDP per Capita (PPP)KeyWorld Bank Group · 157 countries in commonρ 0.98
- GDP per Person EmployedWorld Bank Group · 152 countries in commonρ 0.97
Moves against
Where Historical GDP per capita is higher, these tend to be lower.
- Gender Inequality IndexUNDP Human Development Report Office · 155 countries in commonρ −0.89
- Vulnerable EmploymentKeyILO · 159 countries in commonρ −0.89
- Self-Employment RateILO · 159 countries in commonρ −0.89
Rank correlation (ρ, from −1 to 1) across countries, on each statistic’s newest edition, out of 375 statistics sharing at least 80 countries with this one. Two statistics that move together do not cause each other.
10Keep reading
Explore further
11Questions
Historical GDP per capita: questions and answers
Which country has the highest Historical GDP per capita?
Qatar, at 149,171, among the 166 countries compared in 2022.
Which country has the lowest Historical GDP per capita?
Central African Republic, at 596, among the 166 countries compared in 2022.
How many countries does the Historical GDP per Capita (Maddison) cover?
166 in 2022. The number measured varies from 50 to 166 between editions.
What is the world average Historical GDP per capita?
This site does not calculate a world average, which would depend on how countries are weighted. In the middle country of the 166 compared in 2022, the figure was 12,890.
Is this Maddison Project, Groningen Growth and Development Centre (GGDC)’s own ranking?
No. Maddison Project, Groningen Growth and Development Centre (GGDC) publishes the values but ranks nobody; the position on this page is derived by Nations Inquiry by ordering the published values, and equal values share a position.
How often is the Historical GDP per Capita (Maddison) published?
This site holds 112 reference years, 1820–2022, all recalculated in Maddison Project, Groningen Growth and Development Centre (GGDC)’s 2023 report on one method — not 112 separate publications.
Where does the data come from, and can I download it?
From Maddison Project, Groningen Growth and Development Centre (GGDC), under CC BY 4.0. From the Maddison Project Database 2023, published by the Groningen Growth and Development Centre. Czechoslovakia, the Soviet Union and Yugoslavia are left out because their successor states are included for every year. The database names the historians behind each country's figures on the Sources sheet of its workbook. Every edition is on this site’s Datasets pages as a full table, and downloads as a CSV file with every value unrounded.
12Method
Sources, method and citation
Source
Historical GDP per Capita (Maddison) — Maddison Project, Groningen Growth and Development Centre (GGDC)
From the Maddison Project Database 2023, published by the Groningen Growth and Development Centre. Czechoslovakia, the Soviet Union and Yugoslavia are left out because their successor states are included for every year. The database names the historians behind each country's figures on the Sources sheet of its workbook.
Newest edition
Report year 2022Data year 2022
Cite the source as: Bolt, Jutta and Jan Luiten van Zanden (2024). Maddison style estimates of the evolution of the world economy: A new 2023 update. Journal of Economic Surveys, 1–41. https://doi.org/10.1111/joes.12618 (Maddison Project Database, version 2023).
Licence: CC BY 4.0, checked 2026-09-29.
How this page reads the numbers
- Maddison Project, Groningen Growth and Development Centre (GGDC) ranks nobody on this measure. The position is derived by Nations Inquiry by ordering the published values; equal values share a position.
- Which end is better follows the publisher’s own reading of the measure.
- A country is named at an end only when it holds that value alone. Where several share it, the page says how many and names none first.
- Values are stored exactly as published and trimmed only for display. “The middle country” is the median of the countries measured, not a world average.
The file itself, column by column — where it came from, what each column holds, and every edition as a CSV — is on its dataset page.
Photographs
The countries at the top of this statistic, from their profiles: Wikimedia Commons, shown in greyscale, each used under the licence named.
- Qatar — Haakon S. Krohn derivative work: JamesA, CC BY-SA 3.0
- Norway — Ximonic , Simo Räsänen, CC BY-SA 3.0
- Singapore — Khairul Nizam ., CC BY 2.0
Cite this page
Nations Inquiry (2026). Historical GDP per capita by country: Historical GDP per Capita (Maddison), data from Maddison Project, Groningen Growth and Development Centre (GGDC). https://nationsinquiry.com/statistics/historical-gdp-per-capita