Loading…
FAO · Land Under Cereal Production
Land under cereals by country
How much land is harvested for cereals?
Of the 180 countries compared in 2023, India had the highest reading, 103,715,108, and 2 countries shared the lowest reading, 0. In the middle country the figure was 689,278. Among the 148 countries measured in every edition since 1961, the middle one moved from 527,477 to 799,180.
Land under cereals · 2023
Context statistic
Highest of 180India
103,715,108012023 · position · derived
The highest and the lowest
The three countries with the highest values of 180 compared, the three with the lowest, and the highest on each continent. This statistic has no better end, so no country is shown as leading.
- 1
- 2
- 3
02Every measured country
Land under cereals on a map
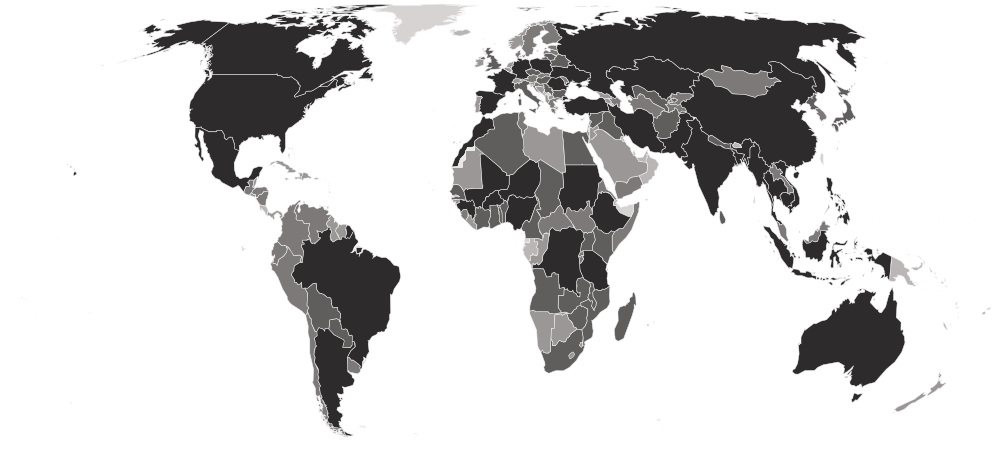
Each country is shaded by its value, in five groups holding the same number of countries. Hover a country for its value, or select it to open its profile. Below the map, each continent’s middle country.
Darker is a higher value. This statistic has no better end, so the shades describe size, not success.
- 0–30,121
- 34,588–339,089
- 344,610–1,234,540
- 1,247,195–3,334,465
- 3,796,091–103,715,108
- No reading in 2023 (2 measured in an earlier edition)
- Africa
1,487,469
the middle country, of 52 measured · 55 members
 Nigeria18,112,703
 Djibouti9
Highest and lowest reading in Africa.
- Europe
822,260
the middle country, of 39 measured · 49 members
 Russia43,171,705
 Malta0
Highest and lowest reading in Europe.
- Asia
800,694
the middle country, of 47 measured · 52 members
India103,715,108 Hong Kong0
Highest and lowest reading in Asia.
- Americas
313,921
the middle country, of 34 measured · 48 members
United States55,537,673 Barbados15
Highest and lowest reading in Americas.
- Oceania
1,896
the middle country, of 8 measured · 21 members
 Australia16,024,469
 Micronesia169
Highest and lowest reading in Oceania.
- Every region
21 sub-regions, highest middle country first
- South-eastern Asia
5,610,166
the middle country, of 10 measured · 11 members
 Indonesia12,689,796
 Brunei1,500
Highest and lowest reading in South-eastern Asia.
- Southern Asia
3,334,346
the middle country, of 9 measured · 9 members
India103,715,108 Maldives84
Highest and lowest reading in Southern Asia.
- Northern Africa
2,852,392
the middle country, of 6 measured · 6 members
 Sudan9,149,071
 Libya309,380
Highest and lowest reading in Northern Africa.
- Eastern Europe
2,193,020
the middle country, of 10 measured · 10 members
Russia43,171,705 Slovakia694,170
Highest and lowest reading in Eastern Europe.
- Western Africa
1,677,037
the middle country, of 16 measured · 16 members
Nigeria18,112,703 Cabo Verde20,190
Highest and lowest reading in Western Africa.
- Eastern Africa
1,561,098
the middle country, of 17 measured · 19 members
 Ethiopia11,859,459Djibouti9
Highest and lowest reading in Eastern Africa.
- Middle Africa
1,257,177
the middle country, of 8 measured · 9 members
 DR Congo4,874,167
 São Tomé and Príncipe393
Highest and lowest reading in Middle Africa.
- Eastern Asia
1,064,453
the middle country, of 6 measured · 8 members
China99,987,255Hong Kong0Highest and lowest reading in Eastern Asia.
- South America
982,527
the middle country, of 12 measured · 12 members
 Brazil29,209,839
 Suriname49,813
Highest and lowest reading in South America.
- Northern Europe
835,815
the middle country, of 10 measured · 13 members
 United Kingdom3,088,787
 Iceland3,160
Highest and lowest reading in Northern Europe.
- Central Asia
800,694
the middle country, of 5 measured · 5 members
 Kazakhstan16,277,911
 Tajikistan373,837
Highest and lowest reading in Central Asia.
- Central America
333,851
the middle country, of 8 measured · 8 members
 Mexico8,684,694
 Costa Rica18,758
Highest and lowest reading in Central America.
- Western Europe
324,650
the middle country, of 7 measured · 9 members
 France8,831,520
 Luxembourg26,730
Highest and lowest reading in Western Europe.
- Southern Europe
190,482
the middle country, of 12 measured · 17 members
 Spain5,444,490Malta0
Highest and lowest reading in Southern Europe.
- Southern Africa
177,933
the middle country, of 5 measured · 5 members
 South Africa3,334,465
 Eswatini71,001
Highest and lowest reading in Southern Africa.
- Western Asia
91,082
the middle country, of 17 measured · 19 members
 Türkiye11,531,027
 Qatar121
Highest and lowest reading in Western Asia.
- Melanesia
1,555
the middle country, of 5 measured · 5 members
 Papua New Guinea3,910
 New Caledonia298
Highest and lowest reading in Melanesia.
- Caribbean
742
the middle country, of 12 measured · 24 members
 Haiti310,565Barbados15
Highest and lowest reading in Caribbean.
- Australia and New Zealand
2 of 2 measured — too few for a middle: Australia, New Zealand.
Australia16,024,469 New Zealand116,285
Highest and lowest reading in Australia and New Zealand.
- Micronesia
1 of 7 measured — too few for a middle: Micronesia.
Micronesia169Highest and lowest reading in Micronesia.
- Northern America
2 of 4 measured — too few for a middle: Canada, United States.
United States55,537,673 Canada16,033,993
Highest and lowest reading in Northern America.
03The whole field at once
The spread
180 countries, one dot each, on one scale — further right is a higher value. Half the countries are above 689,278; a quarter are above 2,922,763, and a quarter below 102,323. The bar in each row marks that continent’s middle country.
04All 182 ever measured
Every country
In order, highest value first. “=” marks a position shared with another country. Food and Agriculture Organization of the United Nations (FAO) ranks nobody on this measure; the position is derived here by ordering the published values. Neither end of this table is the good end — it is largely a ranking of how big a country is. Read it beside cereal yield, which is what separates farming better from simply farming more land. A zero is real: some countries harvest no cereals at all.
Showing 25 of 182 countries



























































Values for 2023. The change column compares 2023 with 2022 only; the sparkline covers the recent editions.
051961–2023 · 63 reference years
Over time
Each point is one year from 1961. Because this is harvested rather than planted area, a drought or a failed harvest shows up as land disappearing.
- the middle country
- the middle half of countries
- the middle of the 148 countries measured every time
- each continent’s middle country
The same, year by year
| Year | Countries | Middle country | Middle half | Measured every time |
|---|---|---|---|---|
| 2023 | 180 | 689,278 | 102,323 – 2,922,763 | 799,180 |
| 2022 | 180 | 764,115 | 111,392 – 2,632,655 | 792,818 |
| 2021 | 180 | 735,357 | 106,270 – 2,445,175 | 784,147 |
| 2020 | 181 | 705,762 | 69,699 – 2,904,822 | 752,390 |
| 2019 | 181 | 672,084 | 68,862 – 2,863,448 | 752,270 |
| 2018 | 181 | 687,800 | 98,330 – 2,592,349 | 804,051 |
| 2017 | 181 | 705,092 | 73,297 – 2,419,213 | 835,134 |
| 2016 | 180 | 729,973 | 90,225 – 2,786,288 | 858,987 |
| 2015 | 180 | 742,984 | 104,400 – 2,585,150 | 872,940 |
| 2014 | 179 | 811,771 | 126,833 – 2,743,413 | 899,447 |
| 2013 | 179 | 856,324 | 118,044 – 2,773,751 | 926,710 |
| 2012 | 179 | 854,689 | 122,401 – 2,777,742 | 906,201 |
| 2011 | 178 | 804,045 | 138,871 – 2,665,015 | 869,875 |
| 2010 | 178 | 753,955 | 134,794 – 2,693,858 | 880,162 |
| 2009 | 178 | 795,768 | 131,220 – 2,588,408 | 856,436 |
| 2008 | 178 | 720,493 | 123,367 – 2,403,482 | 814,491 |
| 2007 | 178 | 702,145 | 105,175 – 2,472,679 | 799,010 |
| 2006 | 178 | 740,042 | 113,153 – 2,617,721 | 796,979 |
| 2005 | 176 | 711,097 | 113,856 – 2,469,074 | 782,229 |
| 2004 | 176 | 696,208 | 113,740 – 2,248,449 | 746,040 |
| 2003 | 176 | 691,217 | 115,068 – 2,163,483 | 737,620 |
| 2002 | 176 | 648,310 | 107,042 – 2,168,306 | 706,699 |
| 2001 | 176 | 666,358 | 120,965 – 2,094,647 | 725,219 |
| 2000 | 176 | 630,148 | 120,259 – 2,010,109 | 708,916 |
| 1999 | 174 | 651,370 | 119,383 – 2,116,258 | 689,381 |
| 1998 | 174 | 661,232 | 111,165 – 2,100,500 | 691,258 |
| 1997 | 174 | 679,681 | 126,750 – 2,043,295 | 706,297 |
| 1996 | 174 | 656,909 | 114,890 – 2,169,738 | 700,910 |
| 1995 | 174 | 640,617 | 105,831 – 2,522,760 | 675,777 |
| 1994 | 174 | 675,903 | 104,447 – 2,411,482 | 747,240 |
| 1993 | 173 | 702,734 | 104,256 – 2,424,140 | 733,825 |
| 1992 | 170 | 670,034 | 103,706 – 2,446,424 | 712,169 |
| 1991 | 151 | 665,691 | 94,135 – 2,441,714 | 695,305 |
| 1990 | 150 | 693,809 | 93,153 – 2,420,521 | 709,573 |
| 1989 | 150 | 712,725 | 93,460 – 2,293,779 | 748,072 |
| 1988 | 150 | 712,293 | 96,491 – 2,319,050 | 753,226 |
| 1987 | 150 | 694,701 | 103,854 – 2,364,301 | 716,308 |
| 1986 | 150 | 668,569 | 93,019 – 2,553,993 | 677,163 |
| 1985 | 150 | 677,887 | 102,895 – 2,384,275 | 686,650 |
| 1984 | 150 | 627,740 | 99,553 – 2,028,454 | 650,012 |
| 1983 | 150 | 590,554 | 83,115 – 2,200,364 | 615,384 |
| 1982 | 150 | 570,091 | 102,023 – 2,133,205 | 619,147 |
| 1981 | 150 | 628,513 | 117,593 – 2,243,074 | 684,233 |
| 1980 | 150 | 601,555 | 111,174 – 2,201,751 | 633,875 |
| 1979 | 150 | 619,472 | 95,350 – 2,148,707 | 626,652 |
| 1978 | 150 | 614,735 | 116,775 – 2,210,125 | 633,860 |
| 1977 | 150 | 651,452 | 109,775 – 2,177,213 | 699,552 |
| 1976 | 150 | 666,668 | 99,714 – 2,179,139 | 719,988 |
| 1975 | 150 | 658,311 | 118,521 – 2,127,201 | 678,115 |
| 1974 | 150 | 612,331 | 105,243 – 2,112,179 | 635,338 |
| 1973 | 150 | 564,915 | 94,894 – 1,965,537 | 625,137 |
| 1972 | 150 | 635,952 | 85,764 – 2,023,193 | 651,835 |
| 1971 | 150 | 664,885 | 96,623 – 1,984,615 | 685,385 |
| 1970 | 150 | 655,847 | 112,429 – 2,141,524 | 682,793 |
| 1969 | 150 | 639,241 | 113,901 – 2,116,895 | 663,978 |
| 1968 | 150 | 619,785 | 109,103 – 2,017,868 | 642,171 |
| 1967 | 150 | 601,448 | 110,951 – 2,194,006 | 618,183 |
| 1966 | 150 | 587,992 | 98,984 – 1,947,989 | 592,942 |
| 1965 | 149 | 570,859 | 103,000 – 2,027,871 | 580,556 |
| 1964 | 149 | 564,713 | 99,450 – 2,179,046 | 569,297 |
| 1963 | 149 | 562,184 | 88,450 – 2,042,662 | 572,321 |
| 1962 | 149 | 567,973 | 100,060 – 2,112,667 | 568,035 |
| 1961 | 149 | 523,153 | 103,000 – 2,039,339 | 527,477 |
062022 → 2023
Who rose and fell
The biggest changes in value between the two newest editions — reference years recalculated in one report, not two separate publications. Places are shown second, because they also move when other countries do.
Rose most
before → after- United States50,695,695 → 55,537,673 · 3rd → 3rd+4,841,978
- India99,261,351 → 103,715,108 · 1st → 1st+4,453,757
- Brazil27,660,556 → 29,209,839 · 5th → 5th+1,549,283
 Mozambique2,435,693 → 3,333,705 · 47th → 39th+898,012
- China99,216,912 → 99,987,255 · 2nd → 2nd+770,343
180 countries were measured in both 2022 and 2023.
07Across every edition
Land under cereals in records
The extremes of the statistic. A record reached by more than one country names none of them.
Highest reading on record
106,613,208
Land under cereal production (hectares)
Lowest reading on record
Reached 80 times by 8 countries — shared, so no holder is named
0
Land under cereal production (hectares)
Biggest rise between editions
+13,227,870
58,729,146 → 71,957,016
Biggest fall between editions
−17,485,641
76,214,787 → 58,729,146
Biggest change since first measured
+18,041,198
11,168,641 → 29,209,839
Highest most often
57 of 63
editions, alone at the first-listed end
08The measure
About land under cereals
This is how much land a country harvests cereals from, in hectares. Cereals — wheat, rice, maize, barley — supply most of the world's calories, so the area given over to them is one of the basic facts about a country's agriculture.
What the number is: Land under cereal production (hectares).
09Where it fits
Connections
Its part in the Country Index, the statistics whose values line up most closely with it across countries, and others on the same subject.
In the Country Index
Context, with no vote
This statistic is published in full under Environment & Sustainability and Food & Agriculture, but does not help decide any Country Index standing.
Environment & SustainabilityFood & AgricultureWhich statistics vote, and why
Moves with
Where land under cereals is higher, these tend to be higher too.
- Total PopulationUN DESA Population Division · 180 countries in commonρ 0.86
- Agricultural EmissionsFAO · 177 countries in commonρ 0.86
- Land AreaFAO · 179 countries in commonρ 0.77
Moves against
Where land under cereals is higher, these tend to be lower.
- Cereal Import Dependency RatioFAO · 159 countries in commonρ −0.74
- Outbound Mobility Ratio, TertiaryUIS · 104 countries in commonρ −0.54
- Political Stability and Absence of ViolenceKeyWorld Bank Group · 180 countries in commonρ −0.51
Rank correlation (ρ, from −1 to 1) across countries, on each statistic’s newest edition, out of 188 statistics sharing at least 80 countries with this one. Two statistics that move together do not cause each other.
10Keep reading
Explore further
11Questions
Land under cereals: questions and answers
Which country has the highest land under cereals?
India, at 103,715,108, among the 180 countries compared in 2023.
Which country has the lowest land under cereals?
2 countries share the lowest reading, 0, among the 180 compared in 2023, so no single country is named.
How many countries does the Land Under Cereal Production cover?
180 in 2023, and 182 at least once across all editions. The number measured varies from 149 to 181 between editions.
What is the world average land under cereals?
This site does not calculate a world average, which would depend on how countries are weighted. In the middle country of the 180 compared in 2023, the figure was 689,278.
Is this Food and Agriculture Organization of the United Nations (FAO)’s own ranking?
No. Food and Agriculture Organization of the United Nations (FAO) publishes the values but ranks nobody; the position on this page is derived by Nations Inquiry by ordering the published values, and equal values share a position.
How often is the Land Under Cereal Production published?
This site holds 63 reference years, 1961–2023, all recalculated in Food and Agriculture Organization of the United Nations (FAO)’s 2026 report on one method — not 63 separate publications.
Where does the data come from, and can I download it?
From Food and Agriculture Organization of the United Nations (FAO), under CC BY 4.0. From FAOSTAT, served through the World Bank's indicator API (AG.LND.CREL.HA). FAOSTAT publishes harvested area in whole hectares. Every edition is on this site’s Datasets pages as a full table, and downloads as a CSV file with every value unrounded.
12Method
Sources, method and citation
Source
Land Under Cereal Production — Food and Agriculture Organization of the United Nations (FAO)
From FAOSTAT, served through the World Bank's indicator API (AG.LND.CREL.HA). FAOSTAT publishes harvested area in whole hectares.
Newest edition
Report year 2023Data year 2023
Cite the source as: FAO. FAOSTAT. Rome: Food and Agriculture Organization of the United Nations.
Licence: CC BY 4.0, checked 2026-09-10.
How this page reads the numbers
- Food and Agriculture Organization of the United Nations (FAO) ranks nobody on this measure. The position is derived by Nations Inquiry by ordering the published values; equal values share a position.
- This statistic has no better end, so the page describes higher and lower values and never calls a country a leader.
- A country is named at an end only when it holds that value alone. Where several share it, the page says how many and names none first.
- Values are stored exactly as published and trimmed only for display. “The middle country” is the median of the countries measured, not a world average.
The file itself, column by column — where it came from, what each column holds, and every edition as a CSV — is on its dataset page.
Cite this page
Nations Inquiry (2026). Land under cereals by country: Land Under Cereal Production, data from Food and Agriculture Organization of the United Nations (FAO). https://nationsinquiry.com/statistics/land-under-cereals