UNCTAD · Merchant Fleet by Country of Ownership
Merchant fleet ownership by country
How much of the world's merchant shipping is owned by companies based in each country?
Of the 178 countries compared in 2026, Greece had the highest reading, 397,071.457, and 11 countries shared the lowest reading, 0.000. In the middle country the figure was 275.734. Among the 178 countries measured in every edition since 2014, the middle one moved from 186.904 to 275.734.
Share
Merchant fleet ownership · 2026
Context statistic

Highest of 178Greece
397,071.457012026 · values only
The highest and the lowest
The three countries with the highest values of 178 compared, the three with the lowest, and the highest on each continent. This statistic has no better end, so no country is shown as leading.
- 1
- 2

- 3

Lowest in 2026
 São Tomé and Príncipe0.000
 Somalia0.000
 Solomon Islands0.000
This statistic has no better end: the two ends describe size, not success.
02Every measured country
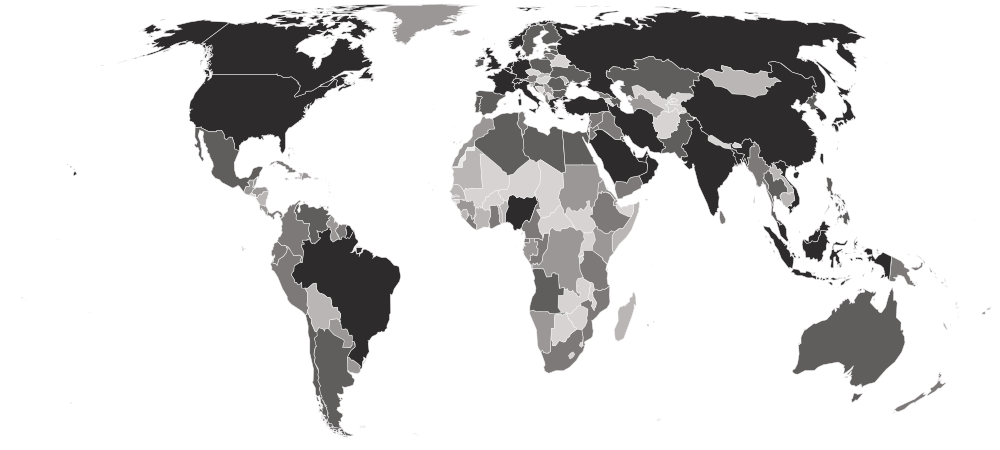
Merchant fleet ownership on a map
Each country is shaded by its value, in five groups holding the same number of countries. Hover a country for its value, or select it to open its profile. Below the map, each continent’s middle country.
Darker is a higher value. This statistic has no better end, so the shades describe size, not success.
- 0.000–11.299
- 11.961–83.109
- 86.327–955.415
- 968.485–5,805.436
- 5,975.481–397,071.457
- No reading in 2026
- Asia
5,400.262
the middle country, of 43 measured · 52 members
China377,047.2352 share 0.000
Highest and lowest reading in Asia.
- Europe
2,368.736
the middle country, of 38 measured · 49 members
Greece397,071.457 Moldova0.000
Highest and lowest reading in Europe.
- Americas
57.349
the middle country, of 42 measured · 48 members
 United States45,644.581
2 share 0.000
Highest and lowest reading in Americas.
- Africa
57.138
the middle country, of 37 measured · 55 members
 Nigeria10,129.782
4 share 0.000
Highest and lowest reading in Africa.
- Oceania
4.694
the middle country, of 18 measured · 21 members
 Australia4,293.242
2 share 0.000
Highest and lowest reading in Oceania.
- Every region
22 sub-regions, highest middle country first
- Eastern Asia
82,693.576
the middle country, of 8 measured · 8 members
China377,047.235 Mongolia0.000
Highest and lowest reading in Eastern Asia.
- Western Europe
26,607.546
the middle country, of 9 measured · 9 members
 Germany69,050.556
 Liechtenstein28.095
Highest and lowest reading in Western Europe.
- South-eastern Asia
5,452.058
the middle country, of 11 measured · 11 members
 Singapore182,417.467
 Laos0.000
Highest and lowest reading in South-eastern Asia.
- Western Asia
4,201.987
the middle country, of 16 measured · 19 members
 United Arab Emirates59,608.484
 Bahrain86.327
Highest and lowest reading in Western Asia.
- Southern Asia
3,640.143
the middle country, of 6 measured · 9 members
 India28,829.990
 Maldives180.640
Highest and lowest reading in Southern Asia.
- Northern Europe
2,347.858
the middle country, of 11 measured · 13 members
 United Kingdom61,058.864
 Iceland78.686
Highest and lowest reading in Northern Europe.
- Eastern Europe
1,844.841
the middle country, of 7 measured · 10 members
 Russia17,467.738Moldova0.000
Highest and lowest reading in Eastern Europe.
- Southern Europe
1,205.922
the middle country, of 11 measured · 17 members
Greece397,071.457 Serbia46.790
Highest and lowest reading in Southern Europe.
- Northern Africa
708.037
the middle country, of 6 measured · 6 members
 Egypt4,575.584
 Sudan24.459
Highest and lowest reading in Northern Africa.
- South America
698.087
the middle country, of 12 measured · 12 members
 Brazil15,333.338
 Bolivia1.741
Highest and lowest reading in South America.
- Middle Africa
333.508
the middle country, of 7 measured · 9 members
 Angola4,821.910São Tomé and Príncipe0.000
Highest and lowest reading in Middle Africa.
- Eastern Africa
69.054
the middle country, of 10 measured · 19 members
 Seychelles1,276.044
2 share 0.000
Highest and lowest reading in Eastern Africa.
- Central America
53.056
the middle country, of 7 measured · 8 members
 Mexico1,858.126
 Nicaragua2.174
Highest and lowest reading in Central America.
- Caribbean
11.961
the middle country, of 19 measured · 24 members
 Bahamas1,048.691
2 share 0.000
Highest and lowest reading in Caribbean.
- Western Africa
8.989
the middle country, of 12 measured · 16 members
Nigeria10,129.782 Mauritania0.000
Highest and lowest reading in Western Africa.
- Polynesia
5.975
the middle country, of 5 measured · 7 members
 Samoa42.589
 Tonga0.538
Highest and lowest reading in Polynesia.
- Melanesia
3.413
the middle country, of 5 measured · 5 members
 Papua New Guinea143.347Solomon Islands0.000
Highest and lowest reading in Melanesia.
- Micronesia
2.499
the middle country, of 6 measured · 7 members
 Marshall Islands1,685.380
 Guam0.000
Highest and lowest reading in Micronesia.
- Australia and New Zealand
2 of 2 measured — too few for a middle: Australia, New Zealand.
Australia4,293.242 New Zealand157.042
Highest and lowest reading in Australia and New Zealand.
- Central Asia
2 of 5 measured — too few for a middle: Kazakhstan, Turkmenistan.
 Kazakhstan1,249.175
 Turkmenistan83.109
Highest and lowest reading in Central Asia.
- Northern America
4 of 4 measured — too few for a middle: Bermuda, Canada, Greenland, United States.
United States45,644.581 Greenland58.091
Highest and lowest reading in Northern America.
- Southern Africa
2 of 5 measured — too few for a middle: Namibia, South Africa.
 South Africa543.344
 Namibia57.138
Highest and lowest reading in Southern Africa.
03The whole field at once
The spread
178 countries, one dot each, on one scale — further right is a higher value. Half the countries are above 275.734; a quarter are above 3,886.346, and a quarter below 17.028. The bar in each row marks that continent’s middle country.
04All 178 ever measured
Every country
In order, highest value first. No rank or position is shown: too many countries share the same value for an order to mean anything. Neither end is better. This is a size measure: the top is the great shipowning nations and the bottom countries whose companies own no ocean-going ships at all, which is a real zero rather than a gap.
Showing 25 of 178 countries




































































































Values for 2026. The change column compares 2026 with 2025 only; the sparkline covers the recent editions.
052014–2026 · 13 reference years
Over time
Each point is the fleet on 1 January of the year, from 2014. A rising line means companies in that country bought or built more carrying capacity than they sold or scrapped.
- the middle country
- the middle half of countries
- the middle of the 178 countries measured every time
- each continent’s middle country
The same, year by year
| Year | Countries | Middle country | Middle half | Measured every time |
|---|---|---|---|---|
| 2026 | 178 | 275.734 | 17.028 – 3,886.346 | 275.734 |
| 2025 | 178 | 263.634 | 21.850 – 3,872.883 | 263.634 |
| 2024 | 178 | 263.634 | 13.851 – 3,761.582 | 263.634 |
| 2023 | 178 | 278.506 | 16.570 – 3,107.475 | 278.506 |
| 2022 | 178 | 270.958 | 13.135 – 2,744.779 | 270.958 |
| 2021 | 178 | 218.966 | 10.883 – 2,817.547 | 218.966 |
| 2020 | 178 | 210.866 | 9.529 – 2,828.023 | 210.866 |
| 2019 | 178 | 177.563 | 9.143 – 2,691.011 | 177.563 |
| 2018 | 178 | 161.033 | 7.376 – 2,692.810 | 161.033 |
| 2017 | 178 | 151.564 | 5.752 – 2,664.526 | 151.564 |
| 2016 | 178 | 174.740 | 3.675 – 2,438.020 | 174.740 |
| 2015 | 178 | 165.596 | 4.388 – 2,556.523 | 165.596 |
| 2014 | 178 | 186.904 | 6.251 – 2,491.467 | 186.904 |
062025 → 2026
Who rose and fell
The biggest changes in value between the two newest editions — reference years recalculated in one report, not two separate publications. Places are shown second, because they also move when other countries do.
Rose most
before → after- China350,069.407 → 377,047.235+26,977.828
 Belgium18,701.058 → 31,496.507+12,795.449
 Switzerland50,154.031 → 58,236.879+8,082.848
- Singapore175,515.264 → 182,417.467+6,902.203
- Japan239,761.811 → 243,174.558+3,412.747
178 countries were measured in both 2025 and 2026.
07Across every edition
Merchant fleet ownership in records
The extremes of the statistic. A record reached by more than one country names none of them.
Highest reading on record
398,702.274
Merchant fleet owned (thousand dead-weight tons)
Lowest reading on record
Reached 196 times by 26 countries — shared, so no holder is named
0.000
Merchant fleet owned (thousand dead-weight tons)
UNCTAD · 2014, 2015, 2016, 2017, 2018, 2019, 2020, 2021, 2022, 2023, 2024, 2025, 2026
Biggest rise between editions
+33,056.919
275,673.849 → 308,730.768
Biggest fall between editions
−15,424.545
53,602.547 → 38,178.002
Biggest change since first measured
+223,944.432
153,102.803 → 377,047.235
Highest most often
13 of 13
editions, alone at the first-listed end
08The measure
About merchant fleet ownership
This counts the merchant ships owned by companies based in each country — measured by how much cargo they can carry, in dead-weight tons — wherever those ships are registered. Ownership and flag are different things: most of the world's tonnage flies the flags of a few open registries, but it is owned from a handful of shipping nations.
What the number is: Merchant fleet owned (thousand dead-weight tons).
09Where it fits
Connections
Its part in the Country Index, the statistics whose values line up most closely with it across countries, and others on the same subject.
In the Country Index
Context, with no vote
This statistic is published in full under Economy & Innovation and Mobility & Trade, but does not help decide any Country Index standing.
Economy & InnovationMobility & TradeWhich statistics vote, and why
Moves with
Where merchant fleet ownership is higher, these tend to be higher too.
- Consumption-Based CO₂ EmissionsGlobal Carbon Project · 105 countries in commonρ 0.73
- Scholarly ArticlesOurResearch · 175 countries in commonρ 0.71
- GitHub DevelopersGitHub · 176 countries in commonρ 0.69
Moves against
Where merchant fleet ownership is higher, these tend to be lower.
- Net Official Development Assistance ReceivedOECD Development Assistance Committee · 100 countries in commonρ −0.63
- Prevalence of Moderate or Severe Food InsecurityFAO · 110 countries in commonρ −0.56
- Firms Competing Against Informal FirmsWorld Bank Group · 140 countries in commonρ −0.56
Rank correlation (ρ, from −1 to 1) across countries, on each statistic’s newest edition, out of 359 statistics sharing at least 80 countries with this one. Two statistics that move together do not cause each other.
10Keep reading
Explore further
The subject
The countries at either end
11Questions
Merchant fleet ownership: questions and answers
Which country has the highest merchant fleet ownership?
Greece, at 397,071.457, among the 178 countries compared in 2026.
Which country has the lowest merchant fleet ownership?
11 countries share the lowest reading, 0.000, among the 178 compared in 2026, so no single country is named.
How many countries does the Merchant Fleet by Country of Ownership cover?
178 in 2026.
What is the world average merchant fleet ownership?
This site does not calculate a world average, which would depend on how countries are weighted. In the middle country of the 178 compared in 2026, the figure was 275.734.
Is this UN Trade and Development (UNCTAD)’s own ranking?
No ranking is shown. UN Trade and Development (UNCTAD) publishes values only, and too many countries share the same value for an ordering to mean anything, so none is derived.
How often is the Merchant Fleet by Country of Ownership published?
This site holds 13 reference years, 2014–2026, all recalculated in UN Trade and Development (UNCTAD)’s 2026 report on one method — not 13 separate publications.
Where does the data come from, and can I download it?
From UN Trade and Development (UNCTAD), under CC BY 3.0 IGO. Read from UNCTAD's own US.FleetBeneficialOwners bulk file on UNCTADstat, compiled by UNCTAD from Clarksons Research vessel data: every flag of registration together, by the owner's economy. UNCTAD's regional totals and the tonnage whose owner is unknown are left out; the share of the world fleet and the number of ships are kept beside it. Every edition is on this site’s Datasets pages as a full table, and downloads as a CSV file with every value unrounded.
12Method
Sources, method and citation
Source
Merchant Fleet by Country of Ownership — UN Trade and Development (UNCTAD)
Read from UNCTAD's own US.FleetBeneficialOwners bulk file on UNCTADstat, compiled by UNCTAD from Clarksons Research vessel data: every flag of registration together, by the owner's economy. UNCTAD's regional totals and the tonnage whose owner is unknown are left out; the share of the world fleet and the number of ships are kept beside it.
Newest edition
Report year 2026Data year 2026
Cite the source as: UN Trade and Development (UNCTAD), based on Clarksons Research. Merchant fleet: world fleet by beneficial ownership, annual. Geneva: UNCTAD Data Hub.
Licence: CC BY 3.0 IGO, checked 2026-09-29.
How this page reads the numbers
- No rank or position is shown: UN Trade and Development (UNCTAD) publishes values only, and too many countries share the same value for an ordering to mean anything.
- This statistic has no better end, so the page describes higher and lower values and never calls a country a leader.
- A country is named at an end only when it holds that value alone. Where several share it, the page says how many and names none first.
- Values are stored exactly as published and trimmed only for display. “The middle country” is the median of the countries measured, not a world average.
The file itself, column by column — where it came from, what each column holds, and every edition as a CSV — is on its dataset page.
Cite this page
Nations Inquiry (2026). Merchant fleet ownership by country: Merchant Fleet by Country of Ownership, data from UN Trade and Development (UNCTAD). https://nationsinquiry.com/statistics/merchant-fleet-ownership