Institute for International Law of Peace and Armed Conflict (IFHV), Ruhr University Bochum · World Risk Index
World Risk Index by country
How exposed and vulnerable is a country to natural disasters?
Of the 193 countries compared in 2025, Monaco had the lowest reading, 0.18, and Philippines had the highest reading, 46.56. In the middle country the figure was 4.17. Among the 193 countries measured in every edition since 2000, the middle one moved from 4.55 to 4.17.
World Risk Index · 2025
Key statistic · Risk & Resilience
Lowest of 193Monaco
0.18012025 · position · derived
Who leads
The three countries at the lowest end of 193 compared, the three at the other end, and the first on each continent.
 1
1Photo: Martin Weber derivative work: Jjtkk · CC BY-SA 3.0, greyscale
 2
2Photo: Tiia Monto derivative work: Jjtkk · CC BY-SA 3.0, greyscale
 3
3Photo: Matl derivative work: Jjtkk · CC BY-SA 3.0, greyscale
Highest in 2025
 Philippines46.56
 India40.73
 Indonesia39.80
Where a country sits says how it compares with the others measured, and nothing about why.
02Every measured country
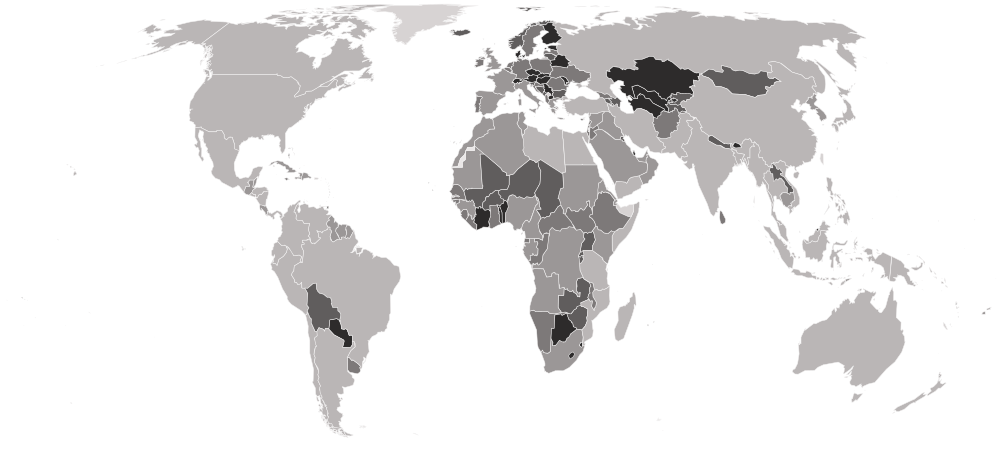
World Risk Index on a map
Each country is shaded by its value, in five groups holding the same number of countries. Hover a country for its value, or select it to open its profile. Below the map, each continent’s middle country.
Darker is a lower value — the better end.
- 13.80–46.56
- 5.97–13.72
- 3.15–5.91
- 1.91–3.13
- 0.18–1.88
- No reading in 2025
- Europe
2.34
the middle country, of 43 measured · 49 members
Monaco0.18 Russia31.22
Lowest and highest reading in Europe.
- Oceania
3.92
the middle country, of 14 measured · 21 members
 Nauru0.88
 Papua New Guinea26.51
Lowest and highest reading in Oceania.
- Africa
4.23
the middle country, of 54 measured · 55 members
 São Tomé and Príncipe0.61
 Mozambique34.39
Lowest and highest reading in Africa.
- Asia
4.87
the middle country, of 47 measured · 52 members
 Singapore0.67Philippines46.56
Lowest and highest reading in Asia.
- Americas
10.06
the middle country, of 35 measured · 48 members
 Paraguay1.88
 Colombia39.26
Lowest and highest reading in Americas.
- Every region
22 sub-regions, lowest middle country first
- Western Europe
1.31
the middle country, of 9 measured · 9 members
Monaco0.18 France7.75
Lowest and highest reading in Western Europe.
- Central Asia
1.73
the middle country, of 5 measured · 5 members
 Turkmenistan1.27
 Tajikistan2.90
Lowest and highest reading in Central Asia.
- Eastern Europe
1.76
the middle country, of 10 measured · 10 members
 Belarus0.72Russia31.22
Lowest and highest reading in Eastern Europe.
- Southern Africa
1.76
the middle country, of 5 measured · 5 members
 Botswana1.25
 South Africa9.50
Lowest and highest reading in Southern Africa.
- Micronesia
2.52
the middle country, of 5 measured · 7 members
Nauru0.88 Micronesia4.17
Lowest and highest reading in Micronesia.
- Northern Europe
2.65
the middle country, of 10 measured · 13 members
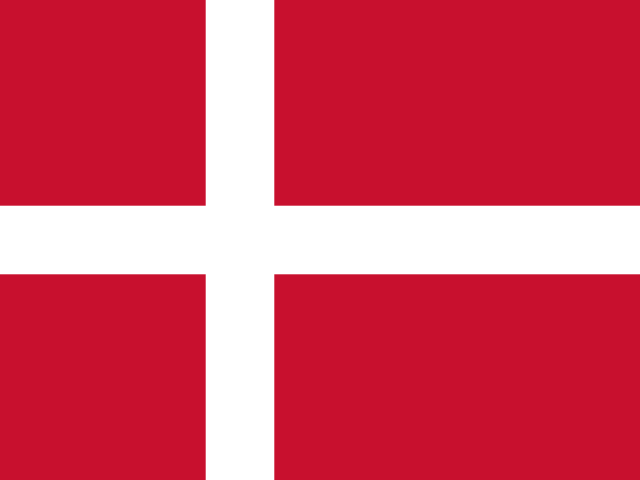 Denmark1.07
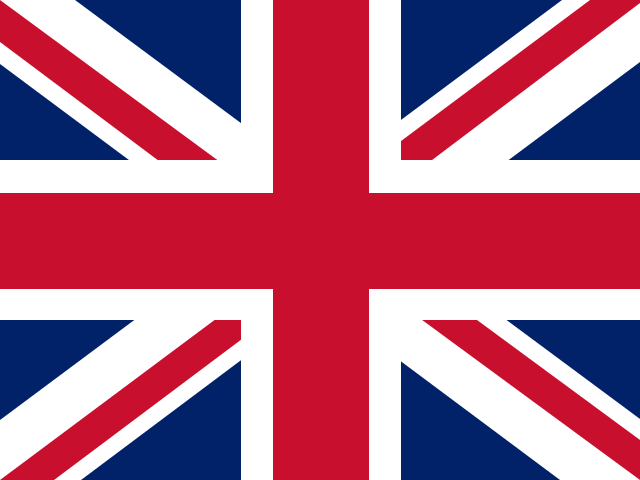 United Kingdom6.14
Lowest and highest reading in Northern Europe.
- Southern Europe
2.68
the middle country, of 14 measured · 17 members
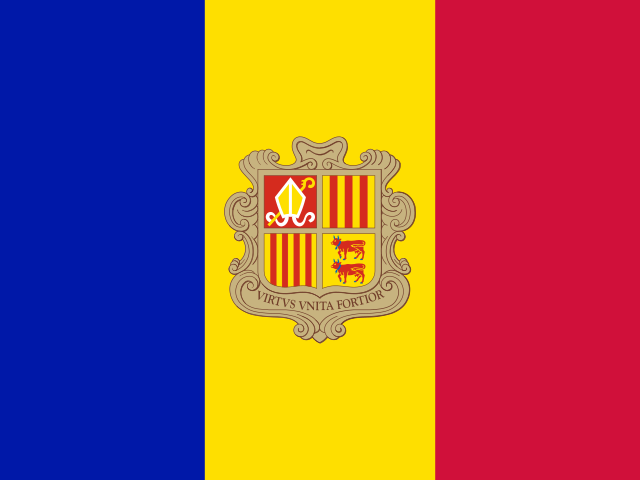 Andorra0.29
 Italy11.34
Lowest and highest reading in Southern Europe.
- Caribbean
3.03
the middle country, of 13 measured · 24 members
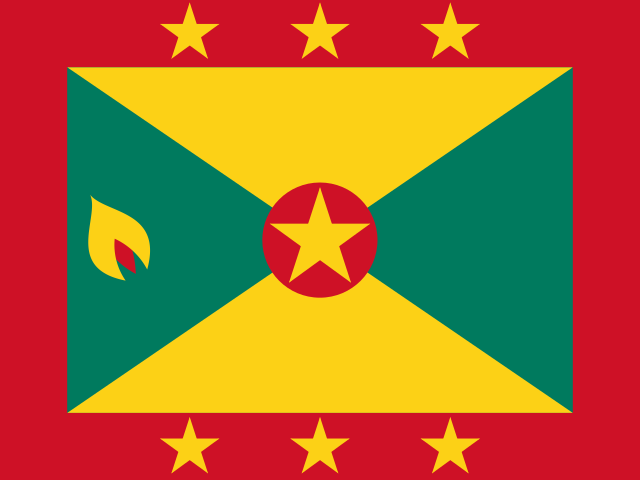 Grenada2.02
 Dominican Republic13.47
Lowest and highest reading in Caribbean.
- Western Africa
3.17
the middle country, of 16 measured · 16 members
 Cabo Verde1.16
 Nigeria9.19
Lowest and highest reading in Western Africa.
- Western Asia
3.80
the middle country, of 17 measured · 19 members
 Bahrain0.87
 Yemen24.83
Lowest and highest reading in Western Asia.
- Eastern Africa
3.83
the middle country, of 18 measured · 19 members
 Zimbabwe2.38Mozambique34.39
Lowest and highest reading in Eastern Africa.
- Middle Africa
4.28
the middle country, of 9 measured · 9 members
São Tomé and Príncipe0.61 Cameroon11.19
Lowest and highest reading in Middle Africa.
- Southern Asia
4.87
the middle country, of 9 measured · 9 members
 Maldives1.04India40.73
Lowest and highest reading in Southern Asia.
- Northern Africa
10.48
the middle country, of 6 measured · 6 members
 Tunisia7.67
 Egypt18.91
Lowest and highest reading in Northern Africa.
- Eastern Asia
11.70
the middle country, of 5 measured · 8 members
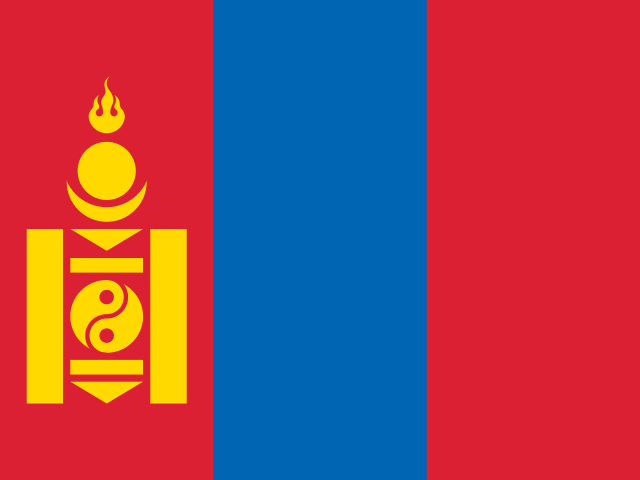 Mongolia1.96
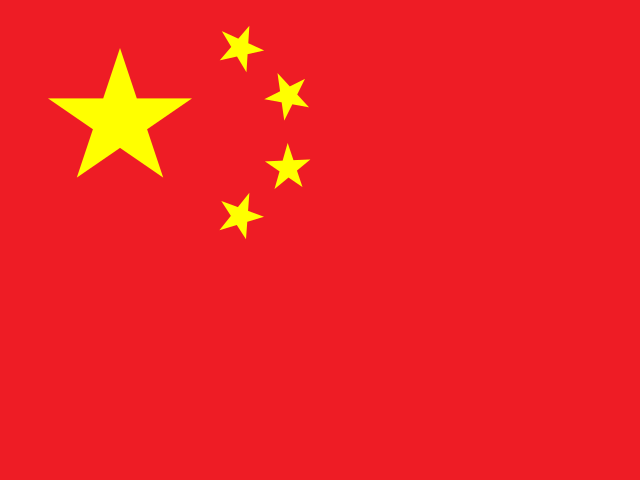 China30.62
Lowest and highest reading in Eastern Asia.
- South America
14.04
the middle country, of 12 measured · 12 members
Paraguay1.88Colombia39.26Lowest and highest reading in South America.
- South-eastern Asia
14.28
the middle country, of 11 measured · 11 members
Singapore0.67Philippines46.56Lowest and highest reading in South-eastern Asia.
- Central America
16.10
the middle country, of 8 measured · 8 members
 Belize7.31
 Mexico38.96
Lowest and highest reading in Central America.
- Australia and New Zealand
2 of 2 measured — too few for a middle: Australia, New Zealand.
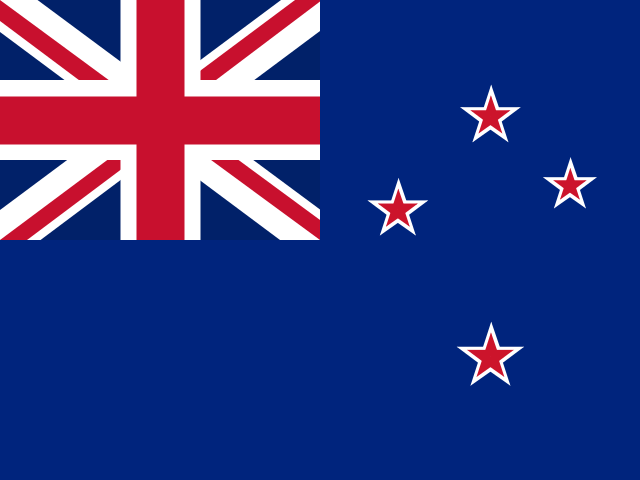 New Zealand15.20
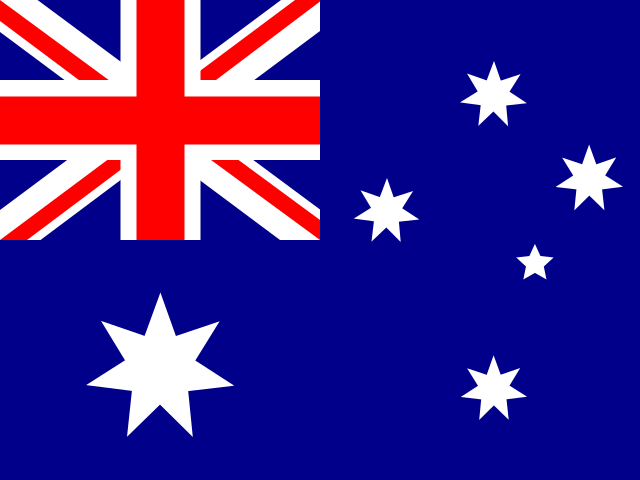 Australia21.90
Lowest and highest reading in Australia and New Zealand.
- Melanesia
4 of 5 measured — too few for a middle: Fiji, Papua New Guinea, Solomon Islands, Vanuatu.
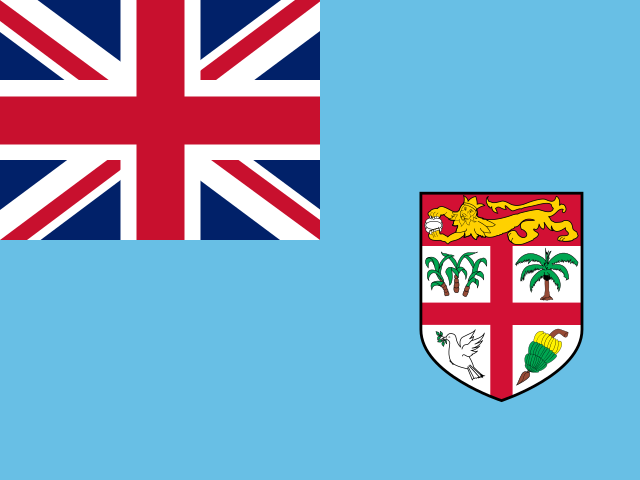 Fiji6.87Papua New Guinea26.51
Lowest and highest reading in Melanesia.
- Northern America
2 of 4 measured — too few for a middle: Canada, United States.
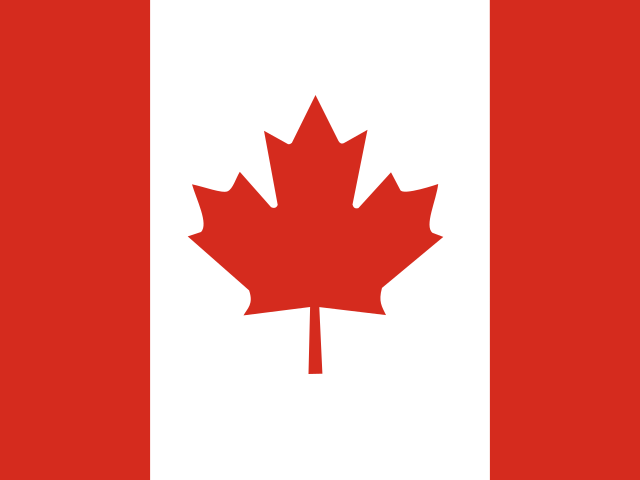 Canada19.88
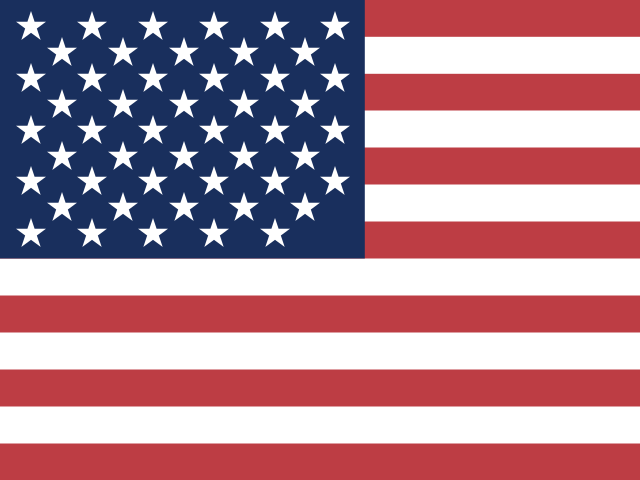 United States23.09
Lowest and highest reading in Northern America.
- Polynesia
3 of 7 measured — too few for a middle: Samoa, Tonga, Tuvalu.
 Tuvalu1.47
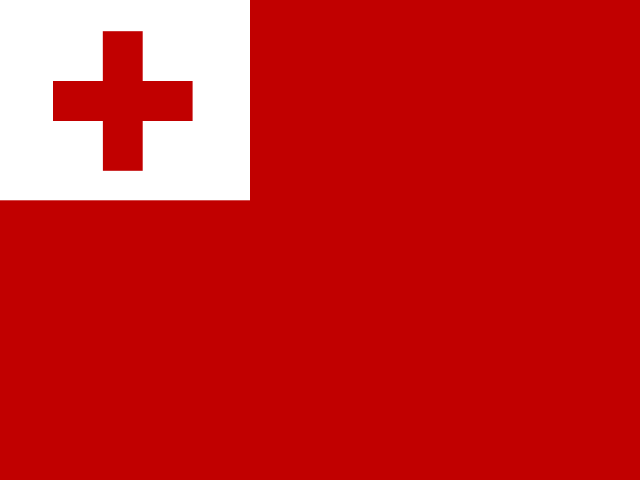 Tonga3.67
Lowest and highest reading in Polynesia.
03The whole field at once
The spread
193 countries, one dot each, on one scale — further right is a higher value. Half the countries are above 4.17; a quarter are above 11.01, and a quarter below 2.32. The bar in each row marks that continent’s middle country.
04All 193 ever measured
Every country
In order, highest value first — position 1 is the highest value, the way Institute for International Law of Peace and Armed Conflict (IFHV), Ruhr University Bochum’s own tables read. “=” marks a position shared with another country. Institute for International Law of Peace and Armed Conflict (IFHV), Ruhr University Bochum ranks nobody on this measure; the position is derived here by ordering the published values. The score is exposure and vulnerability multiplied together, so a wealthy country in a hazard-prone place and a poor one in a calm place can land in the same band for opposite reasons.
Showing 25 of 193 countries































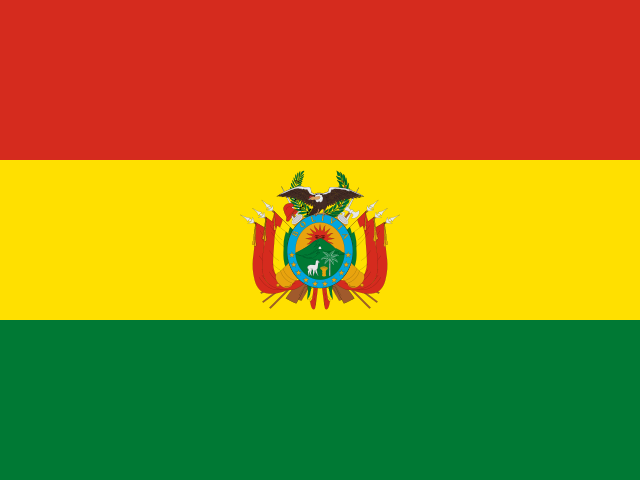
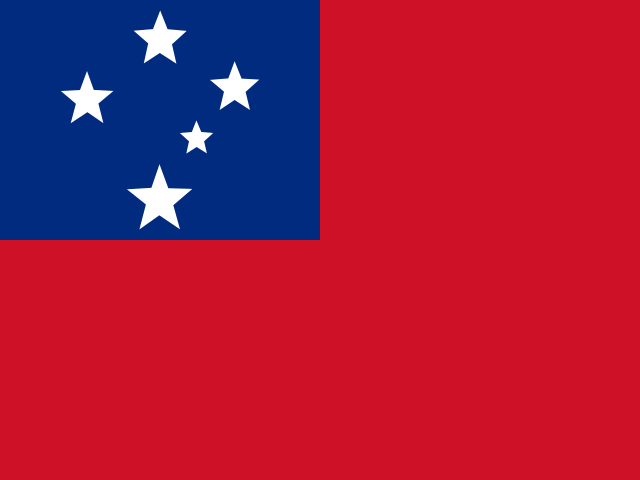


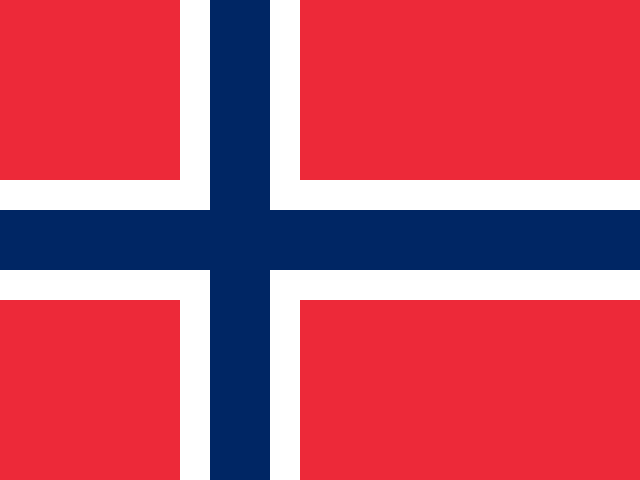


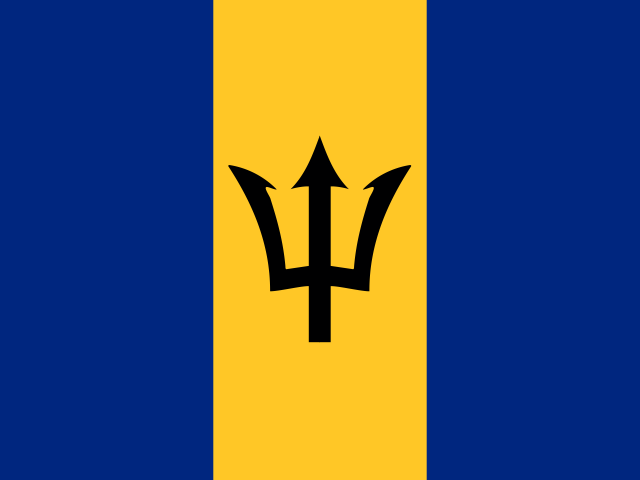





















Values for 2025. The change column compares 2025 with 2024 only; the sparkline covers the recent editions.
052000–2025 · 26 reference years
Over time
Each point is one year from 2000 to 2025. IFHV recomputes the whole trend on its current method every year, so the years are comparable with each other — but not with what an older report printed.
- the middle country
- the middle half of countries
- the middle of the 193 countries measured every time
- each continent’s middle country
The same, year by year
| Year | Countries | Middle country | Middle half | Measured every time |
|---|---|---|---|---|
| 2025 | 193 | 4.17 | 2.32 – 11.01 | 4.17 |
| 2024 | 193 | 4.17 | 2.32 – 11.01 | 4.17 |
| 2023 | 193 | 4.27 | 2.34 – 11.02 | 4.27 |
| 2022 | 193 | 4.08 | 2.27 – 11.08 | 4.08 |
| 2021 | 193 | 4.23 | 2.28 – 10.91 | 4.23 |
| 2020 | 193 | 4.12 | 2.22 – 10.74 | 4.12 |
| 2019 | 193 | 4.23 | 2.23 – 11.24 | 4.23 |
| 2018 | 193 | 4.14 | 2.16 – 10.87 | 4.14 |
| 2017 | 193 | 4.24 | 2.14 – 10.28 | 4.24 |
| 2016 | 193 | 4.23 | 2.20 – 10.59 | 4.23 |
| 2015 | 193 | 4.04 | 2.14 – 10.68 | 4.04 |
| 2014 | 193 | 4.07 | 2.33 – 10.32 | 4.07 |
| 2013 | 193 | 4.08 | 2.15 – 10.49 | 4.08 |
| 2012 | 193 | 4.07 | 2.26 – 10.52 | 4.07 |
| 2011 | 193 | 3.99 | 2.13 – 10.64 | 3.99 |
| 2010 | 193 | 3.86 | 2.12 – 10.20 | 3.86 |
| 2009 | 193 | 3.94 | 2.15 – 9.97 | 3.94 |
| 2008 | 193 | 4.11 | 2.25 – 10.11 | 4.11 |
| 2007 | 193 | 4.41 | 2.39 – 10.92 | 4.41 |
| 2006 | 193 | 4.51 | 2.35 – 11.10 | 4.51 |
| 2005 | 193 | 4.54 | 2.32 – 10.69 | 4.54 |
| 2004 | 193 | 4.42 | 2.22 – 10.68 | 4.42 |
| 2003 | 193 | 4.50 | 2.35 – 10.56 | 4.50 |
| 2002 | 193 | 4.65 | 2.27 – 10.37 | 4.65 |
| 2001 | 193 | 4.37 | 2.28 – 10.57 | 4.37 |
| 2000 | 193 | 4.55 | 2.29 – 10.70 | 4.55 |
06Across every edition
World Risk Index in records
The extremes of the statistic. A record reached by more than one country names none of them.
Highest reading on record
47.42
WorldRiskIndex score (0–100, where 100 is the most at risk)
Institute for International Law of Peace and Armed Conflict (IFHV), Ruhr University Bochum · 2021
Lowest reading on record
0.16
WorldRiskIndex score (0–100, where 100 is the most at risk)
Institute for International Law of Peace and Armed Conflict (IFHV), Ruhr University Bochum · 2014
Biggest improvement between editions
−11.72
46.53 → 34.81
Biggest decline between editions
+8.96
33.10 → 42.06
Most improved since first measured
−9.04
39.66 → 30.62
At the top most often
26 of 26
editions, alone at the first-listed end
07The parts of the index
Inside the number
Institute for International Law of Peace and Armed Conflict (IFHV), Ruhr University Bochum publishes the parts the headline is built from. Each part’s highest and lowest country, and its middle value.
| Part | Highest | Lowest | Middle country |
|---|---|---|---|
| Exposure193 countries | China64.59 | 3 countries share 0.02 | 1.05 |
| Vulnerability193 countries |  Central African Republic72.71 Central African Republic72.71 | Monaco1.55 | 18.35 |
| Susceptibility193 countries | Central African Republic74.55 | Monaco1.75 | 15.59 |
| Lack of Coping Capacities193 countries |  Somalia81.04 Somalia81.04 | Monaco0.42 | 11.57 |
| Lack of Adaptive Capacities193 countries | Central African Republic77.83 | Monaco5.05 | 45.28 |
08The measure
About World Risk Index
The WorldRiskIndex scores how exposed a country is to natural hazards and how vulnerable it is when one arrives, out of 100, where a higher number is worse. Compiled at Ruhr University Bochum, it covers all 193 UN member states with no gaps anywhere.
What the number is: WorldRiskIndex score (0–100, where 100 is the most at risk).
What it does not measure
It does not forecast when a disaster will happen, and it leaves out conflict and epidemics. A low score can come from low exposure as much as from strong preparation.
09Where it fits
Connections
Its part in the Country Index, the statistics whose values line up most closely with it across countries, and others on the same subject.
In the Country Index
A key statistic for Risk & Resilience
“Exposure to natural hazards set against the capacity a country has to cope with them.”
- Edition used
- 2025 (data 2025)
- Countries
- 193
- Licence
- CC BY 4.0
Moves with
Where World Risk Index is higher, these tend to be higher too.
- Total PopulationUN DESA Population Division · 193 countries in commonρ 0.60
- Land AreaFAO · 192 countries in commonρ 0.56
- Internal Displacements by DisasterIDMC · 155 countries in commonρ 0.56
Moves against
Where World Risk Index is higher, these tend to be lower.
- Outbound Mobility Ratio, TertiaryUIS · 109 countries in commonρ −0.69
- Political Stability and Absence of ViolenceKeyWorld Bank Group · 193 countries in commonρ −0.43
- Imports of Goods and Services (% of GDP)World Bank Group · 133 countries in commonρ −0.40
Rank correlation (ρ, from −1 to 1) across countries, on each statistic’s newest edition, out of 189 statistics sharing at least 80 countries with this one. Two statistics that move together do not cause each other.
10Keep reading
Explore further
The countries at either end
11Questions
World Risk Index: questions and answers
Which country has the lowest World Risk Index?
Monaco, at 0.18, among the 193 countries compared in 2025.
Which country has the highest World Risk Index?
Philippines, at 46.56, among the 193 countries compared in 2025.
How many countries does the World Risk Index cover?
193 in 2025.
What is the world average World Risk Index?
This site does not calculate a world average, which would depend on how countries are weighted. In the middle country of the 193 compared in 2025, the figure was 4.17.
Is this Institute for International Law of Peace and Armed Conflict (IFHV), Ruhr University Bochum’s own ranking?
No. Institute for International Law of Peace and Armed Conflict (IFHV), Ruhr University Bochum publishes the values but ranks nobody; the position on this page is derived by Nations Inquiry by ordering the published values, and equal values share a position.
How often is the World Risk Index published?
This site holds 26 reference years, 2000–2025, all recalculated in Institute for International Law of Peace and Armed Conflict (IFHV), Ruhr University Bochum’s 2025 report on one method — not 26 separate publications.
Where does the data come from, and can I download it?
From Institute for International Law of Peace and Armed Conflict (IFHV), Ruhr University Bochum, under CC BY 4.0. Imported from IFHV’s trend file on the Humanitarian Data Exchange. The WorldRiskReport does print a ranking, but only inside its PDF — every machine-readable file the institute publishes carries scores and no rank column. Every edition is on this site’s Datasets pages as a full table, and downloads as a CSV file with every value unrounded.
12Method
Sources, method and citation
Source
World Risk Index — Institute for International Law of Peace and Armed Conflict (IFHV), Ruhr University Bochum
Imported from IFHV’s trend file on the Humanitarian Data Exchange. The WorldRiskReport does print a ranking, but only inside its PDF — every machine-readable file the institute publishes carries scores and no rank column.
Newest edition
Report year 2025Data year 2025
Cite the source as: Bündnis Entwicklung Hilft and IFHV, Ruhr University Bochum. WorldRiskReport. Berlin and Bochum.
Licence: CC BY 4.0, checked 2026-08-29.
How this page reads the numbers
- Institute for International Law of Peace and Armed Conflict (IFHV), Ruhr University Bochum ranks nobody on this measure. The position is derived by Nations Inquiry by ordering the published values; equal values share a position.
- Which end is better follows the publisher’s own reading of the measure.
- A country is named at an end only when it holds that value alone. Where several share it, the page says how many and names none first.
- Values are stored exactly as published and trimmed only for display. “The middle country” is the median of the countries measured, not a world average.
The file itself, column by column — where it came from, what each column holds, and every edition as a CSV — is on its dataset page.
Photographs
The countries at the top of this statistic, from their profiles: Wikimedia Commons, shown in greyscale, each used under the licence named.
- Monaco — Martin Weber derivative work: Jjtkk, CC BY-SA 3.0
- Andorra — Tiia Monto derivative work: Jjtkk, CC BY-SA 3.0
- San Marino — Matl derivative work: Jjtkk, CC BY-SA 3.0
Cite this page
Nations Inquiry (2026). World Risk Index by country: World Risk Index, data from Institute for International Law of Peace and Armed Conflict (IFHV), Ruhr University Bochum. https://nationsinquiry.com/statistics/world-risk-index