Data for 1996
Price Level of Household Consumption, 1996
1996, as GGDC’s 2025 release gives it · stored as published, never rewritten
Price Level of Household Consumption, 1996 covers 182 countries. Bermuda is highest, at 1.11142; Iraq is lowest, at 0.08794. The middle country reads 0.32857. Against 1995, 182 values changed (103 up, 79 down), the same countries are covered.
Price Level of Household Consumption · Data for 1996
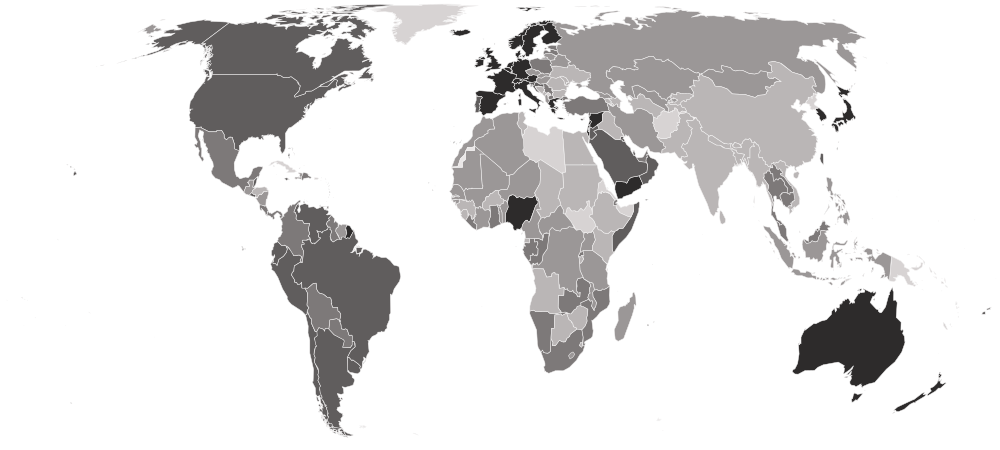

HighestBermuda
1.11142
LowestIraq
0.08794Shaded by value in five groups of equal size, darkest at the highest end. Neither end is better. The values describe a shape, not a score.
01Values only
The table
Every country and every column of Price Level of Household Consumption, 1996, as published. The file carries values only, so no position is shown. “=” marks a shared position.
Showing 25 of 182 countries · select a heading to sort
| BermudaBMUNorthern America | 1.11142 | Benchmark | Outlier |
 SwitzerlandCHEWestern Europe | 1.02842 | Benchmark | Regular |
 SeychellesSYCEastern Africa | 1.00754 | Extrapolated | Regular |
 JapanJPNEastern Asia | 1.00494 | Benchmark | Regular |
 SyriaSYRWestern Asia | 0.99544 | Benchmark | Outlier |
 SingaporeSGPSouth-eastern Asia | 0.95278 | Benchmark | Regular |
 DenmarkDNKNorthern Europe | 0.94737 | Benchmark | Regular |
 SwedenSWENorthern Europe | 0.93900 | Benchmark | Regular |
 NorwayNORNorthern Europe | 0.92403 | Benchmark | Regular |
 FinlandFINNorthern Europe | 0.89145 | Benchmark | Regular |
 NigeriaNGAWestern Africa | 0.88218 | Benchmark | Outlier |
 FranceFRAWestern Europe | 0.81612 | Benchmark | Regular |
 IcelandISLNorthern Europe | 0.81352 | Benchmark | Regular |
 GermanyDEUWestern Europe | 0.79977 | Benchmark | Regular |
 AustriaAUTWestern Europe | 0.78271 | Benchmark | Regular |
 BelgiumBELWestern Europe | 0.76827 | Benchmark | Regular |
 LuxembourgLUXWestern Europe | 0.76779 | Benchmark | Regular |
 NetherlandsNLDWestern Europe | 0.74851 | Benchmark | Regular |
 IrelandIRLNorthern Europe | 0.71746 | Benchmark | Regular |
 Cayman IslandsCYMCaribbean | 0.70537 | Extrapolated | Regular |
 ItalyITASouthern Europe | 0.69201 | Benchmark | Regular |
 Antigua and BarbudaATGCaribbean | 0.69071 | Benchmark | Regular |
 LebanonLBNWestern Asia | 0.68453 | Benchmark | Regular |
 Hong KongHKGEastern Asia | 0.68071 | Benchmark | Regular |
 IsraelISRWestern Asia | 0.65908 | Benchmark | Regular |
 British Virgin IslandsVGBCaribbean | 0.64684 | Extrapolated | Regular |
 United KingdomGBRNorthern Europe | 0.64669 | Benchmark | Regular |
 South KoreaKOREastern Asia | 0.63243 | Benchmark | Regular |
 SpainESPSouthern Europe | 0.63108 | Benchmark | Regular |
 New ZealandNZLAustralia and New Zealand | 0.62912 | Benchmark | Regular |
 AustraliaAUSAustralia and New Zealand | 0.62286 | Benchmark | Regular |
 BahrainBHRWestern Asia | 0.62199 | Benchmark | Regular |
 Turks and Caicos IslandsTCACaribbean | 0.61221 | Extrapolated | Outlier |
 BahamasBHSCaribbean | 0.60489 | Benchmark | Regular |
 YemenYEMWestern Asia | 0.59281 | Benchmark | Regular |
 GreeceGRCSouthern Europe | 0.59215 | Benchmark | Regular |
 ArgentinaARGSouth America | 0.58693 | Benchmark | Regular |
 United StatesUSANorthern America | 0.58295 | Benchmark | Regular |
 PortugalPRTSouthern Europe | 0.57892 | Benchmark | Regular |
 UruguayURYSouth America | 0.56319 | Benchmark | Regular |
 BrazilBRASouth America | 0.56273 | Benchmark | Regular |
 CyprusCYPWestern Asia | 0.54608 | Extrapolated | Regular |
 CanadaCANNorthern America | 0.52275 | Benchmark | Regular |
 Saint LuciaLCACaribbean | 0.51782 | Benchmark | Regular |
 DominicaDMACaribbean | 0.50541 | Benchmark | Regular |
 Cabo VerdeCPVWestern Africa | 0.49548 | Extrapolated | Regular |
 Saint Vincent and the GrenadinesVCTCaribbean | 0.48771 | Benchmark | Regular |
 Saint Kitts and NevisKNACaribbean | 0.48741 | Benchmark | Regular |
 CroatiaHRVSouthern Europe | 0.48398 | Benchmark | Regular |
 MacauMACEastern Asia | 0.47771 | Extrapolated | Regular |
 JamaicaJAMCaribbean | 0.47760 | Benchmark | Regular |
 GrenadaGRDCaribbean | 0.47479 | Benchmark | Regular |
 ArubaABWCaribbean | 0.47265 | Extrapolated | Regular |
 AnguillaAIACaribbean | 0.46650 | Extrapolated | Regular |
 MaltaMLTSouthern Europe | 0.46231 | Extrapolated | Regular |
 Saudi ArabiaSAUWestern Asia | 0.46119 | Extrapolated | Regular |
 SloveniaSVNSouthern Europe | 0.44509 | Benchmark | Regular |
 VenezuelaVENSouth America | 0.44381 | Benchmark | Regular |
 KuwaitKWTWestern Asia | 0.44299 | Extrapolated | Regular |
 TaiwanTWNEastern Asia | 0.44031 | Extrapolated | Regular |
 ChileCHLSouth America | 0.43989 | Benchmark | Regular |
 QatarQATWestern Asia | 0.43986 | Benchmark | Regular |
 PeruPERSouth America | 0.43859 | Benchmark | Regular |
 BruneiBRNSouth-eastern Asia | 0.43414 | Extrapolated | Regular |
 JordanJORWestern Asia | 0.43090 | Benchmark | Regular |
 MaldivesMDVSouthern Asia | 0.43018 | Extrapolated | Regular |
 SomaliaSOMEastern Africa | 0.42427 | Extrapolated | Regular |
 EcuadorECUSouth America | 0.42362 | Benchmark | Regular |
 BelizeBLZCentral America | 0.42274 | Benchmark | Regular |
 OmanOMNWestern Asia | 0.41851 | Benchmark | Regular |
 FijiFJIMelanesia | 0.41636 | Benchmark | Regular |
 El SalvadorSLVCentral America | 0.40777 | Interpolated | Regular |
 ThailandTHASouth-eastern Asia | 0.40579 | Benchmark | Regular |
 São Tomé and PríncipeSTPMiddle Africa | 0.40228 | Extrapolated | Regular |
 PanamaPANCentral America | 0.40103 | Benchmark | Regular |
 Republic of the CongoCOGMiddle Africa | 0.39998 | Benchmark | Regular |
 SerbiaSRBSouthern Europe | 0.39273 | Extrapolated | Regular |
 North MacedoniaMKDSouthern Europe | 0.38103 | Benchmark | Regular |
 Trinidad and TobagoTTOCaribbean | 0.38008 | Benchmark | Regular |
 MontserratMSRCaribbean | 0.37399 | Extrapolated | Regular |
 GabonGABMiddle Africa | 0.36738 | Benchmark | Regular |
 GambiaGMBWestern Africa | 0.35506 | Extrapolated | Regular |
 BarbadosBRBCaribbean | 0.34734 | Benchmark | Regular |
 PolandPOLEastern Europe | 0.34560 | Benchmark | Regular |
 Dominican RepublicDOMCaribbean | 0.34355 | Interpolated | Regular |
 NamibiaNAMSouthern Africa | 0.34116 | Extrapolated | Regular |
 PalestinePSEWestern Asia | 0.34075 | Extrapolated | Regular |
 ComorosCOMEastern Africa | 0.33748 | Extrapolated | Regular |
 MalaysiaMYSSouth-eastern Asia | 0.33586 | Interpolated | Regular |
 LatviaLVANorthern Europe | 0.33227 | Benchmark | Regular |
 ParaguayPRYSouth America | 0.32974 | Interpolated | Regular |
 EstoniaESTNorthern Europe | 0.32739 | Benchmark | Regular |
 LiberiaLBRWestern Africa | 0.32346 | Extrapolated | Regular |
 MexicoMEXCentral America | 0.32327 | Benchmark | Regular |
 GuyanaGUYSouth America | 0.32042 | Extrapolated | Regular |
 DjiboutiDJIEastern Africa | 0.31562 | Extrapolated | Regular |
 BoliviaBOLSouth America | 0.31460 | Benchmark | Regular |
 ColombiaCOLSouth America | 0.31308 | Interpolated | Regular |
 South AfricaZAFSouthern Africa | 0.30935 | Extrapolated | Regular |
 LaosLAOSouth-eastern Asia | 0.30477 | Extrapolated | Regular |
 MozambiqueMOZEastern Africa | 0.30300 | Extrapolated | Regular |
 ZambiaZMBEastern Africa | 0.30289 | Benchmark | Regular |
 TürkiyeTURWestern Asia | 0.30090 | Benchmark | Regular |
 GhanaGHAWestern Africa | 0.29954 | Extrapolated | Regular |
 Costa RicaCRICentral America | 0.29929 | Interpolated | Regular |
 CambodiaKHMSouth-eastern Asia | 0.29779 | Extrapolated | Regular |
 RwandaRWAEastern Africa | 0.29705 | Interpolated | Regular |
 United Arab EmiratesAREWestern Asia | 0.29620 | Extrapolated | Regular |
 IranIRNSouthern Asia | 0.29338 | Benchmark | Regular |
 HungaryHUNEastern Europe | 0.28903 | Benchmark | Regular |
 LithuaniaLTUNorthern Europe | 0.28721 | Benchmark | Regular |
 MauritaniaMRTWestern Africa | 0.27937 | Extrapolated | Regular |
 CzechiaCZEEastern Europe | 0.27662 | Benchmark | Regular |
 TanzaniaTZAEastern Africa | 0.27614 | Benchmark | Regular |
 RussiaRUSEastern Europe | 0.27372 | Benchmark | Regular |
 Central African RepublicCAFMiddle Africa | 0.27302 | Extrapolated | Regular |
 MongoliaMNGEastern Asia | 0.26519 | Benchmark | Regular |
 MadagascarMDGEastern Africa | 0.26458 | Benchmark | Regular |
 Guinea-BissauGNBWestern Africa | 0.26174 | Extrapolated | Regular |
 HaitiHTICaribbean | 0.26073 | Extrapolated | Regular |
 IndonesiaIDNSouth-eastern Asia | 0.25793 | Benchmark | Regular |
 BeninBENWestern Africa | 0.25700 | Benchmark | Regular |
 SurinameSURSouth America | 0.25450 | Interpolated | Regular |
 SenegalSENWestern Africa | 0.25062 | Benchmark | Regular |
 UgandaUGAEastern Africa | 0.24773 | Extrapolated | Regular |
 AlbaniaALBSouthern Europe | 0.24763 | Benchmark | Regular |
 PhilippinesPHLSouth-eastern Asia | 0.24616 | Benchmark | Regular |
 GuatemalaGTMCentral America | 0.24574 | Interpolated | Regular |
 NicaraguaNICCentral America | 0.24223 | Extrapolated | Regular |
 AlgeriaDZANorthern Africa | 0.24043 | Extrapolated | Regular |
 Côte d’IvoireCIVWestern Africa | 0.23968 | Benchmark | Regular |
 MaliMLIWestern Africa | 0.23747 | Benchmark | Regular |
 DR CongoCODMiddle Africa | 0.23571 | Extrapolated | Regular |
 CameroonCMRMiddle Africa | 0.23541 | Benchmark | Regular |
 SlovakiaSVKEastern Europe | 0.23477 | Benchmark | Regular |
 KazakhstanKAZCentral Asia | 0.23438 | Benchmark | Regular |
 GeorgiaGEOWestern Asia | 0.23149 | Benchmark | Regular |
 BelarusBLREastern Europe | 0.22867 | Benchmark | Regular |
 TogoTGOWestern Africa | 0.22650 | Extrapolated | Regular |
 NigerNERWestern Africa | 0.22383 | Extrapolated | Regular |
 UzbekistanUZBCentral Asia | 0.22252 | Benchmark | Regular |
 MoroccoMARNorthern Africa | 0.22186 | Benchmark | Regular |
 MauritiusMUSEastern Africa | 0.21954 | Benchmark | Regular |
 MalawiMWIEastern Africa | 0.21781 | Benchmark | Regular |
 LesothoLSOSouthern Africa | 0.21450 | Extrapolated | Regular |
 PakistanPAKSouthern Asia | 0.21327 | Benchmark | Regular |
 TunisiaTUNNorthern Africa | 0.20985 | Benchmark | Regular |
 BotswanaBWASouthern Africa | 0.20958 | Benchmark | Regular |
 UkraineUKREastern Europe | 0.20508 | Benchmark | Regular |
 MyanmarMMRSouth-eastern Asia | 0.20489 | Extrapolated | Regular |
 ArmeniaARMWestern Asia | 0.20341 | Benchmark | Regular |
 ChinaCHNEastern Asia | 0.20320 | Extrapolated | Regular |
 AzerbaijanAZEWestern Asia | 0.20277 | Benchmark | Regular |
 MontenegroMNESouthern Europe | 0.20250 | Extrapolated | Regular |
 RomaniaROUEastern Europe | 0.20234 | Benchmark | Regular |
 BangladeshBGDSouthern Asia | 0.19968 | Benchmark | Regular |
 Burkina FasoBFAWestern Africa | 0.19692 | Extrapolated | Regular |
 MoldovaMDAEastern Europe | 0.19644 | Benchmark | Regular |
 Sri LankaLKASouthern Asia | 0.19222 | Benchmark | Regular |
 HondurasHNDCentral America | 0.19095 | Interpolated | Regular |
 EthiopiaETHEastern Africa | 0.18999 | Interpolated | Regular |
 BulgariaBGREastern Europe | 0.18941 | Benchmark | Regular |
 EswatiniSWZSouthern Africa | 0.18887 | Benchmark | Regular |
 KyrgyzstanKGZCentral Asia | 0.18581 | Benchmark | Regular |
 BhutanBTNSouthern Asia | 0.18465 | Extrapolated | Regular |
 EgyptEGYNorthern Africa | 0.18136 | Benchmark | Regular |
 IndiaINDSouthern Asia | 0.18077 | Interpolated | Regular |
 ChadTCDMiddle Africa | 0.17911 | Extrapolated | Regular |
 AngolaAGOMiddle Africa | 0.17689 | Extrapolated | Regular |
 TajikistanTJKCentral Asia | 0.17650 | Benchmark | Regular |
 Bosnia and HerzegovinaBIHSouthern Europe | 0.17618 | Extrapolated | Regular |
 BurundiBDIEastern Africa | 0.17502 | Extrapolated | Regular |
 Sierra LeoneSLEWestern Africa | 0.17413 | Benchmark | Regular |
 GuineaGINWestern Africa | 0.17158 | Benchmark | Regular |
 NepalNPLSouthern Asia | 0.16997 | Benchmark | Regular |
 KenyaKENEastern Africa | 0.16937 | Benchmark | Regular |
 Equatorial GuineaGNQMiddle Africa | 0.15656 | Extrapolated | Regular |
 ZimbabweZWEEastern Africa | 0.15272 | Benchmark | Regular |
 VietnamVNMSouth-eastern Asia | 0.14864 | Benchmark | Regular |
 SudanSDNNorthern Africa | 0.13883 | Extrapolated | Regular |
 TurkmenistanTKMCentral Asia | 0.11393 | Benchmark | Outlier |
| IraqIRQWestern Asia | 0.08794 | Extrapolated | Outlier |
02In 1996
At either end
The 5 countries at each end of the headline.
Highest
- Bermuda1.11142
- Switzerland1.02842
- Seychelles1.00754
- Japan1.00494
- Syria0.99544
Lowest
- Iraq0.08794
- Turkmenistan0.11393
- Sudan0.13883
- Vietnam0.14864
- Zimbabwe0.15272
Neither end is better. The values describe a shape, not a score. The middle country reads 0.32857. “Shared” marks a value another country also holds.
031995 → 1996
Since 1995
What changed between 1995 and this one: who joined or left, and how far the headline moved.
- +0 / −0countries joined / left
- 182values changed, of 182 in both
- 103 · 79rose · fell
- 0unchanged
Rose most
- Syria0.85402 → 0.99544+0.14142
- Lebanon0.57605 → 0.68453+0.10848
- São Tomé and Príncipe0.31585 → 0.40228+0.08643
- Albania0.18493 → 0.24763+0.06270
- Jamaica0.42219 → 0.47760+0.05541
Fell most
- Japan1.19670 → 1.00494−0.19176
- Angola0.35523 → 0.17689−0.17834
- Montenegro0.36093 → 0.20250−0.15843
- Guinea-Bissau0.41095 → 0.26174−0.14920
- Seychelles1.12121 → 1.00754−0.11367
Both years come from the same release, so a difference here is a change in the data, not a revision of it. Every country’s full history is charted on the statistic page.
04Caveats
Read before you use
What this edition’s numbers are and are not, worked out from the file itself.
One year of the 2025 release
Every year in this series comes from GGDC’s 2025 release, recalculated on one method. It can differ from what was first published for 1996.
Which end is better
Neither end is better. The values describe a shape, not a score.
Nothing missing
Every one of the 182 countries has every column.
Some readings carry a flag
GGDC marks readings it considers estimates or provisional. The flags in this file: Benchmark, Extrapolated, Interpolated.
05The files
Download and cite
The table as a file, digit for digit, what this site changed, and a citation for this edition.
- .csv
For a spreadsheet or code
182 rows · 10 KB · UTF-8, opens in Excel
Opens with 11 lines of source notes; the table starts on row 13.
Download consumption-price-level-1996-nations-inquiry.csv - ↗
The publisher’s original
GGDC’s own file, on its own site.
554105
What this site changed: Reshaped into one row per country: regional and income-group totals are left out, only the columns listed are kept, each row gets its ISO 3166 code, and some country names are brought to one spelling. No value is recalculated, rescaled or rounded.
Licence: CC BY 4.0. Share, adapt and use commercially. Credit the publisher and say if you changed anything.
Cite this edition
Groningen Growth and Development Centre (GGDC) (1996). Price Level of Household Consumption, 1996 [data set], describing 1996. As held by Nations Inquiry, https://nationsinquiry.com/datasets/consumption-price-level/1996
0664 held
Other years
‹ The year before
Price Level of Household Consumption, 1995182 countries
The year after ›
Price Level of Household Consumption, 1997182 countries
All of them
Price Level of Household Consumption: every year64 held, with the data dictionary, coverage and licence.
How it has moved, charted by country
07Questions
Price Level of Household Consumption, 1996: questions and answers
Which country has the highest price level (cost of living) in Price Level of Household Consumption, 1996?
Bermuda, at 1.11142, of the 182 countries in the file.
What year does Price Level of Household Consumption, 1996 describe?
1996.
How many countries does Price Level of Household Consumption, 1996 cover?
182.
Where can I download Price Level of Household Consumption, 1996?
On this page, as a CSV file holding every value exactly as published, or from the publisher’s own site, linked below.
Is Price Level of Household Consumption, 1996 the newest?
No. The newest held here is Price Level of Household Consumption, 2023.