WRI · Baseline Water Stress (Aqueduct)
Baseline water stress (Aqueduct) by country
How much of its renewable water does a country use up, river basin by river basin?
Of the 164 countries compared in 2019, 11 countries shared the lowest reading, 0.00000, and 6 countries shared the highest reading, 5.00000. In the middle country the figure was 1.66310.
Share
Baseline water stress (Aqueduct) · 2019
Context statistic
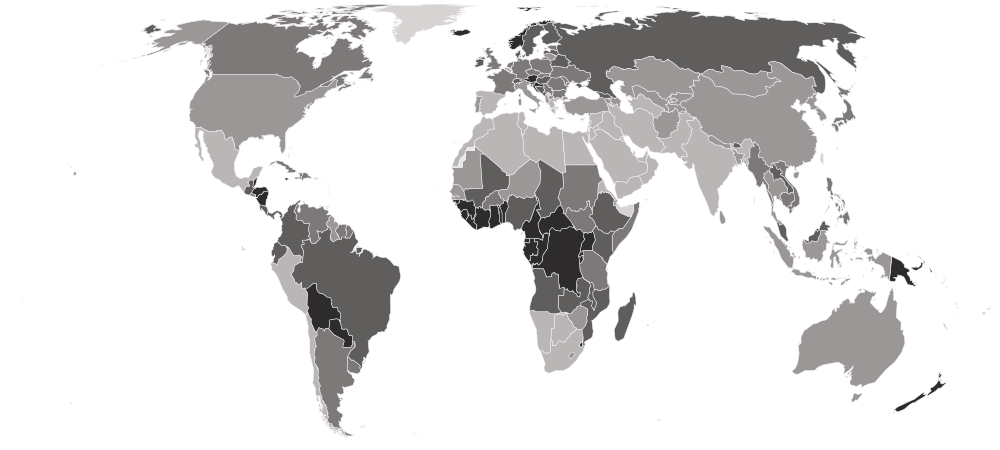
11 countries share the lowest value, 0.00000 — no single country is named first.
012019 · values only
Who leads
The three countries at the lowest end of 164 compared, the three at the other end, and the first on each continent.
Lowest in 2019 · shared
11 countries share the lowest reading, 0.00000
No single country is named first: picking one from a shared value would be a choice the data does not make.








Lowest on each continent
- Africa
7 countries share 0.00000
- Americas
 Jamaica0.00000
- Asia
 Brunei0.00000
- Europe
 Iceland0.00000
- Oceania
 Papua New Guinea0.00000
3 of 21 measured
- Every region
02Every measured country
Baseline water stress (Aqueduct) on a map
Each country is shaded by its value, in five groups holding the same number of countries. Hover a country for its value, or select it to open its profile. Below the map, each continent’s middle country.
Darker is a lower value — the better end.
- 3.73813–5.00000
- 2.13963–3.62829
- 1.18801–2.13115
- 0.36334–1.18097
- 0.00000–0.35508
- No reading in 2019
- Africa
0.84557
the middle country, of 49 measured · 55 members
7 share 0.00000
 Egypt4.85163
Lowest and highest reading in Africa.
- Europe
1.26222
the middle country, of 41 measured · 49 members
Iceland0.00000 San Marino4.44920
Lowest and highest reading in Europe.
- Americas
1.41795
the middle country, of 26 measured · 48 members
Jamaica0.00000 Chile4.47187
Lowest and highest reading in Americas.
- Asia
3.18229
the middle country, of 45 measured · 52 members
Brunei0.000006 share 5.00000
Lowest and highest reading in Asia.
- Oceania
3 of 21 measured — too few for a middle: Australia, New Zealand, Papua New Guinea.
Papua New Guinea0.00000 Australia2.90672
Lowest and highest reading in Oceania.
- Every region
20 sub-regions, lowest middle country first
- Middle Africa
0.01114
the middle country, of 8 measured · 9 members
2 share 0.00000
 Angola1.13079
Lowest and highest reading in Middle Africa.
- Western Africa
0.30749
the middle country, of 15 measured · 16 members
3 share 0.00000
 Niger3.47130
Lowest and highest reading in Western Africa.
- Central America
0.69662
the middle country, of 8 measured · 8 members
 Belize0.06820
 Mexico3.99502
Lowest and highest reading in Central America.
- Northern Europe
0.79496
the middle country, of 10 measured · 13 members
Iceland0.00000 Lithuania2.13963
Lowest and highest reading in Northern Europe.
- Eastern Africa
0.89864
the middle country, of 15 measured · 19 members
2 share 0.00000
 Eritrea3.94254
Lowest and highest reading in Eastern Africa.
- Eastern Europe
1.31736
the middle country, of 10 measured · 10 members
 Hungary0.42517
 Czechia1.83597
Lowest and highest reading in Eastern Europe.
- South America
1.74390
the middle country, of 12 measured · 12 members
 Paraguay0.00034Chile4.47187
Lowest and highest reading in South America.
- Western Europe
1.74879
the middle country, of 8 measured · 9 members
 Austria0.26150
 Belgium4.41084
Lowest and highest reading in Western Europe.
- South-eastern Asia
1.94839
the middle country, of 10 measured · 11 members
Brunei0.00000 Thailand3.62301
Lowest and highest reading in South-eastern Asia.
- Eastern Asia
2.38125
the middle country, of 5 measured · 8 members
 Japan1.96775
 Mongolia3.12844
Lowest and highest reading in Eastern Asia.
- Southern Europe
3.26003
the middle country, of 13 measured · 17 members
 Croatia0.16765San Marino4.44920
Lowest and highest reading in Southern Europe.
- Southern Asia
3.27574
the middle country, of 8 measured · 9 members
 Bhutan0.36778
 Iran4.65337
Lowest and highest reading in Southern Asia.
- Central Asia
3.27685
the middle country, of 5 measured · 5 members
 Tajikistan2.33505
 Turkmenistan3.73813
Lowest and highest reading in Central Asia.
- Northern Africa
4.13438
the middle country, of 6 measured · 6 members
 Sudan1.45796Egypt4.85163
Lowest and highest reading in Northern Africa.
- Southern Africa
4.16775
the middle country, of 5 measured · 5 members
 Eswatini0.31385
 Botswana4.66431
Lowest and highest reading in Southern Africa.
- Western Asia
4.94165
the middle country, of 17 measured · 19 members
 Georgia0.92815
6 share 5.00000
Lowest and highest reading in Western Asia.
- Australia and New Zealand
2 of 2 measured — too few for a middle: Australia, New Zealand.
 New Zealand0.05088Australia2.90672
Lowest and highest reading in Australia and New Zealand.
- Caribbean
4 of 24 measured — too few for a middle: Cuba, Dominican Republic, Haiti, Jamaica.
Jamaica0.00000 Cuba1.65092
Lowest and highest reading in Caribbean.
- Melanesia
1 of 5 measured — too few for a middle: Papua New Guinea.
Papua New Guinea0.00000Lowest and highest reading in Melanesia.
- Northern America
2 of 4 measured — too few for a middle: Canada, United States.
 Canada1.23332
 United States2.60441
Lowest and highest reading in Northern America.
03The whole field at once
The spread
164 countries, one dot each, on one scale — further right is a higher value. Half the countries are above 1.66310; a quarter are above 3.29364, and a quarter below 0.62910. The bar in each row marks that continent’s middle country.
04All 164 ever measured
Every country
In order, lowest value first. No rank or position is shown: too many countries share the same value for an order to mean anything. Higher is worse, and 5 is a cap: every country withdrawing more than 80% of its supply scores the maximum, so the top of the table is a tie. Read it beside the FAO's water stress figure on the same topic, which measures the national ratio directly and is updated every year.
Showing 25 of 164 countries

































































































Values for 2019.
05In this edition
Baseline water stress (Aqueduct) in records
The extremes of the statistic. A record reached by more than one country names none of them.
Highest reading
Reached 6 times by 6 countries — shared, so no holder is named
5.00000
Baseline water stress score (0–5)
Lowest reading
Reached 11 times by 11 countries — shared, so no holder is named
0.00000
Baseline water stress score (0–5)
06The measure
About baseline water stress (Aqueduct)
Baseline water stress compares how much water a country's people, farms and industry withdraw with how much renewable surface and ground water is available, scored from 0 to 5. The World Resources Institute scores each river basin and averages the scores up to the country, weighted by where the water is used.
What the number is: Baseline water stress score (0–5).
07Where it fits
Connections
Its part in the Country Index, the statistics whose values line up most closely with it across countries, and others on the same subject.
In the Country Index
Context, with no vote
This statistic is published in full under Environment & Sustainability and Risk & Resilience, but does not help decide any Country Index standing.
Environment & SustainabilityRisk & ResilienceWhich statistics vote, and why
Moves with
Where baseline water stress (Aqueduct) is higher, these tend to be higher too.
- Water StressKeyFAO · 161 countries in commonρ 0.69
- Armed Forces Personnel (% of population)U.S. Department of State · 131 countries in commonρ 0.48
- Photovoltaic Power Potential (PVOUT)World Bank Group (ESMAP), data by Solargis · 162 countries in commonρ 0.46
Moves against
Where baseline water stress (Aqueduct) is higher, these tend to be lower.
- Renewable Internal Freshwater Resources per CapitaFAO · 160 countries in commonρ −0.50
- Forest AreaFAO · 164 countries in commonρ −0.49
- Hydro Share of Electricity GenerationEmber · 131 countries in commonρ −0.41
Rank correlation (ρ, from −1 to 1) across countries, on each statistic’s newest edition, out of 373 statistics sharing at least 80 countries with this one. Two statistics that move together do not cause each other.
08Keep reading
Explore further
The data, edition by edition
09Questions
Baseline water stress (Aqueduct): questions and answers
Which country has the lowest baseline water stress (Aqueduct)?
11 countries share the lowest reading, 0.00000, among the 164 compared in 2019, so no single country is named.
Which country has the highest baseline water stress (Aqueduct)?
6 countries share the highest reading, 5.00000, among the 164 compared in 2019, so no single country is named.
How many countries does the Baseline Water Stress (Aqueduct) cover?
164 in 2019.
What is the world average baseline water stress (Aqueduct)?
This site does not calculate a world average, which would depend on how countries are weighted. In the middle country of the 164 compared in 2019, the figure was 1.66310.
Is this World Resources Institute (WRI)’s own ranking?
No ranking is shown. World Resources Institute (WRI) publishes values only, and too many countries share the same value for an ordering to mean anything, so none is derived.
How often is the Baseline Water Stress (Aqueduct) published?
This site holds one edition, describing 2019.
Where does the data come from, and can I download it?
From World Resources Institute (WRI), under CC BY (Creative Commons Attribution). From the World Resources Institute's Aqueduct 4.0 country rankings. WRI cautions that its risk indicators are modelled and cannot be validated by direct measurement. Its projections to 2030, 2050 and 2080 are not used. Every edition is on this site’s Datasets pages as a full table, and downloads as a CSV file with every value unrounded.
10Method
Sources, method and citation
Source
Baseline Water Stress (Aqueduct) — World Resources Institute (WRI)
From the World Resources Institute's Aqueduct 4.0 country rankings. WRI cautions that its risk indicators are modelled and cannot be validated by direct measurement. Its projections to 2030, 2050 and 2080 are not used.
Newest edition
Report year 2023Data year 2019
Cite the source as: Kuzma, S., M.F.P. Bierkens, S. Lakshman, T. Luo, L. Saccoccia, E. H. Sutanudjaja, and R. Van Beek. 2023. “Aqueduct 4.0: Updated decision-relevant global water risk indicators.” Technical Note. Washington, DC: World Resources Institute. doi:10.46830/writn.23.00061.
Licence: CC BY (Creative Commons Attribution), checked 2026-09-29.
How this page reads the numbers
- No rank or position is shown: World Resources Institute (WRI) publishes values only, and too many countries share the same value for an ordering to mean anything.
- Which end is better follows the publisher’s own reading of the measure.
- A country is named at an end only when it holds that value alone. Where several share it, the page says how many and names none first.
- Values are stored exactly as published and trimmed only for display. “The middle country” is the median of the countries measured, not a world average.
The file itself, column by column — where it came from, what each column holds, and every edition as a CSV — is on its dataset page.
Cite this page
Nations Inquiry (2026). Baseline water stress (Aqueduct) by country: Baseline Water Stress (Aqueduct), data from World Resources Institute (WRI). https://nationsinquiry.com/statistics/baseline-water-stress