WRI · Riverine Flood Risk (Aqueduct)
River flood risk by country
How many of a country's people are at risk from rivers flooding?
Of the 164 countries compared in 2019, 2 countries shared the lowest reading, 0.0000, and Somalia had the highest reading, 5.0000. In the middle country the figure was 2.4031.
Share
Part ofRisk & Resilience
River flood risk · 2019
Context statistic
2 countries share the lowest value, 0.0000 — no single country is named first.
012019 · WRI’s rank
Who leads
The three countries at the lowest end of 164 compared, the three at the other end, and the first on each continent.
Lowest in 2019 · shared
2 countries share the lowest reading, 0.0000
No single country is named first: picking one from a shared value would be a choice the data does not make.
Highest in 2019
 Somalia5.0000
 Mauritania4.8411
 Liberia4.7939
Where a country sits says how it compares with the others measured, and nothing about why.
02Every measured country
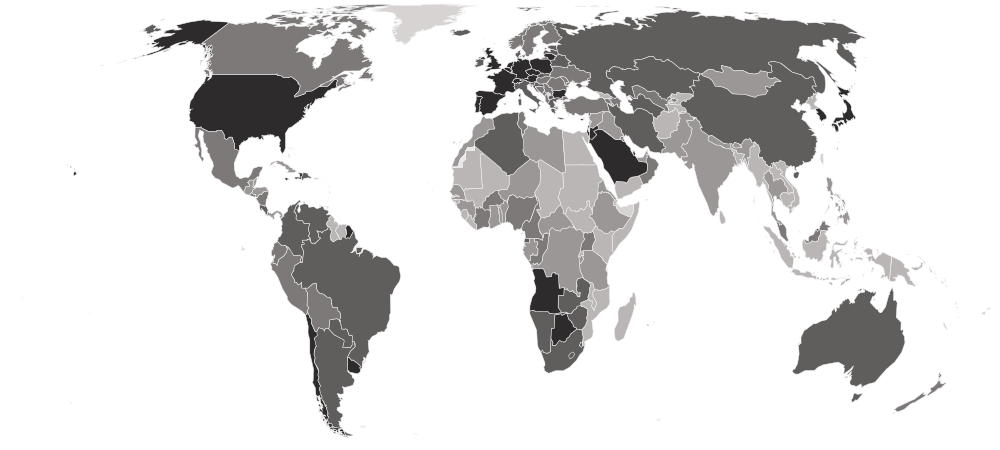
River flood risk on a map
Each country is shaded by its value, in five groups holding the same number of countries. Hover a country for its value, or select it to open its profile. Below the map, each continent’s middle country.
Darker is a lower value — the better end.
- 3.9824–5.0000
- 3.0005–3.9317
- 2.0528–2.9958
- 1.0944–2.0489
- 0.0000–1.0406
- No reading in 2019
- Europe
1.2050
the middle country, of 41 measured · 49 members
2 share 0.0000
 Liechtenstein3.8175
Lowest and highest reading in Europe.
- Americas
2.0938
the middle country, of 26 measured · 48 members
 Uruguay0.4084
 Guyana4.1272
Lowest and highest reading in Americas.
- Asia
3.0999
the middle country, of 45 measured · 52 members
 Israel0.0903
 Bangladesh4.6430
Lowest and highest reading in Asia.
- Africa
3.2145
the middle country, of 49 measured · 55 members
 Angola0.8113Somalia5.0000
Lowest and highest reading in Africa.
- Oceania
3 of 21 measured — too few for a middle: Australia, New Zealand, Papua New Guinea.
 Australia1.5896
 Papua New Guinea4.0432
Lowest and highest reading in Oceania.
- Every region
20 sub-regions, lowest middle country first
- Western Europe
0.6748
the middle country, of 8 measured · 9 members
 Netherlands0.1567Liechtenstein3.8175
Lowest and highest reading in Western Europe.
- Eastern Europe
1.2850
the middle country, of 10 measured · 10 members
 Czechia0.5264
 Moldova2.8508
Lowest and highest reading in Eastern Europe.
- Northern Europe
1.3595
the middle country, of 10 measured · 13 members
 United Kingdom0.5653
 Norway2.8577
Lowest and highest reading in Northern Europe.
- Southern Africa
1.3919
the middle country, of 5 measured · 5 members
 Botswana0.8514
 Eswatini2.0095
Lowest and highest reading in Southern Africa.
- Southern Europe
1.4178
the middle country, of 13 measured · 17 members
2 share 0.0000
 Albania2.3434
Lowest and highest reading in Southern Europe.
- South America
1.6266
the middle country, of 12 measured · 12 members
Uruguay0.4084Guyana4.1272Lowest and highest reading in South America.
- Eastern Asia
1.9879
the middle country, of 5 measured · 8 members
 South Korea0.5991
 North Korea4.0504
Lowest and highest reading in Eastern Asia.
- Western Asia
2.2785
the middle country, of 17 measured · 19 members
Israel0.0903 Lebanon4.0588
Lowest and highest reading in Western Asia.
- Central Asia
2.6664
the middle country, of 5 measured · 5 members
 Kazakhstan1.6009
 Kyrgyzstan4.3091
Lowest and highest reading in Central Asia.
- Middle Africa
2.9055
the middle country, of 8 measured · 9 members
Angola0.8113 Chad4.0999
Lowest and highest reading in Middle Africa.
- Central America
3.0022
the middle country, of 8 measured · 8 members
 Costa Rica1.3487
 Honduras3.5266
Lowest and highest reading in Central America.
- Western Africa
3.2707
the middle country, of 15 measured · 16 members
 Burkina Faso2.1063Mauritania4.8411
Lowest and highest reading in Western Africa.
- Southern Asia
3.5217
the middle country, of 8 measured · 9 members
 Iran1.8408Bangladesh4.6430
Lowest and highest reading in Southern Asia.
- Northern Africa
3.6237
the middle country, of 6 measured · 6 members
 Algeria1.9318
 Egypt4.0568
Lowest and highest reading in Northern Africa.
- South-eastern Asia
3.6740
the middle country, of 10 measured · 11 members
 Brunei1.0169
 Cambodia4.4614
Lowest and highest reading in South-eastern Asia.
- Eastern Africa
4.0314
the middle country, of 15 measured · 19 members
 Zambia1.4429Somalia5.0000
Lowest and highest reading in Eastern Africa.
- Australia and New Zealand
2 of 2 measured — too few for a middle: Australia, New Zealand.
Australia1.5896 New Zealand2.3320
Lowest and highest reading in Australia and New Zealand.
- Caribbean
4 of 24 measured — too few for a middle: Cuba, Dominican Republic, Haiti, Jamaica.
 Haiti0.7914
 Cuba3.0099
Lowest and highest reading in Caribbean.
- Melanesia
1 of 5 measured — too few for a middle: Papua New Guinea.
Papua New Guinea4.0432Lowest and highest reading in Melanesia.
- Northern America
2 of 4 measured — too few for a middle: Canada, United States.
 United States0.8340
 Canada2.2452
Lowest and highest reading in Northern America.
03The whole field at once
The spread
164 countries, one dot each, on one scale — further right is a higher value. Half the countries are above 2.4031; a quarter are above 3.6056, and a quarter below 1.3230. The bar in each row marks that continent’s middle country.
04All 164 ever measured
Every country
In order, highest value first — rank 1 is the highest value, the way WRI’s own tables read. “=” marks a rank shared with another country. Higher is worse, and the rank is the World Resources Institute's own. It counts river floods only — not storm surges on the coast or flash floods from heavy rain — so a low-lying coastal country can score lower than its real flood exposure.
Showing 25 of 164 countries










































































































Values for 2019.
05In this edition
River flood risk in records
The extremes of the statistic. A record reached by more than one country names none of them.
Highest reading
5.0000
Riverine flood risk score (0–5)
Lowest reading
Reached 2 times by 2 countries — shared, so no holder is named
0.0000
Riverine flood risk score (0–5)
06The measure
About river flood risk
Riverine flood risk estimates the share of a country's people who would be affected by rivers flooding in an average year, allowing for existing flood defences, scored from 0 to 5 by the World Resources Institute.
What the number is: Riverine flood risk score (0–5).
07Where it fits
Connections
Its part in the Country Index, the statistics whose values line up most closely with it across countries, and others on the same subject.
In the Country Index
Context, with no vote
This statistic is published in full under Risk & Resilience, but does not help decide any Country Index standing.
Moves with
Where river flood risk is higher, these tend to be higher too.
- Agriculture, Forestry and Fishing Value Added (% of GDP)World Bank Group · 139 countries in commonρ 0.69
- Employment in AgricultureILO · 157 countries in commonρ 0.65
- Share of Dietary Energy Supply from Cereals, Roots and TubersFAO · 146 countries in commonρ 0.64
Moves against
Where river flood risk is higher, these tend to be lower.
- Human Capital Wealth per CapitaWorld Bank Group · 142 countries in commonρ −0.69
- GNI per Capita (PPP)World Bank Group · 92 countries in commonρ −0.68
- Tax Revenue (% of GDP)OECD · 105 countries in commonρ −0.67
Rank correlation (ρ, from −1 to 1) across countries, on each statistic’s newest edition, out of 373 statistics sharing at least 80 countries with this one. Two statistics that move together do not cause each other.
08Keep reading
Explore further
The subject
The data, edition by edition
The countries at either end
09Questions
River flood risk: questions and answers
Which country has the lowest river flood risk?
2 countries share the lowest reading, 0.0000, among the 164 compared in 2019, so no single country is named.
Which country has the highest river flood risk?
Somalia, at 5.0000, among the 164 countries compared in 2019.
How many countries does the Riverine Flood Risk (Aqueduct) cover?
164 in 2019.
What is the world average river flood risk?
This site does not calculate a world average, which would depend on how countries are weighted. In the middle country of the 164 compared in 2019, the figure was 2.4031.
Is this World Resources Institute (WRI)’s own ranking?
Yes. The rank shown is the one World Resources Institute (WRI) publishes.
How often is the Riverine Flood Risk (Aqueduct) published?
This site holds one edition, describing 2019.
Where does the data come from, and can I download it?
From World Resources Institute (WRI), under CC BY (Creative Commons Attribution). From the World Resources Institute's Aqueduct 4.0 country rankings. WRI cautions that its risk indicators are modelled and cannot be validated by direct measurement. Its projections to 2030, 2050 and 2080 are not used. Every edition is on this site’s Datasets pages as a full table, and downloads as a CSV file with every value unrounded.
10Method
Sources, method and citation
Source
Riverine Flood Risk (Aqueduct) — World Resources Institute (WRI)
From the World Resources Institute's Aqueduct 4.0 country rankings. WRI cautions that its risk indicators are modelled and cannot be validated by direct measurement. Its projections to 2030, 2050 and 2080 are not used.
Newest edition
Report year 2023Data year 2019
Cite the source as: Kuzma, S., M.F.P. Bierkens, S. Lakshman, T. Luo, L. Saccoccia, E. H. Sutanudjaja, and R. Van Beek. 2023. “Aqueduct 4.0: Updated decision-relevant global water risk indicators.” Technical Note. Washington, DC: World Resources Institute. doi:10.46830/writn.23.00061.
Licence: CC BY (Creative Commons Attribution), checked 2026-09-29.
How this page reads the numbers
- The rank is World Resources Institute (WRI)’s own, as published.
- Which end is better follows the publisher’s own reading of the measure.
- A country is named at an end only when it holds that value alone. Where several share it, the page says how many and names none first.
- Values are stored exactly as published and trimmed only for display. “The middle country” is the median of the countries measured, not a world average.
The file itself, column by column — where it came from, what each column holds, and every edition as a CSV — is on its dataset page.
Cite this page
Nations Inquiry (2026). River flood risk by country: Riverine Flood Risk (Aqueduct), data from World Resources Institute (WRI). https://nationsinquiry.com/statistics/river-flood-risk