EIA · Primary Energy Production
Energy production by country
How much energy does a country produce, compared with how much it uses?
Of the 204 countries compared in 2024, China had the highest reading, 130.757267, and Montserrat had the lowest reading, 0.000008. In the middle country the figure was 0.077217. Among the 130 countries measured in every edition since 1980, the middle one moved from 0.024950 to 0.335745.
Share
Part ofEnergy
Energy production · 2024
Context statistic

Highest of 204China
130.757267012024 · values only
The highest and the lowest
The three countries with the highest values of 204 compared, the three with the lowest, and the highest on each continent. This statistic has no better end, so no country is shown as leading.
- 1
- 2

- 3

Lowest in 2024
 Montserrat0.000008
 Lesotho0.000009
 Guinea-Bissau0.000012
This statistic has no better end: the two ends describe size, not success.
02Every measured country
Energy production on a map
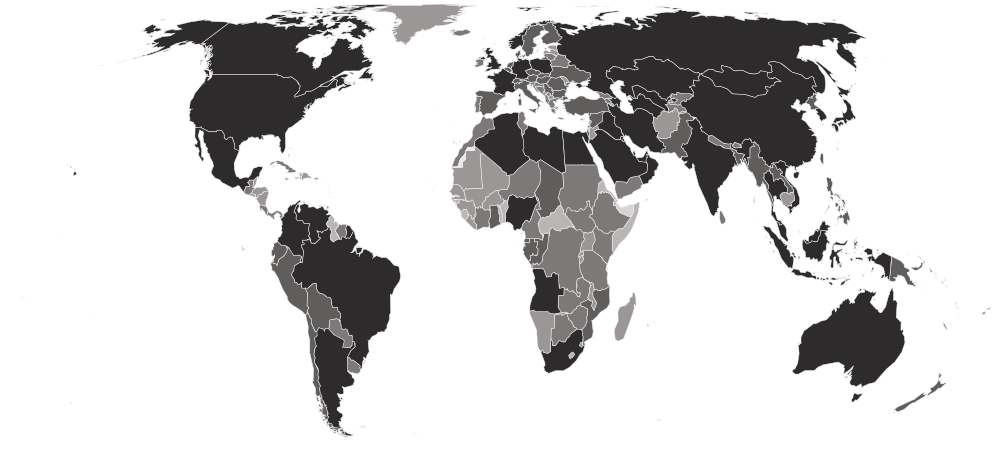
Each country is shaded by its value, in five groups holding the same number of countries. Hover a country for its value, or select it to open its profile. Below the map, each continent’s middle country.
Darker is a higher value. This statistic has no better end, so the shades describe size, not success.
- 0.000008–0.000850
- 0.001052–0.028115
- 0.029503–0.245579
- 0.262096–1.664440
- 1.761683–130.757267
- No reading in 2024 (1 measured in an earlier edition)
- Asia
0.619537
the middle country, of 51 measured · 52 members
China130.757267 Maldives0.000223
Highest and lowest reading in Asia.
- Europe
0.291861
the middle country, of 41 measured · 49 members
Russia60.256376 Faroe Islands0.000807
Highest and lowest reading in Europe.
- Africa
0.021765
the middle country, of 53 measured · 55 members
 Algeria6.468890Lesotho0.000009
Highest and lowest reading in Africa.
- Americas
0.015511
the middle country, of 44 measured · 48 members
United States103.548259Montserrat0.000008Highest and lowest reading in Americas.
- Oceania
0.000284
the middle country, of 15 measured · 21 members
 Australia17.847383
2 share 0.000019
Highest and lowest reading in Oceania.
- Every region
22 sub-regions, highest middle country first
- Central Asia
1.830988
the middle country, of 5 measured · 5 members
 Kazakhstan7.786274
 Tajikistan0.129422
Highest and lowest reading in Central Asia.
- Northern Africa
1.524286
the middle country, of 6 measured · 6 members
Algeria6.468890 Morocco0.037151
Highest and lowest reading in Northern Africa.
- Eastern Asia
1.291830
the middle country, of 8 measured · 8 members
China130.757267 Macau0.002097
Highest and lowest reading in Eastern Asia.
- Western Asia
1.066891
the middle country, of 18 measured · 19 members
 Saudi Arabia26.946461
 Palestine0.001330
Highest and lowest reading in Western Asia.
- South America
0.750952
the middle country, of 12 measured · 12 members
 Brazil12.013439
 Guyana0.000276
Highest and lowest reading in South America.
- South-eastern Asia
0.565056
the middle country, of 11 measured · 11 members
 Indonesia20.212421
 Timor-Leste0.003905
Highest and lowest reading in South-eastern Asia.
- Eastern Europe
0.562670
the middle country, of 10 measured · 10 members
Russia60.256376 Moldova0.002309
Highest and lowest reading in Eastern Europe.
- Western Europe
0.443366
the middle country, of 7 measured · 9 members
 France4.401798
 Luxembourg0.006590
Highest and lowest reading in Western Europe.
- Middle Africa
0.290761
the middle country, of 9 measured · 9 members
 Angola2.720994
 São Tomé and Príncipe0.000020
Highest and lowest reading in Middle Africa.
- Southern Europe
0.106138
the middle country, of 13 measured · 17 members
 Spain1.154941
 Malta0.001137
Highest and lowest reading in Southern Europe.
- Northern Europe
0.098683
the middle country, of 11 measured · 13 members
 Norway9.419453Faroe Islands0.000807
Highest and lowest reading in Northern Europe.
- Southern Asia
0.040802
the middle country, of 9 measured · 9 members
 India22.348834Maldives0.000223
Highest and lowest reading in Southern Asia.
- Central America
0.029776
the middle country, of 8 measured · 8 members
 Mexico5.896424
 Belize0.003911
Highest and lowest reading in Central America.
- Southern Africa
0.012076
the middle country, of 5 measured · 5 members
 South Africa5.496305Lesotho0.000009
Highest and lowest reading in Southern Africa.
- Eastern Africa
0.007239
the middle country, of 17 measured · 19 members
 Mozambique0.945745
 Eritrea0.000186
Highest and lowest reading in Eastern Africa.
- Melanesia
0.002869
the middle country, of 5 measured · 5 members
 Papua New Guinea0.491908
 Solomon Islands0.000062
Highest and lowest reading in Melanesia.
- Western Africa
0.001527
the middle country, of 16 measured · 16 members
 Nigeria4.808254Guinea-Bissau0.000012
Highest and lowest reading in Western Africa.
- Caribbean
0.000085
the middle country, of 20 measured · 24 members
 Trinidad and Tobago1.070156Montserrat0.000008
Highest and lowest reading in Caribbean.
- Polynesia
0.000062
the middle country, of 5 measured · 7 members
 French Polynesia0.000850
 American Samoa0.000019
Highest and lowest reading in Polynesia.
- Australia and New Zealand
2 of 2 measured — too few for a middle: Australia, New Zealand.
Australia17.847383 New Zealand0.330671
Highest and lowest reading in Australia and New Zealand.
- Micronesia
3 of 7 measured — too few for a middle: Guam, Kiribati, Nauru.
 Guam0.000552
 Nauru0.000019
Highest and lowest reading in Micronesia.
- Northern America
4 of 4 measured — too few for a middle: Bermuda, Canada, Greenland, United States.
United States103.548259 Bermuda0.000057
Highest and lowest reading in Northern America.
03The whole field at once
The spread
204 countries, one dot each, on one scale — further right is a higher value. Half the countries are above 0.077217; a quarter are above 0.874033, and a quarter below 0.002398. The bar in each row marks that continent’s middle country.
Log scale: each gridline is ten times the one before, so countries of very different sizes can be seen on one line.
04All 205 ever measured
Every country
In order, highest value first. No rank or position is shown: too many countries share the same value for an order to mean anything. Neither end is better: this is a size, and the biggest producers are large economies and resource exporters. Compare production with consumption in the same row to see whether a country is an energy exporter or relies on imports; firewood and charcoal are largely left out of both.
Showing 25 of 205 countries































































































































Values for 2024. The change column compares 2024 with 2023 only; the sparkline covers the recent editions.
051980–2024 · 45 editions
Over time
Each point is one year from 1980. Production follows oil and gas fields as they are found and run down, and new dams, reactors and wind and solar farms; the consumption column beside it moves with the economy.
- the middle country
- the middle half of countries
- the middle of the 130 countries measured every time
- each continent’s middle country
The same, year by year
| Year | Countries | Middle country | Middle half | Measured every time |
|---|---|---|---|---|
| 2024 | 204 | 0.077217 | 0.002398 – 0.874033 | 0.335745 |
| 2023 | 204 | 0.071977 | 0.002249 – 0.837283 | 0.342873 |
| 2022 | 204 | 0.089639 | 0.001925 – 0.831173 | 0.342019 |
| 2021 | 204 | 0.084967 | 0.001824 – 0.843238 | 0.345580 |
| 2020 | 203 | 0.077057 | 0.002020 – 0.897917 | 0.341657 |
| 2019 | 204 | 0.075596 | 0.001844 – 0.972250 | 0.371249 |
| 2018 | 204 | 0.075653 | 0.001652 – 0.958911 | 0.354633 |
| 2017 | 203 | 0.065070 | 0.001704 – 0.973684 | 0.319502 |
| 2016 | 201 | 0.072123 | 0.001785 – 0.948457 | 0.321542 |
| 2015 | 200 | 0.066956 | 0.001802 – 0.951496 | 0.305689 |
| 2014 | 200 | 0.070012 | 0.001765 – 0.937241 | 0.295357 |
| 2013 | 199 | 0.069792 | 0.002236 – 0.937329 | 0.314791 |
| 2012 | 198 | 0.058958 | 0.002155 – 0.890979 | 0.342883 |
| 2011 | 191 | 0.067864 | 0.002611 – 1.012952 | 0.315952 |
| 2010 | 189 | 0.067854 | 0.002839 – 1.008027 | 0.322105 |
| 2009 | 185 | 0.078020 | 0.003840 – 1.036377 | 0.272437 |
| 2008 | 183 | 0.082985 | 0.004968 – 1.099887 | 0.292611 |
| 2007 | 182 | 0.095139 | 0.005001 – 1.110860 | 0.276574 |
| 2006 | 179 | 0.105265 | 0.004929 – 1.205154 | 0.245661 |
| 2005 | 175 | 0.113188 | 0.004590 – 1.253351 | 0.249764 |
| 2004 | 172 | 0.100404 | 0.005039 – 1.303647 | 0.241649 |
| 2003 | 171 | 0.105943 | 0.004728 – 1.260661 | 0.234634 |
| 2002 | 170 | 0.108464 | 0.004305 – 1.169666 | 0.245548 |
| 2001 | 170 | 0.111786 | 0.004064 – 1.171068 | 0.239357 |
| 2000 | 169 | 0.098484 | 0.004721 – 1.116101 | 0.192667 |
| 1999 | 167 | 0.101301 | 0.004192 – 1.089732 | 0.174344 |
| 1998 | 165 | 0.094240 | 0.004282 – 1.081967 | 0.170377 |
| 1997 | 165 | 0.094787 | 0.003846 – 1.113923 | 0.171170 |
| 1996 | 164 | 0.087360 | 0.003803 – 1.137911 | 0.171865 |
| 1995 | 164 | 0.091431 | 0.003865 – 1.103452 | 0.169377 |
| 1994 | 163 | 0.088910 | 0.003595 – 1.080273 | 0.157541 |
| 1993 | 163 | 0.096532 | 0.003491 – 1.069092 | 0.147443 |
| 1992 | 160 | 0.087080 | 0.003276 – 1.010214 | 0.129905 |
| 1991 | 140 | 0.075791 | 0.003008 – 0.965750 | 0.126337 |
| 1990 | 139 | 0.084473 | 0.002638 – 0.960295 | 0.131558 |
| 1989 | 137 | 0.084222 | 0.002313 – 0.945612 | 0.129733 |
| 1988 | 137 | 0.083294 | 0.001982 – 0.949071 | 0.127064 |
| 1987 | 137 | 0.087346 | 0.002040 – 0.878807 | 0.130384 |
| 1986 | 136 | 0.092627 | 0.001754 – 0.900901 | 0.114893 |
| 1985 | 135 | 0.091776 | 0.002027 – 0.788200 | 0.108197 |
| 1984 | 135 | 0.086584 | 0.002027 – 0.782089 | 0.096206 |
| 1983 | 134 | 0.020376 | 0.001780 – 0.279845 | 0.024129 |
| 1982 | 132 | 0.021942 | 0.001722 – 0.264185 | 0.023044 |
| 1981 | 132 | 0.017953 | 0.001608 – 0.247588 | 0.020990 |
| 1980 | 132 | 0.022542 | 0.001541 – 0.250491 | 0.024950 |
062023 → 2024
Who rose and fell
The biggest changes in value between the two newest editions. Places are shown second, because they also move when other countries do.
Rose most
before → after- China127.006049 → 130.757267+3.751218
 Iran18.886441 → 20.183669+1.297229
- Russia59.314286 → 60.256376+0.942090
- United States102.687681 → 103.548259+0.860578
- India21.603012 → 22.348834+0.745822
Fell most
before → after- Saudi Arabia27.956243 → 26.946461−1.009782
 Egypt3.618883 → 3.198674−0.420209
- Algeria6.832590 → 6.468890−0.363700
- Mexico6.198895 → 5.896424−0.302471
 Turkmenistan3.592430 → 3.346872−0.245558
204 countries were measured in both 2023 and 2024.
07Across every edition
Energy production in records
The extremes of the statistic. A record reached by more than one country names none of them.
Highest reading on record
130.757267
Primary energy produced (quadrillion Btu)
Lowest reading on record
Reached 27 times by 4 countries — shared, so no holder is named
0.000000
Primary energy produced (quadrillion Btu)
Biggest rise between editions
+10.377080
0.437646 → 10.814726
Biggest fall between editions
−6.895830
106.943281 → 100.047451
Biggest change since first measured
+116.168106
14.589161 → 130.757267
Highest most often
26 of 45
editions, alone at the first-listed end
08The measure
About energy production
This is how much primary energy a country produces in a year — coal, oil, gas, nuclear and renewable power — with how much it consumes beside it. Together the two show whether a country makes more energy than it uses or depends on imports.
What the number is: Primary energy produced (quadrillion Btu).
09Where it fits
Connections
Its part in the Country Index, the statistics whose values line up most closely with it across countries, and others on the same subject.
In the Country Index
Context, with no vote
This statistic is published in full under Energy, but does not help decide any Country Index standing.
Moves with
Where energy production is higher, these tend to be higher too.
- Natural Gas ProductionEIA · 203 countries in commonρ 0.83
- Methane EmissionsEDGAR · 198 countries in commonρ 0.82
- Consumption-Based CO₂ EmissionsGlobal Carbon Project · 120 countries in commonρ 0.81
Moves against
Where energy production is higher, these tend to be lower.
- Net Official Development Assistance ReceivedOECD Development Assistance Committee · 125 countries in commonρ −0.72
- Outbound Mobility Ratio, TertiaryUIS · 113 countries in commonρ −0.50
- Foreign Value Added Share of Gross ExportsOECD · 80 countries in commonρ −0.50
Rank correlation (ρ, from −1 to 1) across countries, on each statistic’s newest edition, out of 384 statistics sharing at least 80 countries with this one. Two statistics that move together do not cause each other.
10Keep reading
Explore further
The subject
The countries at either end
11Questions
Energy production: questions and answers
Which country has the highest energy production?
China, at 130.757267, among the 204 countries compared in 2024.
Which country has the lowest energy production?
Montserrat, at 0.000008, among the 204 countries compared in 2024.
How many countries does the Primary Energy Production cover?
204 in 2024, and 205 at least once across all editions. The number measured varies from 132 to 204 between editions.
What is the world average energy production?
This site does not calculate a world average, which would depend on how countries are weighted. In the middle country of the 204 compared in 2024, the figure was 0.077217.
Is this U.S. Energy Information Administration (EIA)’s own ranking?
No ranking is shown. U.S. Energy Information Administration (EIA) publishes values only, and too many countries share the same value for an ordering to mean anything, so none is derived.
How often is the Primary Energy Production published?
This site holds 45 editions, describing 1980 to 2024.
Where does the data come from, and can I download it?
From U.S. Energy Information Administration (EIA), under Public domain (U.S. government work). From the U.S. Energy Information Administration’s International Energy Statistics, read from its public bulk download. Both totals are EIA’s own; the share of its energy a country produces for itself is not calculated here, and the zeros EIA uses for missing readings are left out. Every edition is on this site’s Datasets pages as a full table, and downloads as a CSV file with every value unrounded.
12Method
Sources, method and citation
Source
Primary Energy Production — U.S. Energy Information Administration (EIA)
From the U.S. Energy Information Administration’s International Energy Statistics, read from its public bulk download. Both totals are EIA’s own; the share of its energy a country produces for itself is not calculated here, and the zeros EIA uses for missing readings are left out.
Newest edition
Report year 2024Data year 2024
Cite the source as: Source: U.S. Energy Information Administration (Sep 2026). International Energy Statistics — Total energy production and total energy consumption (quadrillion Btu).
Licence: Public domain (U.S. government work), checked 2026-09-29.
How this page reads the numbers
- No rank or position is shown: U.S. Energy Information Administration (EIA) publishes values only, and too many countries share the same value for an ordering to mean anything.
- This statistic has no better end, so the page describes higher and lower values and never calls a country a leader.
- A country is named at an end only when it holds that value alone. Where several share it, the page says how many and names none first.
- Values are stored exactly as published and trimmed only for display. “The middle country” is the median of the countries measured, not a world average.
The file itself, column by column — where it came from, what each column holds, and every edition as a CSV — is on its dataset page.
Cite this page
Nations Inquiry (2026). Energy production by country: Primary Energy Production, data from U.S. Energy Information Administration (EIA). https://nationsinquiry.com/statistics/energy-production