World Bank Group · Multidimensional Poverty Measure
Multidimensional poverty (World Bank) by country
What share of people are poor in money, schooling or basic services?
Of the 141 countries compared in the 2025 edition, 2 countries shared the lowest reading, 0.00000%, and DR Congo had the highest reading, 87.95612%. In the middle country the figure was 3.02460%. 17 readings from before 2015 are listed but not compared.
Share
Multidimensional poverty (World Bank) · the 2025 edition
Context statistic
2 countries share the lowest value, 0.00000% — no single country is named first.
01the 2025 edition · position · derived
Who leads
The three countries at the lowest end of 141 compared, the three at the other end, and the first on each continent.
Lowest in the 2025 edition · shared
2 countries share the lowest reading, 0.00000%
No single country is named first: picking one from a shared value would be a choice the data does not make.
Highest in the 2025 edition
 DR Congo87.95612%
 South Sudan87.48117%
 Mozambique84.96764%
Where a country sits says how it compares with the others measured, and nothing about why.
02Every measured country
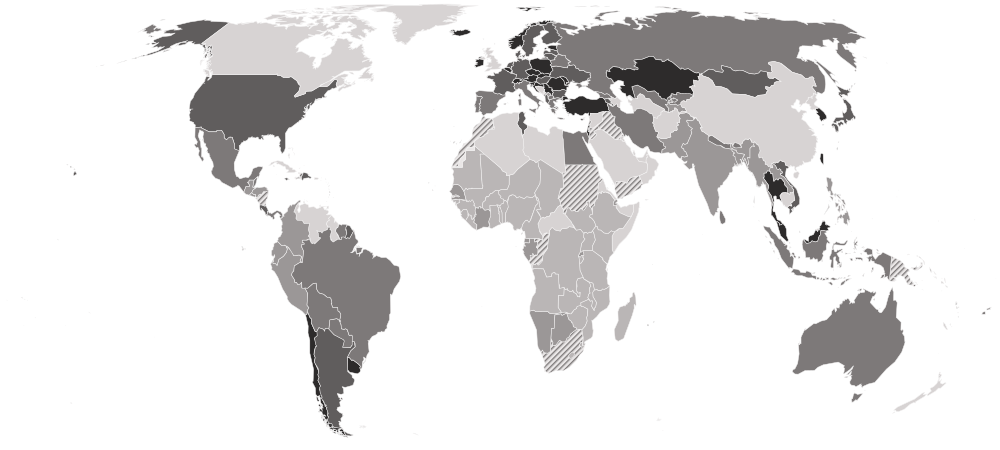
Multidimensional poverty (World Bank) on a map
Each country is shaded by its value, in five groups holding the same number of countries. Hover a country for its value, or select it to open its profile. Below the map, each continent’s middle country.
Darker is a lower value — the better end.
- 42.71978–87.95612%
- 5.88688–41.39884%
- 1.93481–5.00940%
- 0.65937–1.89670%
- 0.00000–0.64397%
- Hatched: a reading from before 2015, listed but not compared (17)
- No reading in the 2025 edition
- Europe
0.95424%
the middle country, of 37 measured · 49 members
 Slovenia0.00000%
 Kosovo9.97881%
Lowest and highest reading in Europe.
- Asia
2.17403%
the middle country, of 30 measured · 52 members
 Maldives0.00000%
 Pakistan27.13069%
Lowest and highest reading in Asia.
- Americas
2.33580%
the middle country, of 23 measured · 48 members
 Uruguay0.17499%
 Honduras18.40269%
Lowest and highest reading in Americas.
- Oceania
2.95679%
the middle country, of 6 measured · 21 members
 Tonga0.40882%
 Vanuatu27.30828%
Lowest and highest reading in Oceania.
- Africa
47.28018%
the middle country, of 45 measured · 55 members
 Mauritius0.73469%DR Congo87.95612%
Lowest and highest reading in Africa.
- Every region
22 sub-regions, lowest middle country first
- Eastern Europe
0.70319%
the middle country, of 10 measured · 10 members
 Czechia0.00635%
 Russia5.00940%
Lowest and highest reading in Eastern Europe.
- Northern Europe
0.70779%
the middle country, of 9 measured · 13 members
 Iceland0.10743%
 Finland1.71913%
Lowest and highest reading in Northern Europe.
- Western Asia
0.98268%
the middle country, of 7 measured · 19 members
 Türkiye0.19925%
 Lebanon7.77278%
Lowest and highest reading in Western Asia.
- Caribbean
1.13824%
the middle country, of 5 measured · 24 members
 Saint Lucia0.41517%
 Dominican Republic1.61930%
Lowest and highest reading in Caribbean.
- Western Europe
1.25706%
the middle country, of 7 measured · 9 members
 Switzerland0.29323%
 Luxembourg3.32732%
Lowest and highest reading in Western Europe.
- Southern Europe
1.93481%
the middle country, of 11 measured · 17 members
Slovenia0.00000%Kosovo9.97881%Lowest and highest reading in Southern Europe.
- South America
3.23675%
the middle country, of 10 measured · 12 members
Uruguay0.17499% Colombia8.76342%
Lowest and highest reading in South America.
- Southern Asia
3.59934%
the middle country, of 8 measured · 9 members
Maldives0.00000%Pakistan27.13069%Lowest and highest reading in Southern Asia.
- Central America
4.27482%
the middle country, of 7 measured · 8 members
 Costa Rica0.82750%Honduras18.40269%
Lowest and highest reading in Central America.
- South-eastern Asia
4.29781%
the middle country, of 7 measured · 11 members
 Thailand0.08776%
 Myanmar16.16564%
Lowest and highest reading in South-eastern Asia.
- Middle Africa
42.71978%
the middle country, of 7 measured · 9 members
 Gabon9.32030%DR Congo87.95612%
Lowest and highest reading in Middle Africa.
- Western Africa
46.58427%
the middle country, of 16 measured · 16 members
 Cabo Verde16.99195%
 Niger78.63033%
Lowest and highest reading in Western Africa.
- Eastern Africa
62.23064%
the middle country, of 16 measured · 19 members
Mauritius0.73469%South Sudan87.48117%Lowest and highest reading in Eastern Africa.
- Australia and New Zealand
1 of 2 measured — too few for a middle: Australia.
 Australia3.66056%
Lowest and highest reading in Australia and New Zealand.
- Central Asia
4 of 5 measured — too few for a middle: Kazakhstan, Kyrgyzstan, Tajikistan, Uzbekistan.
 Kazakhstan0.06509%
 Tajikistan14.10613%
Lowest and highest reading in Central Asia.
- Eastern Asia
4 of 8 measured — too few for a middle: Japan, Mongolia, South Korea, Taiwan.
 Taiwan0.04932%
 Mongolia1.33975%
Lowest and highest reading in Eastern Asia.
- Melanesia
2 of 5 measured — too few for a middle: Fiji, Vanuatu.
 Fiji4.92155%Vanuatu27.30828%
Lowest and highest reading in Melanesia.
- Micronesia
2 of 7 measured — too few for a middle: Kiribati, Marshall Islands.
 Kiribati1.64932%
 Marshall Islands2.25302%
Lowest and highest reading in Micronesia.
- Northern Africa
2 of 6 measured — too few for a middle: Egypt, Tunisia.
 Tunisia0.79149%
 Egypt2.01853%
Lowest and highest reading in Northern Africa.
- Northern America
1 of 4 measured — too few for a middle: United States.
 United States1.27597%
Lowest and highest reading in Northern America.
- Polynesia
1 of 7 measured — too few for a middle: Tonga.
Tonga0.40882%Lowest and highest reading in Polynesia.
- Southern Africa
4 of 5 measured — too few for a middle: Botswana, Eswatini, Lesotho, Namibia.
 Botswana25.59934%
 Eswatini47.73335%
Lowest and highest reading in Southern Africa.
03The whole field at once
The spread
141 countries, one dot each, on one scale — further right is a higher value. Half the countries are above 3.02460%; a quarter are above 32.79335%, and a quarter below 0.95424%. The bar in each row marks that continent’s middle country.
04All 158 ever measured
Every country
In order, highest value first — position 1 is the highest value, the way World Bank Group’s own tables read. “=” marks a position shared with another country. World Bank Group ranks nobody on this measure; the position is derived here by ordering the published values. Money is one of the three dimensions, so everyone below $3.00 a day counts as poor here and this share can never be lower than the extreme-poverty rate — the difference between the two is the people above the line who still lack schooling or basic services. It is not the same measure as the Global Multidimensional Poverty Index from Oxford, which leaves income out.
Showing 25 of 158 countries























































































Values for the 2025 edition.
05In this edition
Multidimensional poverty (World Bank) in records
The extremes of the statistic. A record reached by more than one country names none of them.
Highest reading
87.95612%
Multidimensional poverty headcount ratio (%)
Lowest reading
Reached 2 times by 2 countries — shared, so no holder is named
0.00000%
Multidimensional poverty headcount ratio (%)
06The parts of the index
Inside the number
World Bank Group publishes the parts the headline is built from. Each part’s highest and lowest country, and its middle value.
| Part | Highest | Lowest | Middle country |
|---|---|---|---|
| Deprived: below $3.00 a day, 2021 PPP (%)141 countries | DR Congo85.3177 | 5 countries share 0.0000 | 2.1010 |
| Deprived: educational attainment (%)140 countries | Niger67.10126 | 7 countries share 0.00000 | 3.19616 |
| Deprived: educational enrollment (%)104 countries | South Sudan62.1999 | 3 countries share 0.0000 | 3.7190 |
| Deprived: electricity (%)139 countries |  Burundi90.5685 | 44 countries share 0.0000 | 0.5544 |
| Deprived: sanitation (%)115 countries | Burundi91.007 | 9 countries share 0.000 | 12.414 |
| Deprived: drinking water (%)130 countries |  São Tomé and Príncipe88.258 | 24 countries share 0.000 | 4.281 |
07The measure
About multidimensional poverty (World Bank)
The World Bank’s Multidimensional Poverty Measure counts people as poor when their household falls short on money, schooling or basic services — living on less than $3.00 a day, with no adult who finished primary school or a child out of school, or without electricity, sanitation or safe drinking water — in a combination worth at least a third of the whole.
What the number is: Multidimensional poverty headcount ratio (%).
What it does not measure
It counts whether a household is deprived, not how deeply: a family just short of the line and one far below it count the same. And because money is a whole dimension, everyone below $3.00 a day is counted as poor whatever their schooling or services; health, housing and safety are not among its indicators.
08Where it fits
Connections
Its part in the Country Index, the statistics whose values line up most closely with it across countries, and others on the same subject.
In the Country Index
Context, with no vote
This statistic is published in full under Development & Human Capital and Poverty & Inequality, but does not help decide any Country Index standing.
Development & Human CapitalPoverty & InequalityWhich statistics vote, and why
Moves with
Where multidimensional poverty (World Bank) is higher, these tend to be higher too.
- Working Poverty RateILO · 90 countries in commonρ 0.94
- Poverty Headcount at $3.00 a Day, Line-up EstimatesWorld Bank Group · 141 countries in commonρ 0.92
- Global Multidimensional Poverty IndexOPHI · 81 countries in commonρ 0.90
Moves against
Where multidimensional poverty (World Bank) is higher, these tend to be lower.
- GNI per Capita (PPP)World Bank Group · 83 countries in commonρ −0.87
- Access to ElectricityWorld Bank Group · 139 countries in commonρ −0.86
- Access to Electricity, RuralWorld Bank Group · 135 countries in commonρ −0.85
Rank correlation (ρ, from −1 to 1) across countries, on each statistic’s newest edition, out of 354 statistics sharing at least 80 countries with this one. Two statistics that move together do not cause each other.
09Keep reading
Explore further
The data, edition by edition
The countries at either end
More from World Bank Group
10Questions
Multidimensional poverty (World Bank): questions and answers
Which country has the lowest multidimensional poverty (World Bank)?
2 countries share the lowest reading, 0.00000%, among the 141 compared in the 2025 edition, so no single country is named.
Which country has the highest multidimensional poverty (World Bank)?
DR Congo, at 87.95612%, among the 141 countries compared in the 2025 edition.
How many countries does the Multidimensional Poverty Measure cover?
141 in the 2025 edition, and 158 at least once across all editions.
What is the world average multidimensional poverty (World Bank)?
This site does not calculate a world average, which would depend on how countries are weighted. In the middle country of the 141 compared in the 2025 edition, the figure was 3.02460%.
Is this World Bank Group’s own ranking?
No. World Bank Group publishes the values but ranks nobody; the position on this page is derived by Nations Inquiry by ordering the published values, and equal values share a position.
How often is the Multidimensional Poverty Measure published?
This site holds one edition, describing 2025.
Where does the data come from, and can I download it?
From World Bank Group, under CC BY 4.0. From the World Bank’s own workbook of every survey year it has computed, rather than its indicator API, which rounds the same figure to one decimal. Each country’s newest survey is taken, and the six deprivation rates are stored beside the headline. Every edition is on this site’s Datasets pages as a full table, and downloads as a CSV file with every value unrounded.
11Method
Sources, method and citation
Source
Multidimensional Poverty Measure — World Bank Group
From the World Bank’s own workbook of every survey year it has computed, rather than its indicator API, which rounds the same figure to one decimal. Each country’s newest survey is taken, and the six deprivation rates are stored beside the headline.
Newest edition
Report year 2025Data year not recorded
Cite the source as: World Bank. Multidimensional Poverty Measure (MPM) database, April 2026 update. Washington, DC: World Bank Group.
Licence: CC BY 4.0, checked 2026-09-29.
How this page reads the numbers
- World Bank Group ranks nobody on this measure. The position is derived by Nations Inquiry by ordering the published values; equal values share a position.
- Which end is better follows the publisher’s own reading of the measure.
- A country is named at an end only when it holds that value alone. Where several share it, the page says how many and names none first.
- The file gives each country’s most recent reading, so the rows are from different years. Readings from before 2015 are listed but left out of every comparison on this page.
- Values are stored exactly as published and trimmed only for display. “The middle country” is the median of the countries measured, not a world average.
The file itself, column by column — where it came from, what each column holds, and every edition as a CSV — is on its dataset page.
Cite this page
Nations Inquiry (2026). Multidimensional poverty (World Bank) by country: Multidimensional Poverty Measure, data from World Bank Group. https://nationsinquiry.com/statistics/multidimensional-poverty-measure