Dataset · UN IGME
Neonatal Mortality Rate
56 years, 1969–2024 · 200 countries · 3 measures
The neonatal mortality rate is how many babies out of every thousand born alive die in their first 28 days. Most deaths in the first year of life happen in this first month, which makes it the measure most directly tied to care at birth — a skilled attendant, a clean delivery, warmth, and help with breathing and infection.
This site holds every year from 1969 to 2024, read from UN IGME’s own data and stored exactly as published.
Neonatal Mortality Rate · the file
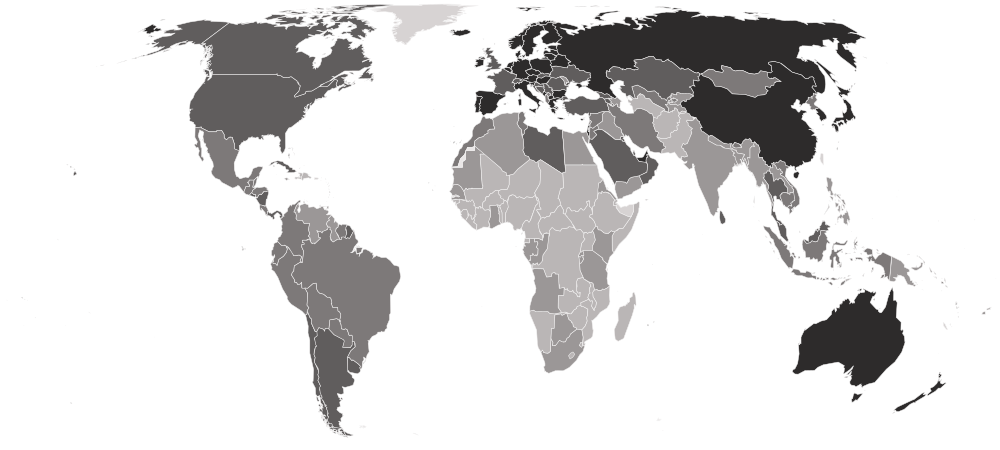
- Newest
- Neonatal Mortality Rate, 2024
- Held
- 56 years · 9,682 rows
- Licence
- CC BY 3.0 IGO
0156 years
Every year
Every year comes from UN IGME’s 2025 release, recalculated on one method. Each opens the full table for that year; each downloads as a CSV.
| Year | Countries | Change | Read | Download |
|---|---|---|---|---|
| Neonatal Mortality Rate, 2024Newest | 200 | ±0 | September 29, 2026 | CSV |
| Neonatal Mortality Rate, 2023 | 200 | ±0 | September 29, 2026 | CSV |
| Neonatal Mortality Rate, 2022 | 200 | ±0 | September 29, 2026 | CSV |
| Neonatal Mortality Rate, 2021 | 200 | ±0 | September 29, 2026 | CSV |
| Neonatal Mortality Rate, 2020 | 200 | ±0 | September 29, 2026 | CSV |
| Neonatal Mortality Rate, 2019 | 200 | ±0 | September 29, 2026 | CSV |
| Neonatal Mortality Rate, 2018 | 200 | ±0 | September 29, 2026 | CSV |
| Neonatal Mortality Rate, 2017 | 200 | ±0 | September 29, 2026 | CSV |
| Neonatal Mortality Rate, 2016 | 200 | ±0 | September 29, 2026 | CSV |
| Neonatal Mortality Rate, 2015 | 200 | ±0 | September 29, 2026 | CSV |
| Neonatal Mortality Rate, 2014 | 200 | ±0 | September 29, 2026 | CSV |
| Neonatal Mortality Rate, 2013 | 200 | ±0 | September 29, 2026 | CSV |
Show all 56 years
Every year in one file, one row per country per year: neonatal-mortality-all-editions-nations-inquiry.csv
025 columns
What’s in the file
Every column, what it holds, how it is stored and what its values look like — what a reader needs before opening the file.
| Column | What it holds | Stored as | Range, 2024 | Distinct | Empty | Spread |
|---|---|---|---|---|---|---|
CountrycountryName | The country’s name, as this file spells it. | Text | — | 200 | 0 | |
ISO Codecountry_codeIdentifier | The ISO 3166-1 alpha-3 code, added by this site. Every table here joins on it. | Text · 3 letters | — | 200 | 0 | |
Deaths in the first 28 days (per 1,000 live births)neonatal_mortalityHeadline | The headline figure: Deaths in the first 28 days (per 1,000 live births). | Number · up to 15 decimals | 0.54429 San Marino39.46577  South Sudanmiddle 8.13406 | 200 | 0 | |
Lower bound (90% uncertainty)lowerwhiskerMeasure | Lower end of the 90% uncertainty interval around the estimate, in deaths in the first 28 days per 1,000 live births. | Number · up to 15 decimals | 0.1231San Marino31.9122 Nigeriamiddle 5.0304 | 200 | 0 | |
Upper bound (90% uncertainty)upperwhiskerMeasure | Upper end of the 90% uncertainty interval around the estimate, in deaths in the first 28 days per 1,000 live births. | Number · up to 15 decimals | 0.915 Japan124.292South Sudanmiddle 11.471 | 200 | 0 |
Profiled from the newest file. Range: the lowest and highest value, with the country holding it when only one does. Spread: countries in ten equal steps from lowest to highest. A higher value is the worse result.
03200 countries across every year
Who is covered
How many countries each year holds, continent by continent, who joined and who left, and which places this site covers that the dataset never has.
| 2013 | 2014 | 2015 | 2016 | 2017 | 2018 | 2019 | 2020 | 2021 | 2022 | 2023 | 2024 | |
|---|---|---|---|---|---|---|---|---|---|---|---|---|
| Africa | 54 | 54 | 54 | 54 | 54 | 54 | 54 | 54 | 54 | 54 | 54 | 54 |
| Americas | 39 | 39 | 39 | 39 | 39 | 39 | 39 | 39 | 39 | 39 | 39 | 39 |
| Asia | 48 | 48 | 48 | 48 | 48 | 48 | 48 | 48 | 48 | 48 | 48 | 48 |
| Europe | 43 | 43 | 43 | 43 | 43 | 43 | 43 | 43 | 43 | 43 | 43 | 43 |
| Oceania | 16 | 16 | 16 | 16 | 16 | 16 | 16 | 16 | 16 | 16 | 16 | 16 |
| All | 200 | 200 | 200 | 200 | 200 | 200 | 200 | 200 | 200 | 200 | 200 | 200 |
The newest 12 of 56 years.
Who joined and who left
- 1989
 + Angola
 + Anguilla
 + Andorra
 + Belarus
 + Brunei
 + Bhutan
 + China
 + Cook Islands
 + Cyprus
 + Fiji
 + Micronesia
 + Gambia
 + Equatorial Guinea
 + Grenada
 + Iran
 + Kiribati
 + Monaco
 + Marshall Islands
 + Myanmar
 + Montenegro
 + Montserrat
 + Niue
 + Nauru
 + Palau
 + North Korea
 + Qatar
 + Romania
 + Russia
 + Saudi Arabia
 + Solomon Islands
 + Sierra Leone+ San Marino
 + Serbia+ South Sudan
 + Suriname
 + Turks and Caicos Islands
 + Tajikistan
 + Tonga
 + Tuvalu
 + Uzbekistan
 + Venezuela
 + British Virgin Islands
 + Vanuatu
 + Samoa
 + Kosovo
- 1988
 + Estonia
 + Turkmenistan
- 1987
 + Afghanistan
 + Guinea-Bissau
 + Palestine
- 1986
 + Maldives
 + Mongolia
 + Seychelles
 + Timor-Leste
- 1985
 + Bosnia and Herzegovina
 + Kuwait
 + El Salvador
 + São Tomé and Príncipe
- 1984
 + DR Congo
 + Ukraine
- 1983
 + Azerbaijan
 + Iraq
 + Somalia
 + Eswatini
- 1982
 + Republic of the Congo
 + Czechia
 + Croatia
 + Laos
 + Moldova
 + North Macedonia
 + Slovakia
 + Slovenia
Not in this dataset · 25 places this site covers
UN IGME gives no figure for these in any year held here. It is the publisher’s choice of scope, and each place’s profile shows what is measured.







04Provenance
Where it comes from
The path from the publisher to this page, and what was checked and changed on the way.
1 · Publisher
UN Inter-agency Group for Child Mortality Estimation (UN IGME)
2 · Their file
UN IGME 2025 — neonatal mortality, 2024
3 · Read by this site
September 29, 2026
Imported by a script that parses each figure and writes it down unrounded.4 · Stored as
56 files, one per year
Each downloads as a CSV, or every year together as neonatal-mortality-all-editions-nations-inquiry.csv5 · Used on
Its statistic page, and every profile it measures
Precision
The headline is stored to 15 decimals, as published.
Rounded by this site
Never. Tables on screen may show fewer decimals; the files never do.
Changed by this site
Reshaped into one row per country: regional and income-group totals are left out, only the columns listed are kept, each row gets its ISO 3166 code, and some country names are brought to one spelling. No value is recalculated, rescaled or rounded.
From the UN Inter-agency Group for Child Mortality Estimation, read out of UNICEF’s own SDMX warehouse (CME_MRM0) — the same route as under-five and infant mortality — rather than the World Bank’s copy, which rounds to one decimal.
05Reuse
Licence and credit
What the publisher’s licence lets you do, what it asks of you, and a credit line and citation ready to copy.
Licence · checked September 29, 2026
- Share and redistribute it
- Adapt it and build on it
- Use it commercially
- Credit the publisher
- Say what you changed
The version of CC BY written for intergovernmental organisations. Credit the publisher and say what you changed.
A credit line
Source: UN Inter-agency Group for Child Mortality Estimation (UN IGME), Neonatal Mortality Rate, via Nations Inquiry.
Cite this dataset
UN Inter-agency Group for Child Mortality Estimation (UN IGME). Neonatal Mortality Rate, 1969–2024 [data set]. As held by Nations Inquiry, https://nationsinquiry.com/datasets/neonatal-mortality
The publisher’s own citation: UN Inter-agency Group for Child Mortality Estimation. Levels and Trends in Child Mortality. New York: UNICEF.
Plain-language summary, not legal advice. The licence text is what binds.
06Where it is used
Around the site
Where these numbers appear on this site, and the datasets nearest to it.
Charted
Neonatal Mortality Rate by countryWho is highest, the map, the spread, who rose and fell, and the records.
Subjects
Near neighbours
- Life Expectancy at BirthUN DESA Population Division · 74 held · 1950–2023
- Under-Five Mortality RateUN IGME · 73 held · 1952–2024
- Prevalence of Severe Food InsecurityFAO · 10 held · 2015–2024
07Questions
Neonatal Mortality Rate: questions and answers
What is the Neonatal Mortality Rate?
The neonatal mortality rate is how many babies out of every thousand born alive die in their first 28 days. Most deaths in the first year of life happen in this first month, which makes it the measure most directly tied to care at birth — a skilled attendant, a clean delivery, warmth, and help with breathing and infection.
Which years of the Neonatal Mortality Rate can I download?
All 56, from 1969 to 2024, each as a CSV file, or every year together in one CSV.
Does UN IGME rank countries on it?
No. UN IGME publishes values only. The positions shown on this site are derived by ordering the published values, and are labelled as ours.
Can I use it commercially?
Yes, under CC BY 3.0 IGO, with credit to UN IGME. The licence text is linked on this page.