Anthropic · Anthropic AI Usage Index
Claude usage relative to population by country
How much does each country use Anthropic's Claude, relative to its working-age population?
Of the 121 countries compared in 2026, Australia had the highest reading, 6.40, and Tanzania had the lowest reading, 0.07. In the middle country the figure was 0.96.
Share
Part ofDigital & Technology
Claude usage relative to population · 2026
Context statistic

Highest of 121Australia
6.40012026 · values only
The highest and the lowest
The three countries with the highest values of 121 compared, the three with the lowest, and the highest on each continent. This statistic has no better end, so no country is shown as leading.
- 1
- 2

- 3

Lowest in 2026
 Tanzania0.07
 Mozambique0.08
 Madagascar0.10
This statistic has no better end: the two ends describe size, not success.
02Every measured country
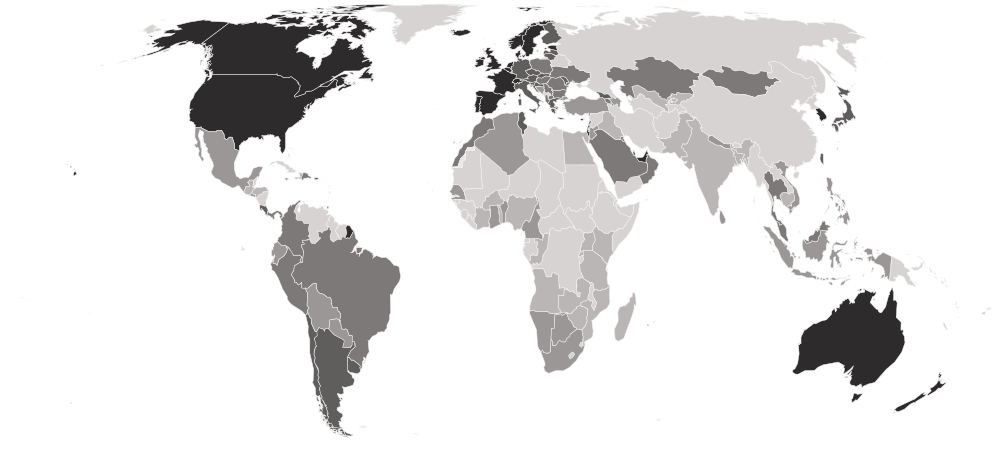
Claude usage relative to population on a map
Each country is shaded by its value, in five groups holding the same number of countries. Hover a country for its value, or select it to open its profile. Below the map, each continent’s middle country.
Darker is a higher value. This statistic has no better end, so the shades describe size, not success.
- 0.07–0.37
- 0.38–0.66
- 0.67–1.37
- 1.40–2.61
- 2.69–6.40
- No reading in 2026
- Europe
2.33
the middle country, of 36 measured · 49 members
Switzerland5.02 Bosnia and Herzegovina0.61
Highest and lowest reading in Europe.
- Americas
1.01
the middle country, of 22 measured · 48 members
 Canada4.13
 Haiti0.14
Highest and lowest reading in Americas.
- Asia
0.73
the middle country, of 35 measured · 52 members
Singapore5.81 Bangladesh0.11
Highest and lowest reading in Asia.
- Africa
0.32
the middle country, of 26 measured · 55 members
 Mauritius1.74Tanzania0.07
Highest and lowest reading in Africa.
- Oceania
2 of 21 measured — too few for a middle: Australia, New Zealand.
Australia6.40 New Zealand4.84
Highest and lowest reading in Oceania.
- Every region
19 sub-regions, highest middle country first
- Western Europe
3.90
the middle country, of 7 measured · 9 members
Switzerland5.02 Germany2.40
Highest and lowest reading in Western Europe.
- Northern Europe
3.22
the middle country, of 10 measured · 13 members
 Norway4.04
 Finland2.19
Highest and lowest reading in Northern Europe.
- Southern Europe
1.70
the middle country, of 11 measured · 17 members
 Malta4.00Bosnia and Herzegovina0.61
Highest and lowest reading in Southern Europe.
- Eastern Europe
1.37
the middle country, of 8 measured · 10 members
 Czechia1.84
 Ukraine0.78
Highest and lowest reading in Eastern Europe.
- South America
1.05
the middle country, of 9 measured · 12 members
 Uruguay1.89
 Bolivia0.56
Highest and lowest reading in South America.
- Western Asia
0.94
the middle country, of 16 measured · 19 members
 Cyprus3.08
 Iraq0.24
Highest and lowest reading in Western Asia.
- Caribbean
0.67
the middle country, of 5 measured · 24 members
 Puerto Rico1.68Haiti0.14
Highest and lowest reading in Caribbean.
- Central America
0.61
the middle country, of 6 measured · 8 members
 Costa Rica1.57
 Honduras0.26
Highest and lowest reading in Central America.
- South-eastern Asia
0.53
the middle country, of 7 measured · 11 members
Singapore5.81 Cambodia0.21
Highest and lowest reading in South-eastern Asia.
- Southern Asia
0.31
the middle country, of 5 measured · 9 members
 Sri Lanka0.56Bangladesh0.11
Highest and lowest reading in Southern Asia.
- Western Africa
0.30
the middle country, of 7 measured · 16 members
 Senegal0.41
 Burkina Faso0.15
Highest and lowest reading in Western Africa.
- Eastern Africa
0.15
the middle country, of 9 measured · 19 members
Mauritius1.74Tanzania0.07Highest and lowest reading in Eastern Africa.
- Australia and New Zealand
2 of 2 measured — too few for a middle: Australia, New Zealand.
Australia6.40New Zealand4.84Highest and lowest reading in Australia and New Zealand.
- Central Asia
3 of 5 measured — too few for a middle: Kazakhstan, Kyrgyzstan, Uzbekistan.
 Kazakhstan0.71
 Uzbekistan0.30
Highest and lowest reading in Central Asia.
- Eastern Asia
4 of 8 measured — too few for a middle: Japan, Mongolia, South Korea, Taiwan.
 South Korea3.78
 Mongolia1.37
Highest and lowest reading in Eastern Asia.
- Middle Africa
3 of 9 measured — too few for a middle: Angola, Cameroon, Republic of the Congo.
 Cameroon0.38
 Angola0.10
Highest and lowest reading in Middle Africa.
- Northern Africa
4 of 6 measured — too few for a middle: Algeria, Egypt, Morocco, Tunisia.
 Tunisia1.40
 Egypt0.36
Highest and lowest reading in Northern Africa.
- Northern America
2 of 4 measured — too few for a middle: Canada, United States.
Canada4.13 United States3.87
Highest and lowest reading in Northern America.
- Southern Africa
3 of 5 measured — too few for a middle: Botswana, Namibia, South Africa.
 Botswana0.52
 Namibia0.44
Highest and lowest reading in Southern Africa.
03The whole field at once
The spread
121 countries, one dot each, on one scale — further right is a higher value. Half the countries are above 0.96; a quarter are above 2.08, and a quarter below 0.43. The bar in each row marks that continent’s middle country.
04All 121 ever measured
Every country
In order, highest value first. No rank or position is shown: too many countries share the same value for an order to mean anything. Neither end is better. This measures one company's product, not AI use in general: countries where the product is not offered do not appear, and a low value can reflect the company's position in a market as much as how much people there use AI. A country appears only when its conversations clear Anthropic's privacy threshold, so a missing country is unpublished, not zero. Microsoft's AI user share, on the same subject, counts the use of any company's AI tools.
Showing 25 of 121 countries

































































Values for 2026.
05In this edition
Claude usage relative to population in records
The extremes of the statistic. A record reached by more than one country names none of them.
Highest reading
6.40
Claude usage index (1 = in proportion to working-age population)
Lowest reading
0.07
Claude usage index (1 = in proportion to working-age population)
06The measure
About claude usage relative to population
How much a country uses one company's AI assistant, Anthropic's Claude, relative to its size: its share of Claude conversations divided by its share of the world's people aged 15 to 64. A value of 1 means use in proportion to population; 2 means twice that. Anthropic publishes it in its Economic Index.
What the number is: Claude usage index (1 = in proportion to working-age population).
07Where it fits
Connections
Its part in the Country Index, the statistics whose values line up most closely with it across countries, and others on the same subject.
In the Country Index
Context, with no vote
This statistic is published in full under Digital & Technology, but does not help decide any Country Index standing.
Moves with
Where claude usage relative to population is higher, these tend to be higher too.
- Human Development IndexKeyUNDP Human Development Report Office · 119 countries in commonρ 0.94
- Productive Capacities IndexUNCTAD · 119 countries in commonρ 0.93
- Actual Individual Consumption per Capita (PPP)World Bank Group · 119 countries in commonρ 0.93
Moves against
Where claude usage relative to population is higher, these tend to be lower.
- Mortality Rate, Ages 5–14UN IGME · 119 countries in commonρ −0.90
- Gender Inequality IndexUNDP Human Development Report Office · 117 countries in commonρ −0.90
- Stillbirth RateUN IGME · 119 countries in commonρ −0.88
Rank correlation (ρ, from −1 to 1) across countries, on each statistic’s newest edition, out of 328 statistics sharing at least 80 countries with this one. Two statistics that move together do not cause each other.
08Keep reading
Explore further
The subject
The data, edition by edition
The countries at either end
09Questions
Claude usage relative to population: questions and answers
Which country has the highest claude usage relative to population?
Australia, at 6.40, among the 121 countries compared in 2026.
Which country has the lowest claude usage relative to population?
Tanzania, at 0.07, among the 121 countries compared in 2026.
How many countries does the Anthropic AI Usage Index cover?
121 in 2026.
What is the world average claude usage relative to population?
This site does not calculate a world average, which would depend on how countries are weighted. In the middle country of the 121 compared in 2026, the figure was 0.96.
Is this Anthropic’s own ranking?
No ranking is shown. Anthropic publishes values only, and too many countries share the same value for an ordering to mean anything, so none is derived.
How often is the Anthropic AI Usage Index published?
This site holds one edition, describing 2026.
Where does the data come from, and can I download it?
From Anthropic, under CC BY (version not stated). From the Anthropic Economic Index dataset Anthropic publishes on Hugging Face, filtered to the country-level index. Values are stored as published; Anthropic rounds them to two decimals. Every edition is on this site’s Datasets pages as a full table, and downloads as a CSV file with every value unrounded.
10Method
Sources, method and citation
Source
Anthropic AI Usage Index — Anthropic
From the Anthropic Economic Index dataset Anthropic publishes on Hugging Face, filtered to the country-level index. Values are stored as published; Anthropic rounds them to two decimals.
Newest edition
Report year 2026Data year 2026
Cite the source as: Massenkoff, M., Lyubich, E., Sacher, S., Hitzig, Z., Zhang, S., Heller, R., & McCrory, P. (2026). Anthropic Economic Index report: Cadences. Anthropic. https://www.anthropic.com/research/economic-index-june-2026-report
Licence: CC BY (version not stated), checked 2026-09-29.
How this page reads the numbers
- No rank or position is shown: Anthropic publishes values only, and too many countries share the same value for an ordering to mean anything.
- This statistic has no better end, so the page describes higher and lower values and never calls a country a leader.
- A country is named at an end only when it holds that value alone. Where several share it, the page says how many and names none first.
- Values are stored exactly as published and trimmed only for display. “The middle country” is the median of the countries measured, not a world average.
The file itself, column by column — where it came from, what each column holds, and every edition as a CSV — is on its dataset page.
Cite this page
Nations Inquiry (2026). Claude usage relative to population by country: Anthropic AI Usage Index, data from Anthropic. https://nationsinquiry.com/statistics/anthropic-ai-usage-index