World Bank Group · Voice and Accountability
Voice and accountability by country
How freely can people choose their government and speak their minds?
Norway placed first of the 206 countries compared in 2025, at 1.8246, and Eritrea last, at -2.3479. In the middle country the figure was -0.0222. Among the 198 countries measured in every edition since 1996, the middle one moved from -0.1342 to -0.0673.
Voice and accountability · 2025
Context statistic
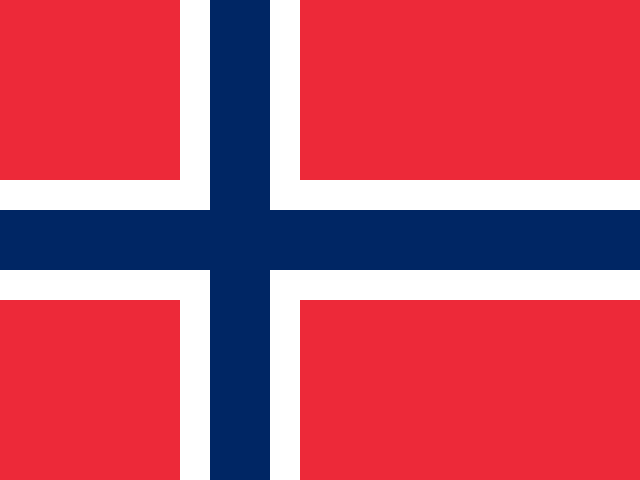
Highest of 206Norway
1.8246012025 · position · derived
Who leads
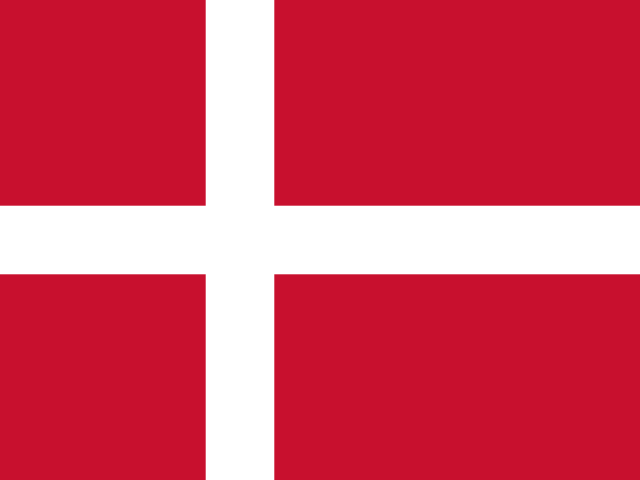
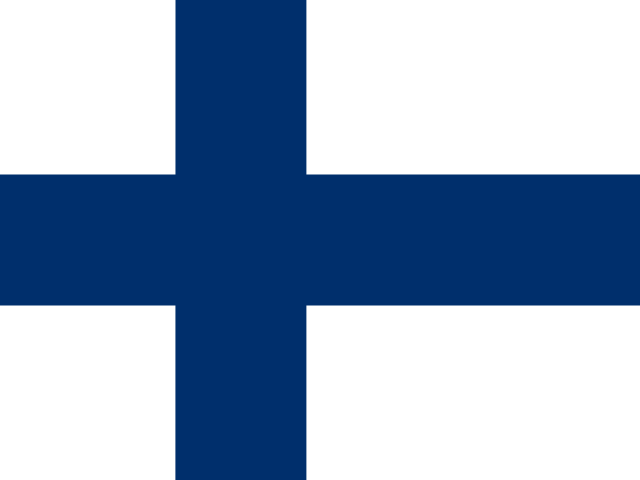
The three countries at the highest end of 206 compared, the three at the other end, and the first on each continent.
 1
1Photo: Ximonic , Simo Räsänen · CC BY-SA 3.0, greyscale
 2
2Photo: User:Aconcagua · CC BY-SA 3.0, greyscale
 3
3Photo: Joonas Lyytinen · CC BY-SA 2.5, greyscale
Lowest in 2025
- 206
 Eritrea-2.3479
 - 205
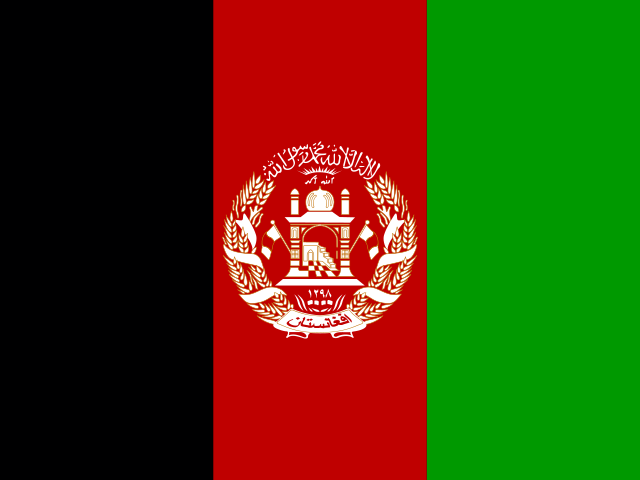 Afghanistan-2.1830
 - 204
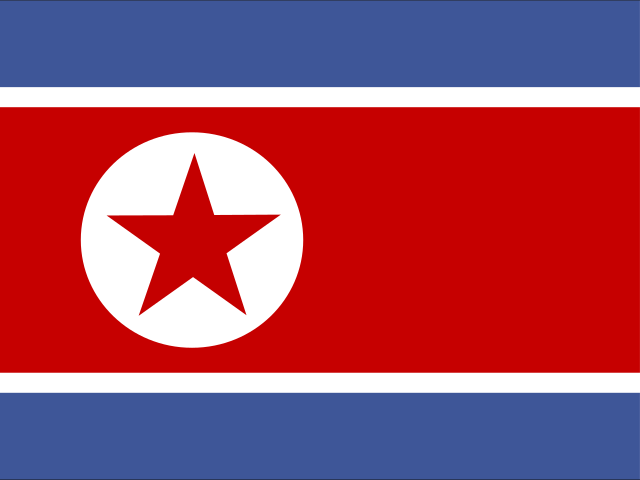 North Korea-2.1252
Positions out of 206. Where a country sits says how it compares with the others measured, and nothing about why.
Highest on each continent
- Africa
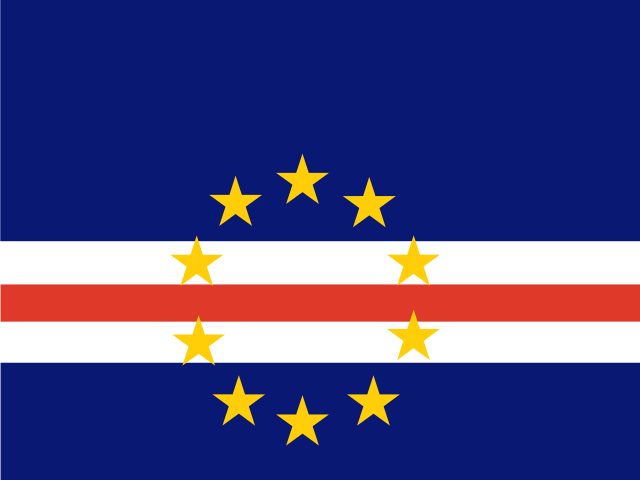 Cabo Verde0.8806
 - Americas
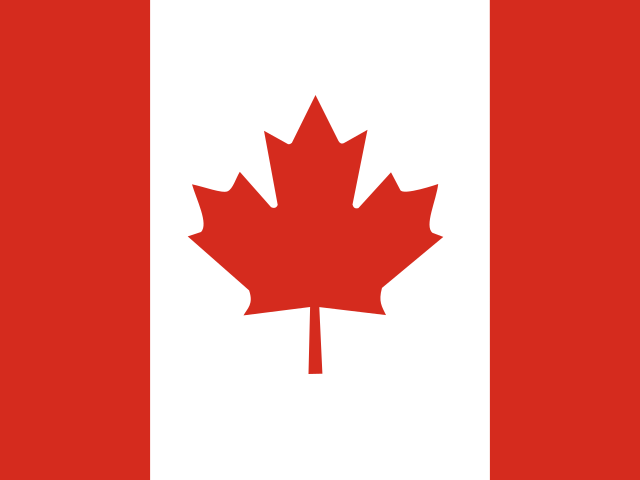 Canada1.4951
 - Asia
 Japan1.1072
 - EuropeNorway1.8246
- Oceania
 New Zealand1.6100
 - Every region
02Every measured country
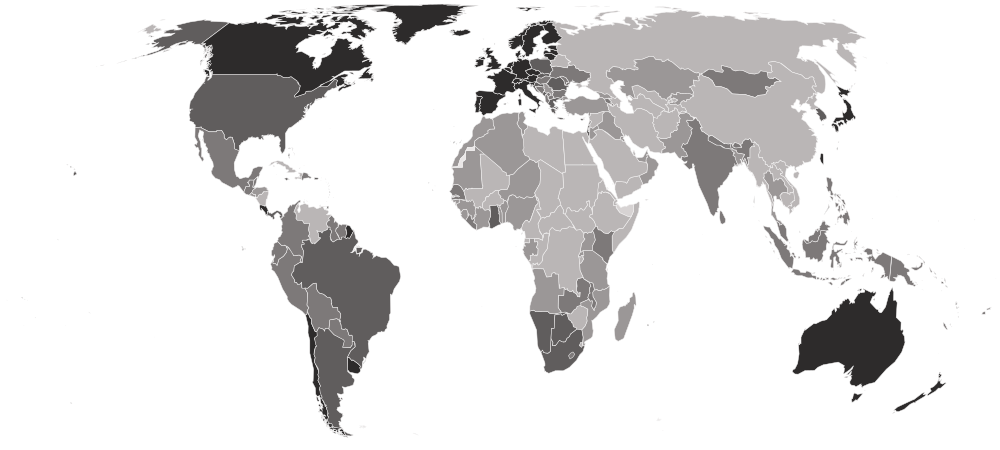
Voice and accountability on a map
Each country is shaded by its value, in five groups holding the same number of countries. Hover a country for its value, or select it to open its profile. Below the map, each continent’s middle country.
Darker is a higher value — the better end.
- -2.3479–-1.2037
- -1.1893–-0.3406
- -0.3367–0.3427
- 0.3603–0.9226
- 0.9377–1.8246
- No reading in 2025 (5 measured in an earlier edition)
- Europe
1.1066
the middle country, of 44 measured · 49 members
Norway1.8246 Belarus-1.7388
Highest and lowest reading in Europe.
- Oceania
0.8888
the middle country, of 18 measured · 21 members
New Zealand1.6100 Papua New Guinea-0.2356
Highest and lowest reading in Oceania.
- Americas
0.4476
the middle country, of 39 measured · 48 members
Canada1.4951 Nicaragua-1.7618
Highest and lowest reading in Americas.
- Asia
-0.8446
the middle country, of 51 measured · 52 members
Japan1.1072Afghanistan-2.1830Highest and lowest reading in Asia.
- Africa
-0.9511
the middle country, of 54 measured · 55 members
Cabo Verde0.8806Eritrea-2.3479Highest and lowest reading in Africa.
- Every region
22 sub-regions, highest middle country first
- Northern Europe
1.4828
the middle country, of 10 measured · 13 members
Norway1.8246 Latvia1.1190
Highest and lowest reading in Northern Europe.
- Western Europe
1.4270
the middle country, of 9 measured · 9 members
 Luxembourg1.6004
 Monaco0.9377
Highest and lowest reading in Western Europe.
- Micronesia
0.9226
the middle country, of 5 measured · 7 members
 Kiribati1.0348
 Nauru0.5405
Highest and lowest reading in Micronesia.
- Polynesia
0.8888
the middle country, of 6 measured · 7 members
 Tuvalu1.2582
 Niue-0.1971
Highest and lowest reading in Polynesia.
- Southern Europe
0.7936
the middle country, of 15 measured · 17 members
 Portugal1.2716
 Serbia-0.4145
Highest and lowest reading in Southern Europe.
- Caribbean
0.5643
the middle country, of 16 measured · 24 members
2 share 1.1136
 Cuba-1.6167
Highest and lowest reading in Caribbean.
- Southern Africa
0.3735
the middle country, of 5 measured · 5 members
 South Africa0.6809
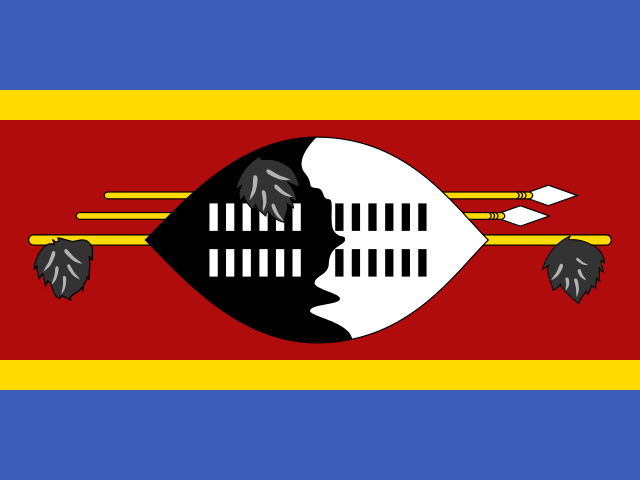 Eswatini-1.4537
Highest and lowest reading in Southern Africa.
- Eastern Europe
0.2657
the middle country, of 10 measured · 10 members
 Czechia1.1775Belarus-1.7388
Highest and lowest reading in Eastern Europe.
- Melanesia
0.2157
the middle country, of 5 measured · 5 members
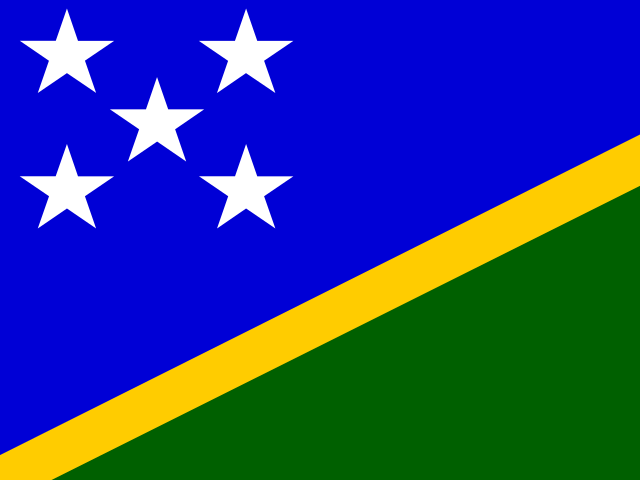 Solomon Islands0.6224Papua New Guinea-0.2356
Highest and lowest reading in Melanesia.
- South America
0.0527
the middle country, of 12 measured · 12 members
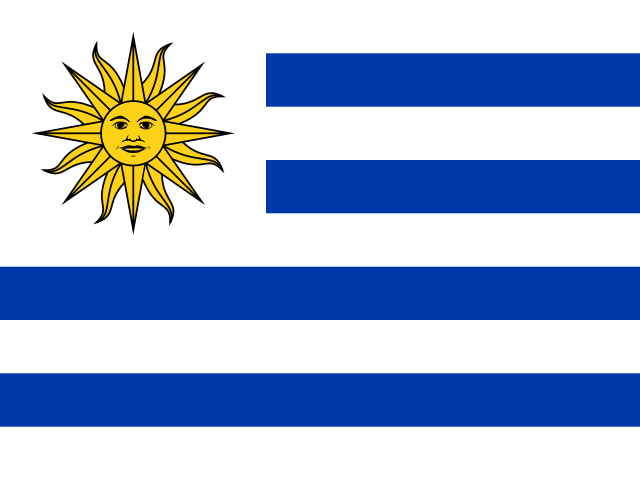 Uruguay1.2144
 Venezuela-1.7472
Highest and lowest reading in South America.
- Eastern Asia
-0.0923
the middle country, of 8 measured · 8 members
Japan1.1072North Korea-2.1252Highest and lowest reading in Eastern Asia.
- Central America
-0.3094
the middle country, of 8 measured · 8 members
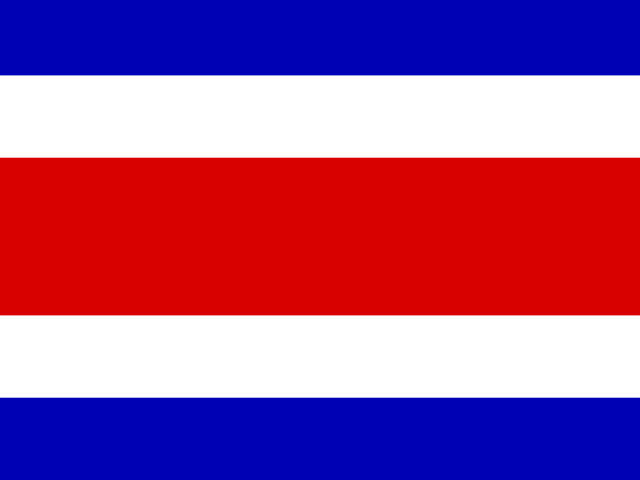 Costa Rica1.0375Nicaragua-1.7618
Highest and lowest reading in Central America.
- Southern Asia
-0.4582
the middle country, of 9 measured · 9 members
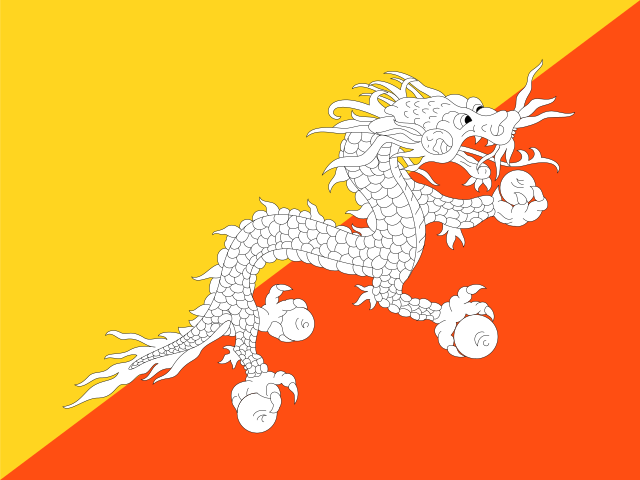 Bhutan0.2113Afghanistan-2.1830
Highest and lowest reading in Southern Asia.
- South-eastern Asia
-0.5174
the middle country, of 11 measured · 11 members
 Timor-Leste0.4327
 Myanmar-2.0902
Highest and lowest reading in South-eastern Asia.
- Western Africa
-0.6018
the middle country, of 16 measured · 16 members
Cabo Verde0.8806 Mali-1.2523
Highest and lowest reading in Western Africa.
- Eastern Africa
-0.9554
the middle country, of 18 measured · 19 members
 Seychelles0.6780Eritrea-2.3479
Highest and lowest reading in Eastern Africa.
- Western Asia
-1.0897
the middle country, of 18 measured · 19 members
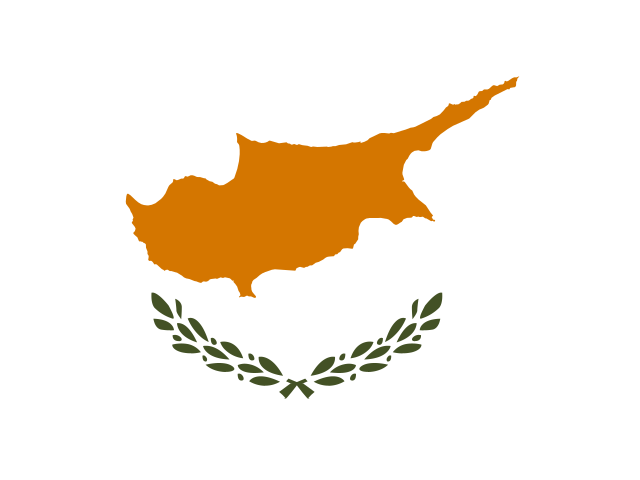 Cyprus0.8997
 Yemen-1.7464
Highest and lowest reading in Western Asia.
- Central Asia
-1.2488
the middle country, of 5 measured · 5 members
 Kyrgyzstan-0.8446
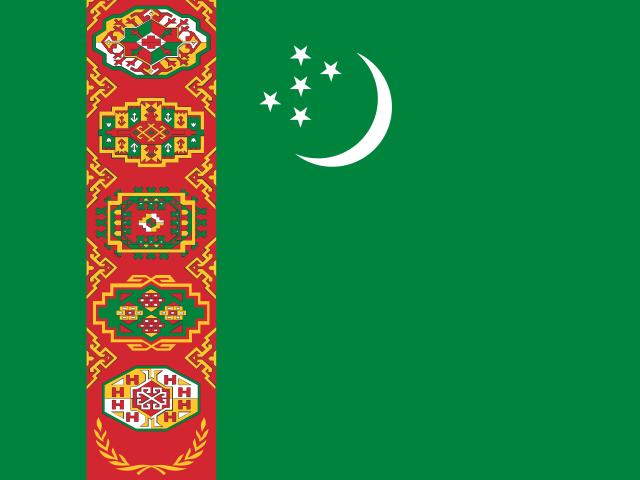 Turkmenistan-2.0105
Highest and lowest reading in Central Asia.
- Middle Africa
-1.2558
the middle country, of 9 measured · 9 members
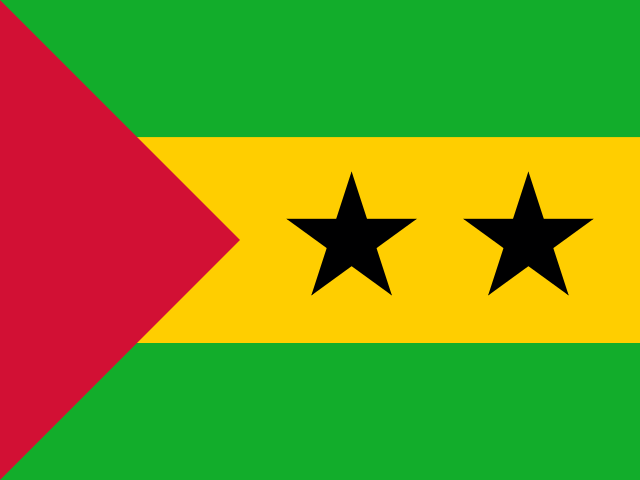 São Tomé and Príncipe0.1950
 Equatorial Guinea-1.7931
Highest and lowest reading in Middle Africa.
- Northern Africa
-1.2626
the middle country, of 6 measured · 6 members
 Tunisia-0.6502
 Sudan-1.9910
Highest and lowest reading in Northern Africa.
- Australia and New Zealand
2 of 2 measured — too few for a middle: Australia, New Zealand.
New Zealand1.6100 Australia1.4182
Highest and lowest reading in Australia and New Zealand.
- Northern America
3 of 4 measured — too few for a middle: Canada, Greenland, United States.
Canada1.4951 United States0.6448
Highest and lowest reading in Northern America.
03The whole field at once
The spread
206 countries, one dot each, on one scale — further right is a higher value. Half the countries are above -0.0222; a quarter are above 0.8155, and a quarter below -1.0615. The bar in each row marks that continent’s middle country.
04All 211 ever measured
Every country
In order, highest value first. “=” marks a position shared with another country. World Bank Group ranks nobody on this measure; the position is derived here by ordering the published values. The Bank’s 0–100 governance score is the estimate rescaled onto a fixed scale anchored by benchmark countries, where 100 is the best absolute performance — it is not a percentile and not a league position, so 90 means neither “above 90% of countries” nor “90th”.
Showing 25 of 211 countries































































Values for 2025. The change column compares 2025 with 2024 only; the sparkline covers the recent editions.
051996–2025 · 27 editions
Over time
Each point is one annual estimate. The scale is a z-score: the world average is fixed at 0 every year, so a country can improve in absolute terms and still fall, and the scale cannot say whether the world as a whole got better.
- the middle country
- the middle half of countries
- the middle of the 198 countries measured every time
- each continent’s middle country
The same, year by year
| Year | Countries | Middle country | Middle half | Measured every time |
|---|---|---|---|---|
| 2025 | 206 | -0.0222 | -1.0615 – 0.8155 | -0.0673 |
| 2024 | 208 | 0.0154 | -0.9836 – 0.8832 | -0.0133 |
| 2023 | 208 | 0.0239 | -0.9500 – 0.8596 | -0.0080 |
| 2022 | 208 | 0.0531 | -0.9213 – 0.8491 | 0.0067 |
| 2021 | 208 | 0.0673 | -0.8951 – 0.8644 | 0.0073 |
| 2020 | 208 | 0.1365 | -0.8423 – 0.8389 | 0.0507 |
| 2019 | 208 | 0.1359 | -0.8106 – 0.8999 | 0.0537 |
| 2018 | 206 | 0.1299 | -0.7779 – 0.7895 | 0.0777 |
| 2017 | 207 | 0.0902 | -0.7966 – 0.7781 | 0.0645 |
| 2016 | 207 | 0.1051 | -0.7917 – 0.7829 | 0.0850 |
| 2015 | 209 | 0.0899 | -0.7608 – 0.7934 | 0.0774 |
| 2014 | 209 | 0.1058 | -0.7753 – 0.8745 | 0.0726 |
| 2013 | 209 | 0.0672 | -0.8080 – 0.8629 | 0.0444 |
| 2012 | 209 | 0.0509 | -0.7468 – 0.8778 | 0.0319 |
| 2011 | 209 | 0.0531 | -0.7398 – 0.8763 | 0.0223 |
| 2010 | 208 | 0.0743 | -0.7537 – 0.9266 | 0.0419 |
| 2009 | 208 | 0.1337 | -0.7520 – 0.9509 | 0.0940 |
| 2008 | 206 | 0.1495 | -0.7060 – 0.9632 | 0.0797 |
| 2007 | 206 | 0.1012 | -0.6932 – 0.9380 | 0.0490 |
| 2006 | 206 | 0.1001 | -0.7031 – 0.9215 | 0.0735 |
| 2005 | 206 | 0.0690 | -0.7711 – 0.9123 | 0.0277 |
| 2004 | 205 | 0.0238 | -0.8909 – 0.7134 | -0.0113 |
| 2003 | 200 | -0.0190 | -0.8944 – 0.8679 | -0.0190 |
| 2002 | 200 | -0.0222 | -0.9234 – 0.9047 | -0.0335 |
| 2000 | 200 | -0.1898 | -1.0545 – 0.8434 | -0.1898 |
| 1998 | 200 | -0.1830 | -1.0711 – 0.8296 | -0.1830 |
| 1996 | 199 | -0.1231 | -1.0066 – 0.8283 | -0.1342 |
062024 → 2025
Who rose and fell
The biggest changes in value between the two newest editions. Places are shown second, because they also move when other countries do.
Improved most
before → after Cayman Islands0.8090 → 1.1136 · 55th → 29th+0.3046
 Bangladesh-0.9967 → -0.7209 · 158th → 139th+0.2757
 Syria-1.8606 → -1.6187 · 202nd → 187th+0.2419
 South Korea0.7557 → 0.8756 · 58th → 49th+0.1199
 Sri Lanka-0.1111 → 0.0078 · 114th → 102nd+0.1188
Declined most
before → after- Niue1.2046 → -0.1971 · 24th → 115th−1.4017
- United States0.9093 → 0.6448 · 49th → 59th−0.2646
 Guinea-Bissau-0.8135 → -1.0753 · 147th → 156th−0.2619
 Burkina Faso-0.9866 → -1.2037 · 157th → 165th−0.2171
- Cuba-1.4128 → -1.6167 · 181st → 186th−0.2039
206 countries were measured in both 2024 and 2025. The field changed from 208 to 206 countries, so a place can move for reasons that have nothing to do with the country itself.
07Across every edition
Voice and accountability in records
The extremes of the statistic. A record reached by more than one country names none of them.
Highest reading on record
1.8702
Voice and Accountability estimate (−2.5 to 2.5)
Lowest reading on record
-2.4395
Voice and Accountability estimate (−2.5 to 2.5)
Biggest improvement between editions
+1.8892
-1.9555 → -0.0663
Biggest decline between editions
−1.4017
1.2046 → -0.1971
Most improved since first measured
+2.5544
-2.1217 → 0.4327
At the top most often
15 of 27
editions, alone at the first-listed end
08The measure
About voice and accountability
Voice and Accountability is the World Bank’s estimate of how far a country’s people can choose their own government, and whether they have freedom of expression, freedom of association and a free press. Scored from −2.5 to 2.5, it is the widest measure of the subject that exists — 200 countries, back to 1996.
What the number is: Voice and Accountability estimate (−2.5 to 2.5).
09Where it fits
Connections
Its part in the Country Index, the statistics whose values line up most closely with it across countries, and others on the same subject.
In the Country Index
Context, with no vote
This statistic is published in full under Governance & Institutions and Democracy & Civil Liberties, but does not help decide any Country Index standing.
Governance & InstitutionsDemocracy & Civil LibertiesWhich statistics vote, and why
Moves with
Where voice and accountability is higher, these tend to be higher too.
- Liberal Democracy IndexV-Dem Institute, University of Gothenburg · 175 countries in commonρ 0.97
- V-Dem Electoral Democracy IndexKeyV-Dem Institute, University of Gothenburg · 175 countries in commonρ 0.96
- Egalitarian Democracy IndexV-Dem Institute, University of Gothenburg · 175 countries in commonρ 0.96
Moves against
Where voice and accountability is higher, these tend to be lower.
- Political Corruption IndexV-Dem Institute, University of Gothenburg · 175 countries in commonρ −0.78
- Gender Social Norms IndexUNDP Human Development Report Office · 80 countries in commonρ −0.72
- Informal Employment RateILO · 97 countries in commonρ −0.72
Rank correlation (ρ, from −1 to 1) across countries, on each statistic’s newest edition, out of 190 statistics sharing at least 80 countries with this one. Two statistics that move together do not cause each other.
10Analysis
Charts and analysis on voice and accountability

11Keep reading
Explore further
The countries at either end
More from World Bank Group
- Access to Electricity
- Account Ownership at a Financial Institution
- Adjusted Net Savings
- Agriculture, Forestry and Fishing Value Added (% of GDP)
- Average Time to Clear Exports Through Customs
- Business Ready: Operational Efficiency
- Business Ready: Public Services
- Business Ready: Regulatory Framework
- All statistics
12Questions
Voice and accountability: questions and answers
Which country has the highest voice and accountability?
Norway, at 1.8246, among the 206 countries compared in 2025.
Which country has the lowest voice and accountability?
Eritrea, at -2.3479, among the 206 countries compared in 2025.
How many countries does the Voice and Accountability cover?
206 in 2025, and 211 at least once across all editions. The number measured varies from 199 to 209 between editions.
What is the world average voice and accountability?
This site does not calculate a world average, which would depend on how countries are weighted. In the middle country of the 206 compared in 2025, the figure was -0.0222.
Is this World Bank Group’s own ranking?
No. World Bank Group publishes the values but ranks nobody; the position on this page is derived by Nations Inquiry by ordering the published values, and equal values share a position.
How often is the Voice and Accountability published?
This site holds 27 editions, describing 1996 to 2025.
Where does the data come from, and can I download it?
From World Bank Group, under CC BY 4.0. One of the six Worldwide Governance Indicators; the same figures also appear as a column of the Government Effectiveness table, where all six dimensions can be read side by side. Every edition is on this site’s Datasets pages as a full table, and downloads as a CSV file with every value unrounded.
13Method
Sources, method and citation
Source
Voice and Accountability — World Bank Group
One of the six Worldwide Governance Indicators; the same figures also appear as a column of the Government Effectiveness table, where all six dimensions can be read side by side.
Newest edition
Report year 2025Data year 2025
Cite the source as: World Bank. Worldwide Governance Indicators. Washington, DC: World Bank Group.
Licence: CC BY 4.0, checked 2026-09-07.
How this page reads the numbers
- World Bank Group ranks nobody on this measure. The position is derived by Nations Inquiry by ordering the published values; equal values share a position.
- Which end is better follows the publisher’s own reading of the measure.
- A country is named at an end only when it holds that value alone. Where several share it, the page says how many and names none first.
- Values are stored exactly as published and trimmed only for display. “The middle country” is the median of the countries measured, not a world average.
The file itself, column by column — where it came from, what each column holds, and every edition as a CSV — is on its dataset page.
Photographs
The countries at the top of this statistic, from their profiles: Wikimedia Commons, shown in greyscale, each used under the licence named.
- Norway — Ximonic , Simo Räsänen, CC BY-SA 3.0
- Denmark — User:Aconcagua, CC BY-SA 3.0
- Finland — Joonas Lyytinen, CC BY-SA 2.5
Cite this page
Nations Inquiry (2026). Voice and accountability by country: Voice and Accountability, data from World Bank Group. https://nationsinquiry.com/statistics/voice-and-accountability