UN DESA Population Division · Demand for Family Planning Satisfied by Modern Methods
Demand for family planning satisfied by country
Of the women who want to avoid a pregnancy, how many use a modern method?
Canada placed first of the 196 countries compared in 2023, at 92.4%, and Somalia last, at 8.4%. In the middle country the figure was 71.3%. Among the 196 countries measured in every edition since 1990, the middle one moved from 51.0% to 71.3%.
Share
Demand for family planning satisfied · 2023
Context statistic

Highest of 196Canada
92.4%012023 · position · derived
Who leads
The three countries at the highest end of 196 compared, the three at the other end, and the first on each continent.
 1
Photo: User:Florian Fuchs · CC BY 3.0, greyscale
 2
Photo: Seebeer Edited by Nicholasjf21 · Public domain, greyscale
 3
Photo: Tobi 87 derivative work: Jjtkk · CC BY-SA 3.0, greyscale
Lowest in 2023
- 196
 Somalia8.4%
- 195
 South Sudan21.0%
- 194
 Kosovo23.5%
Positions out of 196. Where a country sits says how it compares with the others measured, and nothing about why.
02Every measured country
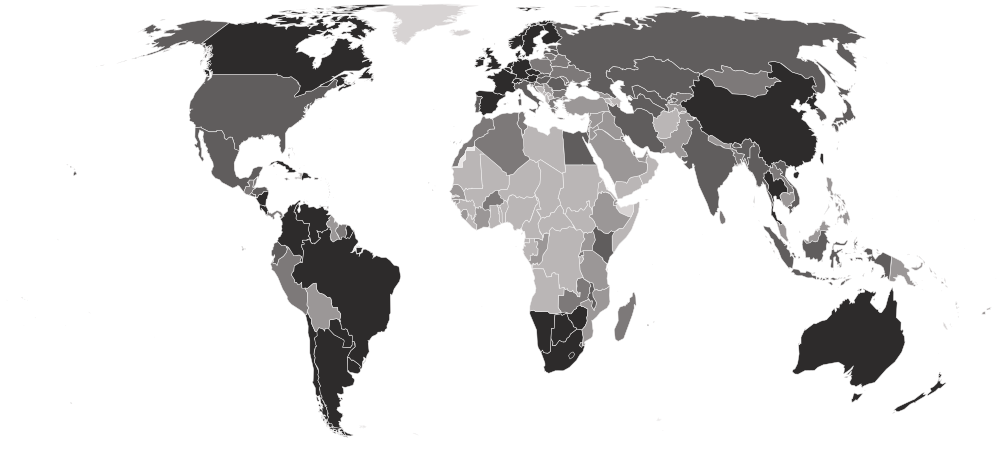
Demand for family planning satisfied on a map
Each country is shaded by its value, in five groups holding the same number of countries. Hover a country for its value, or select it to open its profile. Below the map, each continent’s middle country.
Darker is a higher value — the better end.
- 8.4–50.6%
- 51.2–63.8%
- 64.0–74.9%
- 75.1–81.7%
- 82.1–92.4%
- No reading in 2023
- Americas
77.8%
the middle country, of 41 measured · 48 members
Canada92.4% Haiti50.5%
Highest and lowest reading in Americas.
- Europe
77.7%
the middle country, of 38 measured · 49 members
 France91.3%Kosovo23.5%
Highest and lowest reading in Europe.
- Asia
66.0%
the middle country, of 48 measured · 52 members
 China92.0%
 Azerbaijan34.2%
Highest and lowest reading in Asia.
- Oceania
59.1%
the middle country, of 16 measured · 21 members
 New Zealand87.9%
 Samoa31.4%
Highest and lowest reading in Oceania.
- Africa
52.3%
the middle country, of 53 measured · 55 members
 Botswana86.2%Somalia8.4%
Highest and lowest reading in Africa.
- Every region
22 sub-regions, highest middle country first
- Western Europe
88.7%
the middle country, of 6 measured · 9 members
France91.3% Germany87.7%
Highest and lowest reading in Western Europe.
- Northern Europe
86.3%
the middle country, of 9 measured · 13 members
 Finland90.4%
 Lithuania72.7%
Highest and lowest reading in Northern Europe.
- Southern Africa
83.0%
the middle country, of 5 measured · 5 members
Botswana86.2% Eswatini78.0%
Highest and lowest reading in Southern Africa.
- Eastern Asia
82.7%
the middle country, of 7 measured · 8 members
China92.0% Mongolia70.3%
Highest and lowest reading in Eastern Asia.
- South America
82.3%
the middle country, of 12 measured · 12 members
 Brazil89.7%
 Guyana56.2%
Highest and lowest reading in South America.
- Central America
80.4%
the middle country, of 8 measured · 8 members
 Nicaragua88.3%
 Guatemala70.9%
Highest and lowest reading in Central America.
- Central Asia
76.4%
the middle country, of 5 measured · 5 members
 Uzbekistan81.1%
 Tajikistan55.8%
Highest and lowest reading in Central Asia.
- Caribbean
75.2%
the middle country, of 19 measured · 24 members
 Cuba84.2%Haiti50.5%
Highest and lowest reading in Caribbean.
- Eastern Europe
74.9%
the middle country, of 10 measured · 10 members
 Czechia83.7%
 Moldova64.2%
Highest and lowest reading in Eastern Europe.
- South-eastern Asia
74.3%
the middle country, of 10 measured · 11 members
 Thailand89.0%
 Malaysia52.7%
Highest and lowest reading in South-eastern Asia.
- Southern Asia
73.8%
the middle country, of 9 measured · 9 members
 Bhutan80.4%
 Maldives34.8%
Highest and lowest reading in Southern Asia.
- Northern Africa
70.0%
the middle country, of 6 measured · 6 members
 Egypt80.4%
 Sudan35.8%
Highest and lowest reading in Northern Africa.
- Micronesia
64.2%
the middle country, of 6 measured · 7 members
 Guam74.2%
 Kiribati48.8%
Highest and lowest reading in Micronesia.
- Southern Europe
64.0%
the middle country, of 13 measured · 17 members
 Spain88.7%Kosovo23.5%
Highest and lowest reading in Southern Europe.
- Western Asia
59.4%
the middle country, of 17 measured · 19 members
 Israel69.0%Azerbaijan34.2%
Highest and lowest reading in Western Asia.
- Eastern Africa
57.8%
the middle country, of 17 measured · 19 members
 Zimbabwe85.8%Somalia8.4%
Highest and lowest reading in Eastern Africa.
- Western Africa
49.2%
the middle country, of 16 measured · 16 members
 Cabo Verde77.0%
 Mauritania31.9%
Highest and lowest reading in Western Africa.
- Middle Africa
38.2%
the middle country, of 9 measured · 9 members
 São Tomé and Príncipe61.0%
 Chad25.6%
Highest and lowest reading in Middle Africa.
- Australia and New Zealand
2 of 2 measured — too few for a middle: Australia, New Zealand.
New Zealand87.9% Australia85.8%
Highest and lowest reading in Australia and New Zealand.
- Melanesia
4 of 5 measured — too few for a middle: Fiji, Papua New Guinea, Solomon Islands, Vanuatu.
 Vanuatu60.7%
 Papua New Guinea51.2%
Highest and lowest reading in Melanesia.
- Northern America
2 of 4 measured — too few for a middle: Canada, United States.
Canada92.4% United States80.1%
Highest and lowest reading in Northern America.
- Polynesia
4 of 7 measured — too few for a middle: Cook Islands, Samoa, Tonga, Tuvalu.
 Cook Islands71.2%Samoa31.4%
Highest and lowest reading in Polynesia.
03The whole field at once
The spread
196 countries, one dot each, on one scale — further right is a higher value. Half the countries are above 71.3%; a quarter are above 80.1%, and a quarter below 53.3%. The bar in each row marks that continent’s middle country.
04All 196 ever measured
Every country
In order, highest value first. “=” marks a position shared with another country. UN DESA Population Division ranks nobody on this measure; the position is derived here by ordering the published values. Women who rely on a traditional method, such as withdrawal or periodic abstinence, count as having a need that is not met, so countries where those methods are common sit lower than their access to modern methods alone would suggest. Many countries near the top have few or no surveys of unmet need, so their figures lean heavily on the model and carry wide uncertainty.
Showing 25 of 196 countries














































































































Values for 2023. The change column compares 2023 with 2022 only; the sparkline covers the recent editions.
051990–2023 · 34 reference years
Over time
Each point is the UN's model estimate for one year, 1990 to 2023, with the 95% uncertainty interval around it. The model follows a country's own surveys where they exist and leans on regional trends where they do not, so the line after a country's last survey is the model's projection of it, and the interval widens.
- the middle country
- the middle half of countries
- the middle of the 196 countries measured every time
- each continent’s middle country
The same, year by year
| Year | Countries | Middle country | Middle half | Measured every time |
|---|---|---|---|---|
| 2023 | 196 | 71.3% | 53.3% – 80.1% | 71.3% |
| 2022 | 196 | 70.9% | 52.4% – 80.0% | 70.9% |
| 2021 | 196 | 70.6% | 52.1% – 79.7% | 70.6% |
| 2020 | 196 | 69.9% | 51.7% – 79.5% | 69.9% |
| 2019 | 196 | 69.5% | 51.2% – 78.9% | 69.5% |
| 2018 | 196 | 68.9% | 50.6% – 78.7% | 68.9% |
| 2017 | 196 | 68.3% | 50.1% – 78.6% | 68.3% |
| 2016 | 196 | 67.8% | 49.1% – 78.5% | 67.8% |
| 2015 | 196 | 67.4% | 48.4% – 78.5% | 67.4% |
| 2014 | 196 | 67.0% | 47.8% – 78.3% | 67.0% |
| 2013 | 196 | 66.9% | 46.3% – 77.9% | 66.9% |
| 2012 | 196 | 66.0% | 45.3% – 77.2% | 66.0% |
| 2011 | 196 | 64.8% | 44.5% – 77.0% | 64.8% |
| 2010 | 196 | 64.2% | 43.8% – 76.7% | 64.2% |
| 2009 | 196 | 63.6% | 43.0% – 76.3% | 63.6% |
| 2008 | 196 | 62.9% | 42.0% – 75.7% | 62.9% |
| 2007 | 196 | 62.2% | 41.4% – 75.6% | 62.2% |
| 2006 | 196 | 60.7% | 41.1% – 75.5% | 60.7% |
| 2005 | 196 | 59.5% | 40.5% – 75.3% | 59.5% |
| 2004 | 196 | 58.4% | 39.7% – 74.3% | 58.4% |
| 2003 | 196 | 58.2% | 38.3% – 73.8% | 58.2% |
| 2002 | 196 | 57.8% | 36.9% – 72.9% | 57.8% |
| 2001 | 196 | 57.3% | 36.5% – 72.6% | 57.3% |
| 2000 | 196 | 56.8% | 37.1% – 72.1% | 56.8% |
| 1999 | 196 | 56.0% | 35.4% – 71.4% | 56.0% |
| 1998 | 196 | 55.5% | 33.6% – 70.9% | 55.5% |
| 1997 | 196 | 55.1% | 33.1% – 70.1% | 55.1% |
| 1996 | 196 | 54.6% | 32.5% – 70.0% | 54.6% |
| 1995 | 196 | 54.2% | 31.3% – 69.3% | 54.2% |
| 1994 | 196 | 53.5% | 29.7% – 68.0% | 53.5% |
| 1993 | 196 | 52.9% | 28.1% – 67.1% | 52.9% |
| 1992 | 196 | 52.4% | 27.0% – 66.1% | 52.4% |
| 1991 | 196 | 51.4% | 26.0% – 65.1% | 51.4% |
| 1990 | 196 | 51.0% | 25.4% – 64.1% | 51.0% |
062022 → 2023
Who rose and fell
The biggest changes in value between the two newest editions — reference years recalculated in one report, not two separate publications. Places are shown second, because they also move when other countries do.
Improved most
before → after Saudi Arabia51.8% → 53.3% · 152nd → 147th+1.5
 Benin35.3% → 36.7% · 183rd → 182nd+1.4
 Burundi47.9% → 49.2% · 164th → 163rd+1.3
 Albania32.5% → 33.7% · 188th → 188th+1.2
 Côte d’Ivoire50.4% → 51.6% · 156th → 155th+1.2
Declined most
before → after- Cuba84.5% → 84.2% · 27th → 27th−0.3
 Peru71.1% → 70.9% · 96th → 100th−0.2
 Switzerland88.7% → 88.6% · 9th → 11th−0.1
 Denmark87.3% → 87.2% · 17th → 17th−0.1
196 countries were measured in both 2022 and 2023.
07Across every edition
Demand for family planning satisfied in records
The extremes of the statistic. A record reached by more than one country names none of them.
Highest reading on record
93.4%
Share of women aged 15–49 wanting to avoid pregnancy who use a modern method (%)
Lowest reading on record
2.1%
Share of women aged 15–49 wanting to avoid pregnancy who use a modern method (%)
Biggest improvement between editions
+7.4
33.1% → 40.5%
Biggest decline between editions
−4.7
43.5% → 38.8%
Most improved since first measured
+63.9
14.5% → 78.4%
At the top most often
23 of 34
editions, alone at the first-listed end
08The measure
About demand for family planning satisfied
Of the women who want to stop or delay having children, this is the share using a modern method of contraception — the pill, an implant, an injection, an IUD, condoms or sterilisation. It is the UN's headline measure of whether family planning reaches the women who want it, and it does not depend on how many children a society chooses to have.
What the number is: Share of women aged 15–49 wanting to avoid pregnancy who use a modern method (%).
What it does not measure
It counts any woman using a traditional method as having an unmet need, and it says nothing about the quality of care or whether women could choose the method they wanted.
09Where it fits
Connections
Its part in the Country Index, the statistics whose values line up most closely with it across countries, and others on the same subject.
In the Country Index
Context, with no vote
This statistic is published in full under Health & Wellbeing and Gender & Equality, but does not help decide any Country Index standing.
Health & WellbeingGender & EqualityWhich statistics vote, and why
Moves with
Where demand for family planning satisfied is higher, these tend to be higher too.
- Modern Contraceptive PrevalenceUN DESA Population Division · 196 countries in commonρ 0.95
- Contraceptive Prevalence (Any Method)UN DESA Population Division · 196 countries in commonρ 0.87
- RISE Renewable Energy Policy ScoreESMAP · 140 countries in commonρ 0.65
Moves against
Where demand for family planning satisfied is higher, these tend to be lower.
- Average Household SizeUN DESA Population Division · 131 countries in commonρ −0.68
- Climate Vulnerability (ND-GAIN)KeyNotre Dame Global Adaptation Initiative (ND-GAIN), University of Notre Dame · 182 countries in commonρ −0.59
- Total Fertility RateUN DESA Population Division · 196 countries in commonρ −0.57
Rank correlation (ρ, from −1 to 1) across countries, on each statistic’s newest edition, out of 380 statistics sharing at least 80 countries with this one. Two statistics that move together do not cause each other.
10Keep reading
Explore further
The subject
11Questions
Demand for family planning satisfied: questions and answers
Which country has the highest demand for family planning satisfied?
Canada, at 92.4%, among the 196 countries compared in 2023.
Which country has the lowest demand for family planning satisfied?
Somalia, at 8.4%, among the 196 countries compared in 2023.
How many countries does the Demand for Family Planning Satisfied by Modern Methods cover?
196 in 2023.
What is the world average demand for family planning satisfied?
This site does not calculate a world average, which would depend on how countries are weighted. In the middle country of the 196 compared in 2023, the figure was 71.3%.
Is this UN DESA Population Division’s own ranking?
No. UN DESA Population Division publishes the values but ranks nobody; the position on this page is derived by Nations Inquiry by ordering the published values, and equal values share a position.
How often is the Demand for Family Planning Satisfied by Modern Methods published?
This site holds 34 reference years, 1990–2023, all recalculated in UN DESA Population Division’s 2024 report on one method — not 34 separate publications.
Where does the data come from, and can I download it?
From UN DESA Population Division, under CC BY 3.0 IGO. From the UN Population Division's Estimates and Projections of Family Planning Indicators 2024, a model fitted to the household surveys in its World Contraceptive Use database, read from the Division's own download. Each value keeps the Division's note on whether it falls between two surveys or beyond them. Years after 2023 are forecasts and are excluded. Every edition is on this site’s Datasets pages as a full table, and downloads as a CSV file with every value unrounded.
12Method
Sources, method and citation
Source
Demand for Family Planning Satisfied by Modern Methods — UN DESA Population Division
From the UN Population Division's Estimates and Projections of Family Planning Indicators 2024, a model fitted to the household surveys in its World Contraceptive Use database, read from the Division's own download. Each value keeps the Division's note on whether it falls between two surveys or beyond them. Years after 2023 are forecasts and are excluded.
Newest edition
Report year 2023Data year 2023
Cite the source as: United Nations, Department of Economic and Social Affairs, Population Division (2024). Estimates and Projections of Family Planning Indicators 2024. New York: United Nations.
Licence: CC BY 3.0 IGO, checked 2026-09-29.
How this page reads the numbers
- UN DESA Population Division ranks nobody on this measure. The position is derived by Nations Inquiry by ordering the published values; equal values share a position.
- Which end is better follows the publisher’s own reading of the measure.
- A country is named at an end only when it holds that value alone. Where several share it, the page says how many and names none first.
- Values are stored exactly as published and trimmed only for display. “The middle country” is the median of the countries measured, not a world average.
The file itself, column by column — where it came from, what each column holds, and every edition as a CSV — is on its dataset page.
Photographs
The countries at the top of this statistic, from their profiles: Wikimedia Commons, shown in greyscale, each used under the licence named.
- Canada — User:Florian Fuchs, CC BY 3.0
- China — Seebeer Edited by Nicholasjf21, Public domain
- France — Tobi 87 derivative work: Jjtkk, CC BY-SA 3.0
Cite this page
Nations Inquiry (2026). Demand for family planning satisfied by country: Demand for Family Planning Satisfied by Modern Methods, data from UN DESA Population Division. https://nationsinquiry.com/statistics/family-planning-demand-satisfied