UN DESA Population Division · Adolescent Birth Rate (Ages 15–19)
Adolescent birth rate by country
How many babies are born to girls and young women aged 15 to 19?
Of the 222 countries compared in 2023, Macau had the lowest reading, 0.465, and Central African Republic had the highest reading, 163.093. In the middle country the figure was 27.457. Among the 222 countries measured in every edition since 1950, the middle one moved from 96.218 to 27.457.
Share
Adolescent birth rate · 2023
Context statistic

Lowest of 222Macau
0.465012023 · position · derived
Who leads
The three countries at the lowest end of 222 compared, the three at the other end, and the first on each continent.
 1
Photo: Diego Delso · CC BY-SA 3.0, greyscale
- 2

 3
Photo: Unknown author · CC BY-SA 2.0, greyscale

Highest in 2023
 Central African Republic163.093
 Mozambique153.450
 Equatorial Guinea150.442
Where a country sits says how it compares with the others measured, and nothing about why.
02Every measured country
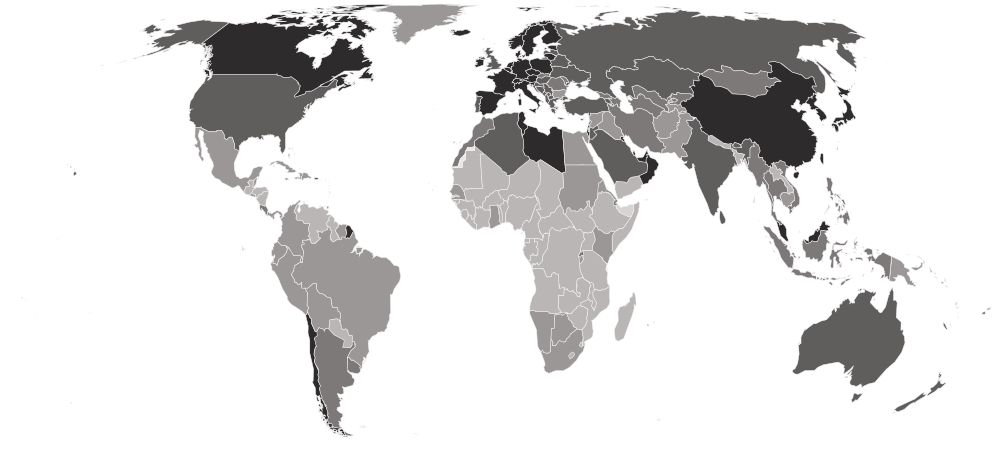
Adolescent birth rate on a map
Each country is shaded by its value, in five groups holding the same number of countries. Hover a country for its value, or select it to open its profile. Below the map, each continent’s middle country.
Darker is a lower value — the better end.
- 67.169–163.093
- 36.043–66.219
- 18.788–35.994
- 6.570–18.425
- 0.465–6.542
- No reading in 2023
- Europe
6.381
the middle country, of 48 measured · 49 members
 Denmark1.140
 Bulgaria39.098
Lowest and highest reading in Europe.
- Asia
18.425
the middle country, of 51 measured · 52 members
Macau0.465 Laos81.654
Lowest and highest reading in Asia.
- Oceania
29.927
the middle country, of 21 measured · 21 members
 Australia6.715
 Nauru76.239
Lowest and highest reading in Oceania.
- Americas
35.588
the middle country, of 48 measured · 48 members
 Bermuda1.546
 Nicaragua93.452
Lowest and highest reading in Americas.
- Africa
84.088
the middle country, of 54 measured · 55 members
 Tunisia4.315Central African Republic163.093
Lowest and highest reading in Africa.
- Every region
22 sub-regions, lowest middle country first
- Eastern Asia
1.429
the middle country, of 8 measured · 8 members
Macau0.465 Mongolia19.739
Lowest and highest reading in Eastern Asia.
- Western Europe
3.670
the middle country, of 9 measured · 9 members
 Switzerland1.483
 Monaco9.690
Lowest and highest reading in Western Europe.
- Northern Europe
4.371
the middle country, of 12 measured · 13 members
Denmark1.140 Isle of Man8.685
Lowest and highest reading in Northern Europe.
- Southern Europe
7.834
the middle country, of 17 measured · 17 members
 San Marino1.158
 Vatican City30.715
Lowest and highest reading in Southern Europe.
- Western Asia
12.750
the middle country, of 18 measured · 19 members
 Kuwait1.576
 Yemen75.328
Lowest and highest reading in Western Asia.
- Eastern Europe
15.256
the middle country, of 10 measured · 10 members
 Czechia5.979Bulgaria39.098
Lowest and highest reading in Eastern Europe.
- Northern Africa
16.901
the middle country, of 6 measured · 6 members
Tunisia4.315 Sudan66.071
Lowest and highest reading in Northern Africa.
- Polynesia
24.841
the middle country, of 7 measured · 7 members
 Niue16.592
 Samoa43.538
Lowest and highest reading in Polynesia.
- Southern Asia
26.204
the middle country, of 9 measured · 9 members
 Maldives5.425
 Bangladesh73.179
Lowest and highest reading in Southern Asia.
- South-eastern Asia
27.406
the middle country, of 11 measured · 11 members
 Singapore2.160Laos81.654
Lowest and highest reading in South-eastern Asia.
- Central Asia
28.324
the middle country, of 5 measured · 5 members
 Kazakhstan18.235
 Tajikistan40.437
Lowest and highest reading in Central Asia.
- Caribbean
28.684
the middle country, of 24 measured · 24 members
 Cayman Islands11.338
 Dominican Republic52.774
Lowest and highest reading in Caribbean.
- Micronesia
43.719
the middle country, of 7 measured · 7 members
 Northern Mariana Islands26.151Nauru76.239
Lowest and highest reading in Micronesia.
- Melanesia
50.372
the middle country, of 5 measured · 5 members
 New Caledonia12.156
 Vanuatu66.219
Lowest and highest reading in Melanesia.
- South America
51.781
the middle country, of 12 measured · 12 members
 Chile6.542
 Venezuela73.295
Lowest and highest reading in South America.
- Central America
58.721
the middle country, of 8 measured · 8 members
 Costa Rica26.251Nicaragua93.452
Lowest and highest reading in Central America.
- Southern Africa
66.034
the middle country, of 5 measured · 5 members
 South Africa51.560
 Lesotho70.642
Lowest and highest reading in Southern Africa.
- Eastern Africa
83.499
the middle country, of 18 measured · 19 members
 Djibouti18.972Mozambique153.450
Lowest and highest reading in Eastern Africa.
- Western Africa
86.757
the middle country, of 16 measured · 16 members
 Cabo Verde38.755
 Niger145.324
Lowest and highest reading in Western Africa.
- Middle Africa
109.880
the middle country, of 9 measured · 9 members
 São Tomé and Príncipe86.195Central African Republic163.093
Lowest and highest reading in Middle Africa.
- Australia and New Zealand
2 of 2 measured — too few for a middle: Australia, New Zealand.
Australia6.715 New Zealand10.879
Lowest and highest reading in Australia and New Zealand.
- Northern America
4 of 4 measured — too few for a middle: Bermuda, Canada, Greenland, United States.
Bermuda1.546 Greenland36.101
Lowest and highest reading in Northern America.
03The whole field at once
The spread
222 countries, one dot each, on one scale — further right is a higher value. Half the countries are above 27.457; a quarter are above 58.072, and a quarter below 8.688. The bar in each row marks that continent’s middle country.
04All 222 ever measured
Every country
In order, highest value first — position 1 is the highest value, the way UN DESA Population Division’s own tables read. “=” marks a position shared with another country. UN DESA Population Division ranks nobody on this measure; the position is derived here by ordering the published values. The rate follows the age at which women marry and start families as much as it follows income, so some middle-income countries sit well above both richer and poorer neighbours. At the other end, a few very small places have so few births that a handful moves the rate. It counts births, not pregnancies, and leaves out births to girls younger than 15.
Showing 25 of 222 countries














































































































































Values for 2023. The change column compares 2023 with 2022 only; the sparkline covers the recent editions.
051950–2023 · 74 reference years
Over time
Each point is one year's estimate, 1950 to 2023, as restated by the 2024 revision of World Population Prospects. The rate usually falls as girls stay longer in school and marry later; a line that stays high while incomes rise is as telling as one that falls.
- the middle country
- the middle half of countries
- the middle of the 222 countries measured every time
- each continent’s middle country
The same, year by year
| Year | Countries | Middle country | Middle half | Measured every time |
|---|---|---|---|---|
| 2023 | 222 | 27.457 | 8.688 – 58.072 | 27.457 |
| 2022 | 222 | 27.982 | 8.865 – 58.936 | 27.982 |
| 2021 | 222 | 28.507 | 9.419 – 60.218 | 28.507 |
| 2020 | 222 | 29.499 | 10.028 – 62.419 | 29.499 |
| 2019 | 222 | 30.657 | 10.574 – 64.488 | 30.657 |
| 2018 | 222 | 32.091 | 11.174 – 66.880 | 32.091 |
| 2017 | 222 | 33.174 | 11.623 – 68.886 | 33.174 |
| 2016 | 222 | 35.200 | 13.330 – 71.878 | 35.200 |
| 2015 | 222 | 36.950 | 14.585 – 72.714 | 36.950 |
| 2014 | 222 | 39.711 | 15.375 – 74.270 | 39.711 |
| 2013 | 222 | 40.958 | 15.573 – 75.988 | 40.958 |
| 2012 | 222 | 40.910 | 16.118 – 77.227 | 40.910 |
| 2011 | 222 | 41.705 | 16.934 – 77.284 | 41.705 |
| 2010 | 222 | 42.301 | 17.616 – 77.650 | 42.301 |
| 2009 | 222 | 41.983 | 18.642 – 76.756 | 41.983 |
| 2008 | 222 | 41.823 | 18.767 – 78.044 | 41.823 |
| 2007 | 222 | 41.683 | 18.518 – 79.673 | 41.683 |
| 2006 | 222 | 41.340 | 17.877 – 81.780 | 41.340 |
| 2005 | 222 | 41.605 | 19.805 – 83.002 | 41.605 |
| 2004 | 222 | 41.915 | 19.476 – 84.281 | 41.915 |
| 2003 | 222 | 43.102 | 19.249 – 87.242 | 43.102 |
| 2002 | 222 | 43.882 | 20.549 – 88.630 | 43.882 |
| 2001 | 222 | 46.477 | 21.565 – 90.165 | 46.477 |
| 2000 | 222 | 47.623 | 23.710 – 91.079 | 47.623 |
| 1999 | 222 | 49.620 | 24.352 – 92.123 | 49.620 |
| 1998 | 222 | 51.994 | 25.336 – 92.342 | 51.994 |
| 1997 | 222 | 54.122 | 26.742 – 93.005 | 54.122 |
| 1996 | 222 | 56.590 | 28.358 – 94.365 | 56.590 |
| 1995 | 222 | 60.363 | 29.310 – 95.649 | 60.363 |
| 1994 | 222 | 62.159 | 31.750 – 97.255 | 62.159 |
| 1993 | 222 | 62.405 | 32.883 – 98.828 | 62.405 |
| 1992 | 222 | 62.220 | 33.515 – 99.829 | 62.220 |
| 1991 | 222 | 63.552 | 34.164 – 101.537 | 63.552 |
| 1990 | 222 | 64.899 | 34.779 – 104.106 | 64.899 |
| 1989 | 222 | 66.008 | 34.837 – 105.214 | 66.008 |
| 1988 | 222 | 65.775 | 35.645 – 108.044 | 65.775 |
| 1987 | 222 | 68.318 | 36.686 – 110.483 | 68.318 |
| 1986 | 222 | 67.640 | 37.896 – 110.961 | 67.640 |
| 1985 | 222 | 68.735 | 39.112 – 113.255 | 68.735 |
| 1984 | 222 | 68.765 | 39.768 – 112.392 | 68.765 |
| 1983 | 222 | 71.213 | 40.368 – 116.875 | 71.213 |
| 1982 | 222 | 72.582 | 40.994 – 115.566 | 72.582 |
| 1981 | 222 | 76.787 | 41.629 – 116.867 | 76.787 |
| 1980 | 222 | 77.488 | 41.985 – 118.814 | 77.488 |
| 1979 | 222 | 78.890 | 42.074 – 119.949 | 78.890 |
| 1978 | 222 | 79.798 | 41.460 – 121.914 | 79.798 |
| 1977 | 222 | 79.959 | 41.297 – 123.478 | 79.959 |
| 1976 | 222 | 81.526 | 41.798 – 125.484 | 81.526 |
| 1975 | 222 | 83.882 | 43.179 – 126.241 | 83.882 |
| 1974 | 222 | 83.925 | 43.321 – 128.996 | 83.925 |
| 1973 | 222 | 87.395 | 43.833 – 132.034 | 87.395 |
| 1972 | 222 | 87.610 | 44.573 – 131.432 | 87.610 |
| 1971 | 222 | 88.896 | 45.640 – 130.520 | 88.896 |
| 1970 | 222 | 88.059 | 46.843 – 130.576 | 88.059 |
| 1969 | 222 | 89.307 | 46.680 – 134.737 | 89.307 |
| 1968 | 222 | 90.038 | 46.902 – 136.686 | 90.038 |
| 1967 | 222 | 90.663 | 47.852 – 138.462 | 90.663 |
| 1966 | 222 | 91.434 | 47.327 – 139.749 | 91.434 |
| 1965 | 222 | 92.700 | 45.605 – 140.341 | 92.700 |
| 1964 | 222 | 92.933 | 43.690 – 141.849 | 92.933 |
| 1963 | 222 | 94.303 | 44.089 – 141.517 | 94.303 |
| 1962 | 222 | 95.069 | 46.398 – 141.906 | 95.069 |
| 1961 | 222 | 94.272 | 49.945 – 142.317 | 94.272 |
| 1960 | 222 | 95.810 | 51.968 – 142.956 | 95.810 |
| 1959 | 222 | 95.295 | 52.485 – 141.176 | 95.295 |
| 1958 | 222 | 94.808 | 50.820 – 140.309 | 94.808 |
| 1957 | 222 | 95.249 | 49.683 – 138.072 | 95.249 |
| 1956 | 222 | 95.106 | 48.843 – 136.795 | 95.106 |
| 1955 | 222 | 95.305 | 47.401 – 137.296 | 95.305 |
| 1954 | 222 | 95.967 | 45.082 – 136.758 | 95.967 |
| 1953 | 222 | 96.397 | 43.552 – 135.548 | 96.397 |
| 1952 | 222 | 96.474 | 43.234 – 135.916 | 96.474 |
| 1951 | 222 | 96.809 | 43.481 – 135.450 | 96.809 |
| 1950 | 222 | 96.218 | 44.577 – 136.023 | 96.218 |
062022 → 2023
Who rose and fell
The biggest changes in value between the two newest editions — reference years recalculated in one report, not two separate publications. Places are shown second, because they also move when other countries do.
Improved most
before → after Somalia119.277 → 117.100 · 11th → 11th−2.177
 Sierra Leone95.743 → 93.592 · 21st → 21st−2.151
- Nauru78.372 → 76.239 · 34th → 34th−2.133
 Chad136.697 → 134.738 · 7th → 7th−1.959
 Guinea120.438 → 118.577 · 10th → 10th−1.861
Worsened most
before → after Belize53.404 → 55.232 · 68th → 62nd+1.828
 Ukraine10.271 → 11.377 · 161st → 156th+1.106
 Cook Islands19.633 → 20.578 · 132nd → 130th+0.945
 Cuba47.767 → 48.674 · 73rd → 72nd+0.907
 Saudi Arabia10.290 → 11.114 · 160th → 159th+0.824
222 countries were measured in both 2022 and 2023.
07Across every edition
Adolescent birth rate in records
The extremes of the statistic. A record reached by more than one country names none of them.
Highest reading on record
229.604
Live births per 1,000 women aged 15–19
Lowest reading on record
0.465
Live births per 1,000 women aged 15–19
Biggest improvement between editions
−37.876
77.808 → 39.932
Biggest decline between editions
+30.721
154.892 → 185.613
Most improved since first measured
−195.829
203.364 → 7.535
At the top most often
32 of 74
editions, alone at the first-listed end
08The measure
About adolescent birth rate
The adolescent birth rate is the number of babies born to girls and young women aged 15 to 19 for every 1,000 women of that age. Early childbearing carries higher risks for mother and child and often ends a girl's schooling, which is why reducing it is one of the Sustainable Development Goals.
What the number is: Live births per 1,000 women aged 15–19.
What it does not measure
It counts births, not pregnancies, and leaves out girls younger than 15; it says nothing about whether a birth was wanted or about the circumstances of the mother.
09Where it fits
Connections
Its part in the Country Index, the statistics whose values line up most closely with it across countries, and others on the same subject.
In the Country Index
Context, with no vote
This statistic is published in full under Health & Wellbeing and Gender & Equality, but does not help decide any Country Index standing.
Health & WellbeingGender & EqualityWhich statistics vote, and why
Moves with
Where adolescent birth rate is higher, these tend to be higher too.
- Gender Inequality IndexUNDP Human Development Report Office · 172 countries in commonρ 0.90
- Learning PovertyWorld Bank Group and UNESCO Institute for Statistics · 108 countries in commonρ 0.84
- Child MarriageUNICEF · 125 countries in commonρ 0.84
Moves against
Where adolescent birth rate is higher, these tend to be lower.
- Human Capital IndexWorld Bank Group · 172 countries in commonρ −0.88
- Global Innovation IndexWorld Intellectual Property Organization · 139 countries in commonρ −0.87
- Inequality-adjusted Human Development IndexUNDP Human Development Report Office · 169 countries in commonρ −0.87
Rank correlation (ρ, from −1 to 1) across countries, on each statistic’s newest edition, out of 386 statistics sharing at least 80 countries with this one. Two statistics that move together do not cause each other.
10Keep reading
Explore further
The subject
The countries at either end
11Questions
Adolescent birth rate: questions and answers
Which country has the lowest adolescent birth rate?
Macau, at 0.465, among the 222 countries compared in 2023.
Which country has the highest adolescent birth rate?
Central African Republic, at 163.093, among the 222 countries compared in 2023.
How many countries does the Adolescent Birth Rate (Ages 15–19) cover?
222 in 2023.
What is the world average adolescent birth rate?
This site does not calculate a world average, which would depend on how countries are weighted. In the middle country of the 222 compared in 2023, the figure was 27.457.
Is this UN DESA Population Division’s own ranking?
No. UN DESA Population Division publishes the values but ranks nobody; the position on this page is derived by Nations Inquiry by ordering the published values, and equal values share a position.
How often is the Adolescent Birth Rate (Ages 15–19) published?
This site holds 74 reference years, 1950–2023, all recalculated in UN DESA Population Division’s 2024 report on one method — not 74 separate publications.
Where does the data come from, and can I download it?
From UN DESA Population Division, under CC BY 3.0 IGO. From World Population Prospects 2024, read from the Population Division's own download of fertility by age group — the rate for ages 15 to 19 — rather than the survey-based figures in the SDG database, which cover fewer countries and years. Projections are excluded. Every edition is on this site’s Datasets pages as a full table, and downloads as a CSV file with every value unrounded.
12Method
Sources, method and citation
Source
Adolescent Birth Rate (Ages 15–19) — UN DESA Population Division
From World Population Prospects 2024, read from the Population Division's own download of fertility by age group — the rate for ages 15 to 19 — rather than the survey-based figures in the SDG database, which cover fewer countries and years. Projections are excluded.
Newest edition
Report year 2023Data year 2023
Cite the source as: United Nations, Department of Economic and Social Affairs, Population Division (2024). World Population Prospects 2024, Online Edition.
Licence: CC BY 3.0 IGO, checked 2026-09-29.
How this page reads the numbers
- UN DESA Population Division ranks nobody on this measure. The position is derived by Nations Inquiry by ordering the published values; equal values share a position.
- Which end is better follows the publisher’s own reading of the measure.
- A country is named at an end only when it holds that value alone. Where several share it, the page says how many and names none first.
- Values are stored exactly as published and trimmed only for display. “The middle country” is the median of the countries measured, not a world average.
The file itself, column by column — where it came from, what each column holds, and every edition as a CSV — is on its dataset page.
Photographs
The countries at the top of this statistic, from their profiles: Wikimedia Commons, shown in greyscale, each used under the licence named.
- Macau — Diego Delso, CC BY-SA 3.0
- South Korea — Unknown author, CC BY-SA 2.0
Cite this page
Nations Inquiry (2026). Adolescent birth rate by country: Adolescent Birth Rate (Ages 15–19), data from UN DESA Population Division. https://nationsinquiry.com/statistics/adolescent-birth-rate