World Bank Group · Inflation, GDP Deflator
Inflation (GDP deflator) by country
How fast are the prices of everything a country produces rising?
Of the 186 countries compared in 2025, Venezuela had the highest reading, 227.0931%, and Guyana had the lowest reading, -7.9304%. In the middle country the figure was 3.3059%. Among the 103 countries measured in every edition since 1961, the middle one moved from 2.7822% to 3.1262%.
Share
Inflation (GDP deflator) · 2025
Context statistic

Highest of 186Venezuela
227.0931%012025 · values only
The highest and the lowest
The three countries with the highest values of 186 compared, the three with the lowest, and the highest on each continent. This statistic has no better end, so no country is shown as leading.
- 1
- 2

- 3


02Every measured country
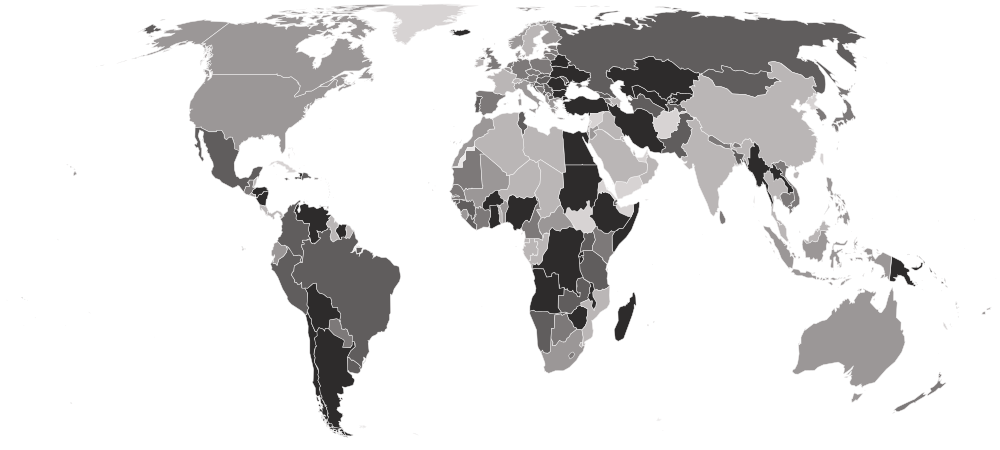
Inflation (GDP deflator) on a map
Each country is shaded by its value, in five groups holding the same number of countries. Hover a country for its value, or select it to open its profile. Below the map, each continent’s middle country.
Darker is a higher value. This statistic has no better end, so the shades describe size, not success.
- -7.9304–1.2297%
- 1.2858–2.8012%
- 2.8106–3.9169%
- 3.9223–6.5591%
- 6.8032–227.0931%
- No reading in 2025 (27 measured in an earlier edition)
- Africa
4.1109%
the middle country, of 52 measured · 55 members
Zimbabwe83.1245% Gabon-3.9610%
Highest and lowest reading in Africa.
- Europe
3.3200%
the middle country, of 41 measured · 49 members
 Ukraine14.4739%
 Switzerland0.2873%
Highest and lowest reading in Europe.
- Americas
3.0834%
the middle country, of 35 measured · 48 members
Venezuela227.0931% Guyana-7.9304%
Highest and lowest reading in Americas.
- Oceania
3.0804%
the middle country, of 14 measured · 21 members
 Papua New Guinea6.8691%
 Kiribati0.0088%
Highest and lowest reading in Oceania.
- Asia
2.8921%
the middle country, of 44 measured · 52 members
 Türkiye36.4253%
 Iraq-7.0339%
Highest and lowest reading in Asia.
- Every region
22 sub-regions, highest middle country first
- Central Asia
9.6051%
the middle country, of 5 measured · 5 members
 Kyrgyzstan12.3958%
 Tajikistan4.7665%
Highest and lowest reading in Central Asia.
- Eastern Europe
6.4152%
the middle country, of 10 measured · 10 members
Ukraine14.4739% Poland2.9084%
Highest and lowest reading in Eastern Europe.
- South America
5.5859%
the middle country, of 12 measured · 12 members
Venezuela227.0931%Guyana-7.9304%Highest and lowest reading in South America.
- Eastern Africa
5.4155%
the middle country, of 16 measured · 19 members
Zimbabwe83.1245% Mozambique-1.0239%
Highest and lowest reading in Eastern Africa.
- Northern Africa
3.6668%
the middle country, of 6 measured · 6 members
Sudan65.9099% Libya-3.9381%
Highest and lowest reading in Northern Africa.
- Southern Asia
3.4889%
the middle country, of 8 measured · 9 members
 Iran28.7776%
 India0.9736%
Highest and lowest reading in Southern Asia.
- Western Africa
3.4310%
the middle country, of 16 measured · 16 members
 Ghana14.4337%
 Niger-1.6004%
Highest and lowest reading in Western Africa.
- Micronesia
3.2009%
the middle country, of 5 measured · 7 members
 Marshall Islands5.6579%Kiribati0.0088%
Highest and lowest reading in Micronesia.
- Western Europe
3.0090%
the middle country, of 7 measured · 9 members
 Netherlands3.3200%Switzerland0.2873%
Highest and lowest reading in Western Europe.
- Southern Africa
2.9980%
the middle country, of 5 measured · 5 members
 Namibia6.0615%
 Eswatini-0.4500%
Highest and lowest reading in Southern Africa.
- Southern Europe
2.9642%
the middle country, of 14 measured · 17 members
 Croatia4.6681%
 Albania1.4454%
Highest and lowest reading in Southern Europe.
- Caribbean
2.6853%
the middle country, of 13 measured · 24 members
 Haiti34.3943%
 Grenada0.6581%
Highest and lowest reading in Caribbean.
- Northern Europe
2.6449%
the middle country, of 10 measured · 13 members
 Iceland6.8722%
 Ireland1.0208%
Highest and lowest reading in Northern Europe.
- Middle Africa
2.3421%
the middle country, of 9 measured · 9 members
 Angola20.4948%Gabon-3.9610%
Highest and lowest reading in Middle Africa.
- Central America
2.3363%
the middle country, of 8 measured · 8 members
 Honduras8.0166%
 Costa Rica-0.5352%
Highest and lowest reading in Central America.
- Eastern Asia
2.0753%
the middle country, of 6 measured · 8 members
 Mongolia4.3553%
 China-0.9223%
Highest and lowest reading in Eastern Asia.
- South-eastern Asia
1.4344%
the middle country, of 11 measured · 11 members
 Myanmar12.5211%
 Brunei-4.7366%
Highest and lowest reading in South-eastern Asia.
- Western Asia
0.8427%
the middle country, of 14 measured · 19 members
Türkiye36.4253%Iraq-7.0339%Highest and lowest reading in Western Asia.
- Australia and New Zealand
2 of 2 measured — too few for a middle: Australia, New Zealand.
 New Zealand3.6234%
 Australia2.3077%
Highest and lowest reading in Australia and New Zealand.
- Melanesia
4 of 5 measured — too few for a middle: Fiji, Papua New Guinea, Solomon Islands, Vanuatu.
Papua New Guinea6.8691% Fiji1.9996%
Highest and lowest reading in Melanesia.
- Northern America
2 of 4 measured — too few for a middle: Canada, United States.
 United States2.8012%
 Canada2.5529%
Highest and lowest reading in Northern America.
- Polynesia
3 of 7 measured — too few for a middle: Samoa, Tonga, Tuvalu.
 Samoa6.1691%
 Tuvalu1.8192%
Highest and lowest reading in Polynesia.
03The whole field at once
The spread
186 countries, one dot each, on one scale — further right is a higher value. Half the countries are above 3.3059%; a quarter are above 5.5826%, and a quarter below 1.6852%. The bar in each row marks that continent’s middle country.
04All 213 ever measured
Every country
In order, highest value first. No rank or position is shown: too many countries share the same value for an order to mean anything. Neither end of this table is the good end. High inflation erodes incomes and savings, and falling prices signal a slump. It is also not consumer inflation: it prices what a country produces, including its exports, so an oil or mineral exporter's figure moves with world prices.
Showing 25 of 213 countries





























































































































Values for 2025. The change column compares 2025 with 2024 only; the sparkline covers the recent editions.
051961–2025 · 65 reference years
Over time
Each point is one year from 1961. Spikes are usually a currency collapse or a commodity boom; a fall below zero is usually a commodity price slump rather than cheaper shopping.
- the middle country
- the middle half of countries
- the middle of the 103 countries measured every time
- each continent’s middle country
The same, year by year
| Year | Countries | Middle country | Middle half | Measured every time |
|---|---|---|---|---|
| 2025 | 186 | 3.3059% | 1.6852% – 5.5826% | 3.1262% |
| 2024 | 200 | 4.0832% | 2.3758% – 6.5517% | 4.0797% |
| 2023 | 204 | 4.9914% | 2.1399% – 8.0095% | 4.5690% |
| 2022 | 209 | 7.3339% | 4.6426% – 13.9679% | 7.5475% |
| 2021 | 209 | 4.5574% | 2.5451% – 10.0445% | 4.6057% |
| 2020 | 209 | 1.9822% | -0.0147% – 4.9489% | 2.3823% |
| 2019 | 209 | 2.3759% | 0.8480% – 4.1757% | 2.0858% |
| 2018 | 210 | 2.7889% | 1.4581% – 5.6261% | 2.5334% |
| 2017 | 209 | 2.9792% | 1.5322% – 5.9381% | 3.0693% |
| 2016 | 209 | 2.0154% | 0.5852% – 4.6069% | 2.1399% |
| 2015 | 210 | 2.3206% | 0.3924% – 4.7145% | 2.2206% |
| 2014 | 210 | 2.0105% | 0.6548% – 5.0808% | 2.1824% |
| 2013 | 209 | 2.2608% | 0.8338% – 4.9020% | 2.2744% |
| 2012 | 209 | 3.6167% | 1.5235% – 7.1123% | 3.5765% |
| 2011 | 210 | 5.4821% | 2.2962% – 10.9901% | 6.1989% |
| 2010 | 210 | 4.3003% | 1.2436% – 9.4559% | 5.3371% |
| 2009 | 209 | 2.0637% | -0.0099% – 5.8799% | 2.4055% |
| 2008 | 206 | 7.8912% | 3.7404% – 14.9769% | 8.2165% |
| 2007 | 205 | 5.9903% | 3.0413% – 9.2938% | 6.0292% |
| 2006 | 204 | 5.9130% | 2.5754% – 10.7872% | 5.5101% |
| 2005 | 204 | 5.8270% | 2.6230% – 11.5244% | 5.8762% |
| 2004 | 204 | 5.6773% | 2.1365% – 10.4492% | 6.2790% |
| 2003 | 204 | 4.0383% | 1.8031% – 9.0670% | 3.9117% |
| 2002 | 200 | 3.5982% | 1.5078% – 7.0054% | 3.3407% |
| 2001 | 200 | 3.9517% | 1.7211% – 8.0319% | 4.1623% |
| 2000 | 199 | 5.2898% | 1.8666% – 13.0201% | 4.6086% |
| 1999 | 199 | 4.2277% | 1.4048% – 10.8371% | 4.3762% |
| 1998 | 199 | 4.6810% | 1.1793% – 9.6971% | 5.2787% |
| 1997 | 197 | 4.4212% | 1.4986% – 11.4352% | 3.9215% |
| 1996 | 197 | 6.6576% | 2.3910% – 16.8684% | 6.9686% |
| 1995 | 196 | 8.6724% | 3.0733% – 20.0731% | 8.6678% |
| 1994 | 195 | 9.8122% | 2.8823% – 34.5357% | 9.4638% |
| 1993 | 195 | 7.7426% | 2.2566% – 29.1558% | 6.5572% |
| 1992 | 194 | 7.3958% | 2.8503% – 25.2817% | 5.6954% |
| 1991 | 193 | 8.7670% | 3.4392% – 35.5290% | 6.9949% |
| 1990 | 175 | 7.9757% | 3.7358% – 18.5437% | 10.0579% |
| 1989 | 174 | 7.1659% | 3.9258% – 14.6926% | 8.2484% |
| 1988 | 173 | 6.5712% | 2.6241% – 17.5233% | 7.6842% |
| 1987 | 169 | 7.1894% | 2.8602% – 14.5842% | 7.6265% |
| 1986 | 168 | 5.1687% | 1.3542% – 14.1441% | 5.2394% |
| 1985 | 166 | 5.5887% | 1.7980% – 14.3000% | 5.9098% |
| 1984 | 164 | 7.9616% | 3.7514% – 16.2698% | 7.9232% |
| 1983 | 164 | 7.7472% | 3.2100% – 14.2058% | 8.4878% |
| 1982 | 162 | 8.2072% | 4.6079% – 13.5823% | 8.6435% |
| 1981 | 160 | 9.9789% | 6.0614% – 15.0680% | 10.5833% |
| 1980 | 150 | 13.0209% | 9.0371% – 23.8693% | 14.2346% |
| 1979 | 149 | 11.5357% | 7.5025% – 17.9588% | 12.5645% |
| 1978 | 149 | 7.9085% | 3.6647% – 12.0649% | 9.1599% |
| 1977 | 145 | 9.7329% | 6.0147% – 15.1579% | 10.4484% |
| 1976 | 144 | 9.2942% | 4.8682% – 14.7508% | 10.2920% |
| 1975 | 142 | 10.5705% | 5.2673% – 16.7105% | 12.4681% |
| 1974 | 141 | 16.6675% | 11.6114% – 26.0737% | 18.2383% |
| 1973 | 141 | 11.8447% | 7.5528% – 17.8870% | 12.5481% |
| 1972 | 141 | 6.4131% | 4.1036% – 9.4511% | 6.4131% |
| 1971 | 141 | 5.4833% | 2.9033% – 7.8459% | 5.1855% |
| 1970 | 118 | 4.7321% | 1.9692% – 7.3632% | 4.4909% |
| 1969 | 118 | 4.0785% | 2.1026% – 6.5535% | 4.1503% |
| 1968 | 118 | 3.3185% | 1.3902% – 5.8858% | 3.3974% |
| 1967 | 117 | 2.9650% | 0.6737% – 5.9399% | 2.8320% |
| 1966 | 114 | 3.8522% | 2.0621% – 6.2180% | 3.9771% |
| 1965 | 111 | 3.0025% | 1.3143% – 5.5357% | 3.0789% |
| 1964 | 111 | 3.2805% | 1.8561% – 5.6216% | 3.2805% |
| 1963 | 111 | 3.0258% | 0.9315% – 5.7078% | 3.0139% |
| 1962 | 111 | 2.4327% | 0.5561% – 4.6036% | 2.5855% |
| 1961 | 106 | 2.6678% | 0.9960% – 5.0815% | 2.7822% |
062024 → 2025
Who rose and fell
The biggest changes in value between the two newest editions — reference years recalculated in one report, not two separate publications. Places are shown second, because they also move when other countries do.
Rose most
before → after- Venezuela55.4481% → 227.0931%+171.6450
 Bolivia6.0463% → 19.9139%+13.8676
- Haiti21.2842% → 34.3943%+13.1101
- Kyrgyzstan6.3963% → 12.3958%+5.9996
 Malawi24.6442% → 30.3678%+5.7236
186 countries were measured in both 2024 and 2025. The field changed from 200 to 186 countries, so a place can move for reasons that have nothing to do with the country itself.
07Across every edition
Inflation (GDP deflator) in records
The extremes of the statistic. A record reached by more than one country names none of them.
Highest reading on record
225,652.2350%
Annual change in the GDP implicit deflator (%)
Lowest reading on record
-98.7038%
Annual change in the GDP implicit deflator (%)
Biggest rise between editions
+224,602.3572
1,049.8778% → 225,652.2350%
Biggest fall between editions
−203,742.8923
225,652.2350% → 21,909.3427%
Biggest change since first measured
+225.0793
2.0137% → 227.0931%
Highest most often
9 of 65
editions, alone at the first-listed end
08The measure
About inflation (GDP deflator)
Inflation measured by the GDP deflator is how fast the prices of everything an economy produces are rising — the gap between its GDP in today's prices and in constant prices. It is the widest measure of inflation the World Bank publishes from national accounts.
What the number is: Annual change in the GDP implicit deflator (%).
09Where it fits
Connections
Its part in the Country Index, the statistics whose values line up most closely with it across countries, and others on the same subject.
In the Country Index
Context, with no vote
This statistic is published in full under Economy & Innovation and Money & Public Finance, but does not help decide any Country Index standing.
Economy & InnovationMoney & Public FinanceWhich statistics vote, and why
Moves with
Where inflation (GDP deflator) is higher, these tend to be higher too.
- Excess Mortality During the COVID-19 PandemicAriel Karlinsky and Dmitry Kobak (World Mortality Dataset) · 107 countries in commonρ 0.41
Moves against
Where inflation (GDP deflator) is higher, these tend to be lower.
- AI User Share of the Working-Age PopulationMicrosoft AI Economy Institute · 138 countries in commonρ −0.41
Rank correlation (ρ, from −1 to 1) across countries, on each statistic’s newest edition, out of 379 statistics sharing at least 80 countries with this one. Two statistics that move together do not cause each other.
10Keep reading
Explore further
The subject
More from World Bank Group
11Questions
Inflation (GDP deflator): questions and answers
Which country has the highest inflation (GDP deflator)?
Venezuela, at 227.0931%, among the 186 countries compared in 2025.
Which country has the lowest inflation (GDP deflator)?
Guyana, at -7.9304%, among the 186 countries compared in 2025.
How many countries does the Inflation, GDP Deflator cover?
186 in 2025, and 213 at least once across all editions. The number measured varies from 106 to 210 between editions.
What is the world average inflation (GDP deflator)?
This site does not calculate a world average, which would depend on how countries are weighted. In the middle country of the 186 compared in 2025, the figure was 3.3059%.
Is this World Bank Group’s own ranking?
No ranking is shown. World Bank Group publishes values only, and too many countries share the same value for an ordering to mean anything, so none is derived.
How often is the Inflation, GDP Deflator published?
This site holds 65 reference years, 1961–2025, all recalculated in World Bank Group’s 2026 report on one method — not 65 separate publications.
Where does the data come from, and can I download it?
From World Bank Group, under CC BY 4.0. The World Bank's indicator API (NY.GDP.DEFL.KD.ZG), computed from national accounts. Hyperinflation years and currency reforms are stored exactly as the Bank publishes them. Every edition is on this site’s Datasets pages as a full table, and downloads as a CSV file with every value unrounded.
12Method
Sources, method and citation
Source
Inflation, GDP Deflator — World Bank Group
The World Bank's indicator API (NY.GDP.DEFL.KD.ZG), computed from national accounts. Hyperinflation years and currency reforms are stored exactly as the Bank publishes them.
Newest edition
Report year 2025Data year 2025
Cite the source as: World Bank. World Development Indicators: Inflation, GDP deflator (annual %) (NY.GDP.DEFL.KD.ZG). Washington, DC: World Bank Group.
Licence: CC BY 4.0, checked 2026-09-29.
How this page reads the numbers
- No rank or position is shown: World Bank Group publishes values only, and too many countries share the same value for an ordering to mean anything.
- This statistic has no better end, so the page describes higher and lower values and never calls a country a leader.
- A country is named at an end only when it holds that value alone. Where several share it, the page says how many and names none first.
- Values are stored exactly as published and trimmed only for display. “The middle country” is the median of the countries measured, not a world average.
The file itself, column by column — where it came from, what each column holds, and every edition as a CSV — is on its dataset page.
Cite this page
Nations Inquiry (2026). Inflation (GDP deflator) by country: Inflation, GDP Deflator, data from World Bank Group. https://nationsinquiry.com/statistics/inflation-gdp-deflator