V-Dem Institute, University of Gothenburg · Government Social Media Censorship
Social media censorship by country
Does the government delete or filter political posts on social media?
Portugal placed first of the 176 countries compared in 2025, at 2.295, and North Korea last, at -3.721. In the middle country the figure was 0.505. Among the 175 countries measured in every edition since 2000, the middle one moved from 1.129 to 0.529.
Share
Social media censorship · 2025
Context statistic

Highest of 176Portugal
2.295012025 · position · derived
Who leads
The three countries at the highest end of 176 compared, the three at the other end, and the first on each continent.
 1
Photo: Tsy1980 · CC BY-SA 4.0, greyscale
 2
Photo: chensiyuan · CC BY-SA 4.0, greyscale
 3
Photo: User:Pieter Kuiper · Public domain, greyscale
Lowest in 2025
- 176
 North Korea-3.721
- 175
 Turkmenistan-3.484
- 174
 China-3.007
Positions out of 176. Where a country sits says how it compares with the others measured, and nothing about why.
02Every measured country
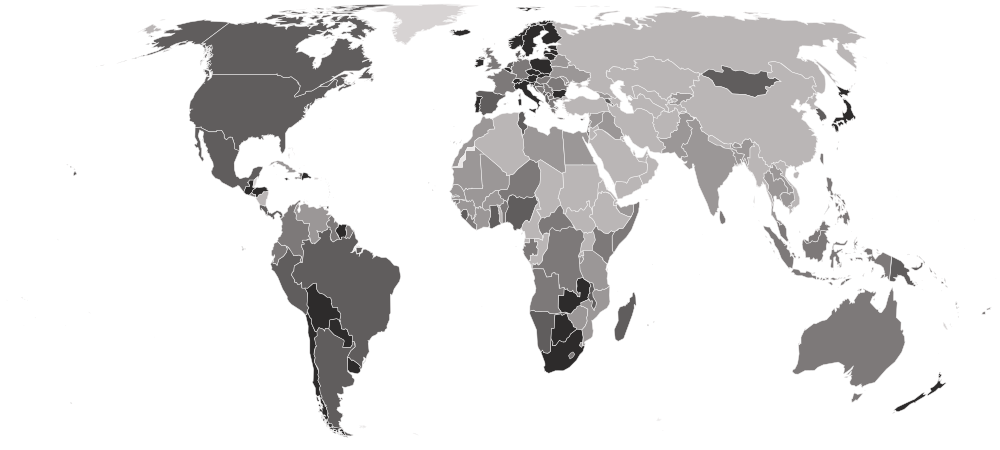
Social media censorship on a map
Each country is shaded by its value, in five groups holding the same number of countries. Hover a country for its value, or select it to open its profile. Below the map, each continent’s middle country.
Darker is a higher value — the better end.
- -3.721–-0.949
- -0.918–-0.046
- -0.045–0.874
- 0.886–1.651
- 1.652–2.295
- No reading in 2025
- Europe
1.630
the middle country, of 40 measured · 49 members
Portugal2.295 Russia-2.379
Highest and lowest reading in Europe.
- Americas
1.418
the middle country, of 27 measured · 48 members
 Guatemala2.137
 Nicaragua-2.259
Highest and lowest reading in Americas.
- Oceania
1.373
the middle country, of 6 measured · 21 members
 New Zealand1.751
 Fiji-0.022
Highest and lowest reading in Oceania.
- Africa
-0.046
the middle country, of 55 measured · 55 members
 Zambia2.115
 South Sudan-2.956
Highest and lowest reading in Africa.
- Asia
-0.792
the middle country, of 48 measured · 52 members
 Japan1.683North Korea-3.721
Highest and lowest reading in Asia.
- Every region
20 sub-regions, highest middle country first
- Western Europe
1.956
the middle country, of 7 measured · 9 members
 Austria2.180
 France0.739
Highest and lowest reading in Western Europe.
- Northern Europe
1.913
the middle country, of 10 measured · 13 members
 Sweden2.142
 United Kingdom0.862
Highest and lowest reading in Northern Europe.
- Caribbean
1.567
the middle country, of 6 measured · 24 members
 Dominican Republic2.004
 Cuba-0.855
Highest and lowest reading in Caribbean.
- Southern Europe
1.523
the middle country, of 13 measured · 17 members
Portugal2.295 Serbia0.577
Highest and lowest reading in Southern Europe.
- Southern Africa
1.455
the middle country, of 5 measured · 5 members
 Botswana1.926
 Eswatini-0.146
Highest and lowest reading in Southern Africa.
- Central America
1.426
the middle country, of 7 measured · 8 members
Guatemala2.137Nicaragua-2.259Highest and lowest reading in Central America.
- South America
1.406
the middle country, of 12 measured · 12 members
 Uruguay2.014
 Venezuela-0.817
Highest and lowest reading in South America.
- Eastern Europe
0.630
the middle country, of 10 measured · 10 members
 Slovakia2.097Russia-2.379
Highest and lowest reading in Eastern Europe.
- Eastern Asia
0.452
the middle country, of 7 measured · 8 members
Japan1.683North Korea-3.721Highest and lowest reading in Eastern Asia.
- Western Africa
0.360
the middle country, of 16 measured · 16 members
 Cabo Verde1.230
 Togo-1.282
Highest and lowest reading in Western Africa.
- Middle Africa
-0.019
the middle country, of 9 measured · 9 members
 São Tomé and Príncipe1.459
 Cameroon-1.521
Highest and lowest reading in Middle Africa.
- Eastern Africa
-0.287
the middle country, of 19 measured · 19 members
Zambia2.115South Sudan-2.956Highest and lowest reading in Eastern Africa.
- South-eastern Asia
-0.336
the middle country, of 10 measured · 11 members
 Timor-Leste1.056
 Myanmar-2.943
Highest and lowest reading in South-eastern Asia.
- Northern Africa
-0.719
the middle country, of 6 measured · 6 members
 Tunisia1.503
 Sudan-1.379
Highest and lowest reading in Northern Africa.
- Southern Asia
-0.877
the middle country, of 9 measured · 9 members
 Sri Lanka0.841
 Iran-2.240
Highest and lowest reading in Southern Asia.
- Western Asia
-0.949
the middle country, of 17 measured · 19 members
 Cyprus1.606
 United Arab Emirates-2.075
Highest and lowest reading in Western Asia.
- Central Asia
-1.838
the middle country, of 5 measured · 5 members
 Kyrgyzstan-0.685Turkmenistan-3.484
Highest and lowest reading in Central Asia.
- Australia and New Zealand
2 of 2 measured — too few for a middle: Australia, New Zealand.
New Zealand1.751 Australia0.659
Highest and lowest reading in Australia and New Zealand.
- Melanesia
4 of 5 measured — too few for a middle: Fiji, Papua New Guinea, Solomon Islands, Vanuatu.
 Vanuatu1.650Fiji-0.022
Highest and lowest reading in Melanesia.
- Northern America
2 of 4 measured — too few for a middle: Canada, United States.
 Canada1.418
 United States1.057
Highest and lowest reading in Northern America.
03The whole field at once
The spread
176 countries, one dot each, on one scale — further right is a higher value. Half the countries are above 0.505; a quarter are above 1.525, and a quarter below -0.788. The bar in each row marks that continent’s middle country.
04All 176 ever measured
Every country
In order, highest value first. “=” marks a position shared with another country. V-Dem Institute, University of Gothenburg ranks nobody on this measure; the position is derived here by ordering the published values. ⚠ Higher is better here, though the name reads the other way. It covers political content on social platforms; shutting down Internet access altogether and censoring newspapers, radio and television are separate V-Dem measures, both on this site.
Showing 25 of 176 countries






































































































Values for 2025. The change column compares 2025 with 2024 only; the sparkline covers the recent editions.
052000–2025 · 26 reference years
Over time
Each point is one year from 2000, when V-Dem's questions on digital society begin, all of them re-estimated together in the v16 release. The scale has no fixed ends, so read the movement and the gap to other countries rather than the number on its own.
- the middle country
- the middle half of countries
- the middle of the 175 countries measured every time
- each continent’s middle country
The same, year by year
| Year | Countries | Middle country | Middle half | Measured every time |
|---|---|---|---|---|
| 2025 | 176 | 0.505 | -0.788 – 1.525 | 0.529 |
| 2024 | 176 | 0.553 | -0.809 – 1.420 | 0.561 |
| 2023 | 176 | 0.655 | -0.802 – 1.466 | 0.669 |
| 2022 | 176 | 0.690 | -0.822 – 1.452 | 0.702 |
| 2021 | 176 | 0.709 | -0.857 – 1.466 | 0.716 |
| 2020 | 176 | 0.695 | -0.777 – 1.486 | 0.726 |
| 2019 | 176 | 0.704 | -0.768 – 1.470 | 0.734 |
| 2018 | 176 | 0.769 | -0.713 – 1.577 | 0.787 |
| 2017 | 176 | 0.769 | -0.777 – 1.586 | 0.787 |
| 2016 | 176 | 0.769 | -0.742 – 1.577 | 0.787 |
| 2015 | 176 | 0.852 | -0.742 – 1.642 | 0.862 |
| 2014 | 176 | 0.868 | -0.721 – 1.642 | 0.874 |
| 2013 | 176 | 0.900 | -0.603 – 1.642 | 0.903 |
| 2012 | 176 | 0.900 | -0.636 – 1.642 | 0.903 |
| 2011 | 176 | 0.979 | -0.584 – 1.646 | 1.007 |
| 2010 | 175 | 1.007 | -0.587 – 1.650 | 1.007 |
| 2009 | 175 | 1.084 | -0.568 – 1.724 | 1.084 |
| 2008 | 175 | 1.043 | -0.568 – 1.678 | 1.043 |
| 2007 | 175 | 1.129 | -0.568 – 1.729 | 1.129 |
| 2006 | 175 | 1.144 | -0.568 – 1.759 | 1.144 |
| 2005 | 175 | 1.129 | -0.568 – 1.759 | 1.129 |
| 2004 | 175 | 1.084 | -0.568 – 1.702 | 1.084 |
| 2003 | 175 | 1.129 | -0.568 – 1.702 | 1.129 |
| 2002 | 175 | 1.084 | -0.568 – 1.736 | 1.084 |
| 2001 | 175 | 1.129 | -0.542 – 1.736 | 1.129 |
| 2000 | 175 | 1.129 | -0.542 – 1.736 | 1.129 |
062024 → 2025
Who rose and fell
The biggest changes in value between the two newest editions — reference years recalculated in one report, not two separate publications. Places are shown second, because they also move when other countries do.
Improved most
before → after Guinea-2.392 → -0.418 · 170th → 115th+1.974
 Ecuador-1.168 → 0.047 · 145th → 101st+1.215
 Syria-1.563 → -0.420 · 159th → 116th+1.143
 South Korea0.640 → 1.651 · 85th → 36th+1.011
 Montenegro0.544 → 1.523 · 89th → 45th+0.979
176 countries were measured in both 2024 and 2025.
07Across every edition
Social media censorship in records
The extremes of the statistic. A record reached by more than one country names none of them.
Highest reading on record
2.420
Original latent estimate (≈ −4.5 to +2.4); higher = less censorship
Lowest reading on record
-4.519
Original latent estimate (≈ −4.5 to +2.4); higher = less censorship
Biggest improvement between editions
+3.908
-2.876 → 1.032
Biggest decline between editions
−2.233
-0.710 → -2.943
Most improved since first measured
+4.379
-2.876 → 1.503
At the top most often
24 of 26
editions, alone at the first-listed end
08The measure
About social media censorship
V-Dem's measure of social media censorship asks how far a government deletes or filters political posts on social media in practice, from not at all to blocking the platforms outright. It is an expert-coded estimate on an open-ended scale centred near zero, and a higher figure means less censorship.
What the number is: Original latent estimate (≈ −4.5 to +2.4); higher = less censorship.
09Where it fits
Connections
Its part in the Country Index, the statistics whose values line up most closely with it across countries, and others on the same subject.
In the Country Index
Context, with no vote
This statistic is published in full under Democracy & Civil Liberties and Digital & Technology, but does not help decide any Country Index standing.
Democracy & Civil LibertiesDigital & TechnologyWhich statistics vote, and why
Moves with
Where social media censorship is higher, these tend to be higher too.
- Academic Freedom IndexV-Dem Institute, University of Gothenburg · 176 countries in commonρ 0.85
- Freedom of Expression and Alternative Sources of Information IndexV-Dem Institute, University of Gothenburg · 176 countries in commonρ 0.84
- V-Dem Electoral Democracy IndexKeyV-Dem Institute, University of Gothenburg · 176 countries in commonρ 0.84
Moves against
Where social media censorship is higher, these tend to be lower.
- Neopatrimonial Rule IndexV-Dem Institute, University of Gothenburg · 176 countries in commonρ −0.74
- PM2.5 Air Pollution ExposureAtmospheric Composition Analysis Group, Washington University in St. Louis · 173 countries in commonρ −0.59
- Political Corruption IndexV-Dem Institute, University of Gothenburg · 176 countries in commonρ −0.58
Rank correlation (ρ, from −1 to 1) across countries, on each statistic’s newest edition, out of 379 statistics sharing at least 80 countries with this one. Two statistics that move together do not cause each other.
10Keep reading
Explore further
The countries at either end
More from V-Dem Institute, University of Gothenburg
11Questions
Social media censorship: questions and answers
Which country has the highest social media censorship?
Portugal, at 2.295, among the 176 countries compared in 2025.
Which country has the lowest social media censorship?
North Korea, at -3.721, among the 176 countries compared in 2025.
How many countries does the Government Social Media Censorship cover?
176 in 2025. The number measured varies from 175 to 176 between editions.
What is the world average social media censorship?
This site does not calculate a world average, which would depend on how countries are weighted. In the middle country of the 176 compared in 2025, the figure was 0.505.
Is this V-Dem Institute, University of Gothenburg’s own ranking?
No. V-Dem Institute, University of Gothenburg publishes the values but ranks nobody; the position on this page is derived by Nations Inquiry by ordering the published values, and equal values share a position.
How often is the Government Social Media Censorship published?
This site holds 26 reference years, 2000–2025, all recalculated in V-Dem Institute, University of Gothenburg’s 2026 report on one method — not 26 separate publications.
Where does the data come from, and can I download it?
From V-Dem Institute, University of Gothenburg, under CC BY-SA 4.0. From the V-Dem Institute's Country-Year Full+Others dataset (v16), University of Gothenburg — this indicator is a Digital Society Project question not in the smaller Core file — published under CC BY-SA 4.0. The series starts in 2000, when V-Dem's questions on digital society begin. Stored as the measurement model's original estimate, not V-Dem's 0–4 rescaling. Every edition is on this site’s Datasets pages as a full table, and downloads as a CSV file with every value unrounded.
12Method
Sources, method and citation
Source
Government Social Media Censorship — V-Dem Institute, University of Gothenburg
From the V-Dem Institute's Country-Year Full+Others dataset (v16), University of Gothenburg — this indicator is a Digital Society Project question not in the smaller Core file — published under CC BY-SA 4.0. The series starts in 2000, when V-Dem's questions on digital society begin. Stored as the measurement model's original estimate, not V-Dem's 0–4 rescaling.
Newest edition
Report year 2025Data year 2025
Cite the source as: Coppedge, M. et al. V-Dem Country-Year Dataset v16. Varieties of Democracy (V-Dem) Project, University of Gothenburg.
Licence: CC BY-SA 4.0, checked 2026-09-29.
How this page reads the numbers
- V-Dem Institute, University of Gothenburg ranks nobody on this measure. The position is derived by Nations Inquiry by ordering the published values; equal values share a position.
- Which end is better follows the publisher’s own reading of the measure.
- A country is named at an end only when it holds that value alone. Where several share it, the page says how many and names none first.
- Values are stored exactly as published and trimmed only for display. “The middle country” is the median of the countries measured, not a world average.
The file itself, column by column — where it came from, what each column holds, and every edition as a CSV — is on its dataset page.
Photographs
The countries at the top of this statistic, from their profiles: Wikimedia Commons, shown in greyscale, each used under the licence named.
- Portugal — Tsy1980, CC BY-SA 4.0
- Austria — chensiyuan, CC BY-SA 4.0
- Sweden — User:Pieter Kuiper, Public domain
Cite this page
Nations Inquiry (2026). Social media censorship by country: Government Social Media Censorship, data from V-Dem Institute, University of Gothenburg. https://nationsinquiry.com/statistics/social-media-censorship