FAO · Cropland Nitrogen Balance
Cropland nitrogen balance by country
How much more nitrogen goes onto farmland than the harvest takes off?
Of the 187 countries compared in 2023, Singapore had the highest reading, 1,198.829, and Micronesia had the lowest reading, -555.524. In the middle country the figure was 37.634. Among the 157 countries measured in every edition since 1961, the middle one moved from 7.374 to 36.392.
Share
Cropland nitrogen balance · 2023
Context statistic

Highest of 187Singapore
1,198.829012023 · values only
The highest and the lowest
The three countries with the highest values of 187 compared, the three with the lowest, and the highest on each continent. This statistic has no better end, so no country is shown as leading.
- 1
- 2

- 3

Lowest in 2023
 Micronesia-555.524
 Kiribati-75.380
 Eswatini-51.454
This statistic has no better end: the two ends describe size, not success.
Highest on each continent
- Africa
 Djibouti210.497
- Americas
 Trinidad and Tobago275.808
- AsiaSingapore1,198.829
- Europe
 Montenegro366.654
- Oceania
 Tuvalu42.951
- Every region
02Every measured country
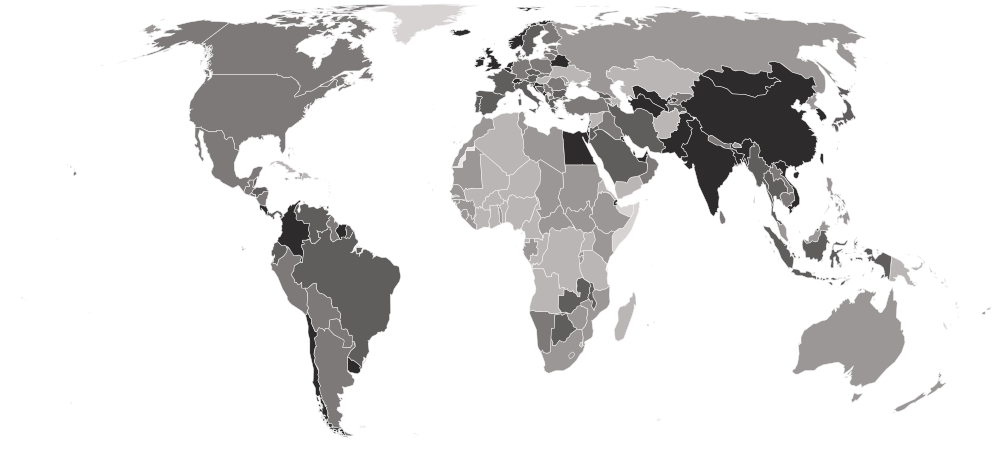
Cropland nitrogen balance on a map
Each country is shaded by its value, in five groups holding the same number of countries. Hover a country for its value, or select it to open its profile. Below the map, each continent’s middle country.
Darker is a higher value. This statistic has no better end, so the shades describe size, not success.
- -555.524–10.442
- 10.478–26.269
- 26.461–47.650
- 49.105–84.128
- 84.588–1,198.829
- No reading in 2023
- Europe
59.089
the middle country, of 39 measured · 49 members
Montenegro366.654 Ukraine-1.439
Highest and lowest reading in Europe.
- Asia
56.545
the middle country, of 48 measured · 52 members
Singapore1,198.829 Syria-2.839
Highest and lowest reading in Asia.
- Americas
42.363
the middle country, of 35 measured · 48 members
Trinidad and Tobago275.808 Dominican Republic-18.873
Highest and lowest reading in Americas.
- Africa
12.161
the middle country, of 53 measured · 55 members
Djibouti210.497Eswatini-51.454Highest and lowest reading in Africa.
- Oceania
-12.525
the middle country, of 12 measured · 21 members
Tuvalu42.951Micronesia-555.524Highest and lowest reading in Oceania.
- Every region
22 sub-regions, highest middle country first
- Eastern Asia
176.314
the middle country, of 7 measured · 8 members
Hong Kong595.921 North Korea19.207
Highest and lowest reading in Eastern Asia.
- Central Asia
80.721
the middle country, of 5 measured · 5 members
 Turkmenistan316.593
 Kazakhstan-1.531
Highest and lowest reading in Central Asia.
- Northern Europe
71.605
the middle country, of 10 measured · 13 members
 Ireland187.387
 Latvia26.461
Highest and lowest reading in Northern Europe.
- South America
67.573
the middle country, of 12 measured · 12 members
 Suriname191.967
 Bolivia26.581
Highest and lowest reading in South America.
- Southern Europe
62.876
the middle country, of 12 measured · 17 members
Montenegro366.654 North Macedonia28.302
Highest and lowest reading in Southern Europe.
- Western Europe
59.089
the middle country, of 7 measured · 9 members
 Belgium224.737
 Germany42.327
Highest and lowest reading in Western Europe.
- Western Asia
58.968
the middle country, of 17 measured · 19 members
Kuwait583.504Syria-2.839Highest and lowest reading in Western Asia.
- Central America
52.855
the middle country, of 8 measured · 8 members
 Costa Rica161.149
 Guatemala37.949
Highest and lowest reading in Central America.
- South-eastern Asia
52.836
the middle country, of 10 measured · 11 members
Singapore1,198.829 Malaysia15.484
Highest and lowest reading in South-eastern Asia.
- Southern Asia
45.758
the middle country, of 9 measured · 9 members
 Bangladesh168.076
 Afghanistan4.791
Highest and lowest reading in Southern Asia.
- Eastern Europe
36.118
the middle country, of 10 measured · 10 members
 Belarus100.889Ukraine-1.439
Highest and lowest reading in Eastern Europe.
- Caribbean
25.427
the middle country, of 13 measured · 24 members
Trinidad and Tobago275.808Dominican Republic-18.873Highest and lowest reading in Caribbean.
- Southern Africa
23.962
the middle country, of 5 measured · 5 members
 Botswana70.975Eswatini-51.454
Highest and lowest reading in Southern Africa.
- Eastern Africa
17.647
the middle country, of 17 measured · 19 members
Djibouti210.497 Mauritius-26.886
Highest and lowest reading in Eastern Africa.
- Northern Africa
13.322
the middle country, of 6 measured · 6 members
 Egypt185.693
 Algeria4.679
Highest and lowest reading in Northern Africa.
- Western Africa
11.550
the middle country, of 16 measured · 16 members
 Cabo Verde40.505
 Ghana-8.115
Highest and lowest reading in Western Africa.
- Middle Africa
7.553
the middle country, of 9 measured · 9 members
 Chad21.998
 Equatorial Guinea-4.073
Highest and lowest reading in Middle Africa.
- Australia and New Zealand
2 of 2 measured — too few for a middle: Australia, New Zealand.
 New Zealand20.306
 Australia15.323
Highest and lowest reading in Australia and New Zealand.
- Melanesia
4 of 5 measured — too few for a middle: Fiji, Papua New Guinea, Solomon Islands, Vanuatu.
 Fiji11.087
 Vanuatu-36.244
Highest and lowest reading in Melanesia.
- Micronesia
3 of 7 measured — too few for a middle: Kiribati, Micronesia, Nauru.
 Nauru-42.246Micronesia-555.524
Highest and lowest reading in Micronesia.
- Northern America
2 of 4 measured — too few for a middle: Canada, United States.
 Canada45.746
 United States35.604
Highest and lowest reading in Northern America.
- Polynesia
3 of 7 measured — too few for a middle: Samoa, Tonga, Tuvalu.
Tuvalu42.951 Samoa-14.027
Highest and lowest reading in Polynesia.
03The whole field at once
The spread
187 countries, one dot each, on one scale — further right is a higher value. Half the countries are above 37.634; a quarter are above 72.557, and a quarter below 12.074. The bar in each row marks that continent’s middle country.
04All 187 ever measured
Every country
In order, highest value first. No rank or position is shown: too many countries share the same value for an order to mean anything. Neither end is the good end: a big surplus pollutes and a deficit exhausts the soil, and the healthy reading is a modest surplus in between. The extreme figures at both ends come from countries with very little cropland, where a small quantity of nitrogen spread over a few hundred hectares becomes a very large number per hectare.
Showing 25 of 187 countries




















































































































Values for 2023. The change column compares 2023 with 2022 only; the sparkline covers the recent editions.
051961–2023 · 63 reference years
Over time
Each point is one year from 1961, as FAO's latest release calculates it, which makes this one of the longest environmental series on the site.
- the middle country
- the middle half of countries
- the middle of the 157 countries measured every time
- each continent’s middle country
The same, year by year
| Year | Countries | Middle country | Middle half | Measured every time |
|---|---|---|---|---|
| 2023 | 187 | 37.634 | 12.074 – 72.557 | 36.392 |
| 2022 | 187 | 35.108 | 12.523 – 68.977 | 34.222 |
| 2021 | 187 | 39.854 | 12.693 – 73.478 | 39.694 |
| 2020 | 187 | 42.230 | 13.237 – 76.576 | 38.789 |
| 2019 | 187 | 38.685 | 12.266 – 74.207 | 38.240 |
| 2018 | 187 | 37.820 | 12.584 – 74.446 | 37.203 |
| 2017 | 187 | 36.298 | 13.003 – 77.984 | 35.277 |
| 2016 | 187 | 33.930 | 12.001 – 77.931 | 33.393 |
| 2015 | 187 | 35.783 | 11.928 – 81.231 | 34.885 |
| 2014 | 187 | 35.459 | 10.281 – 75.326 | 34.609 |
| 2013 | 187 | 34.483 | 10.582 – 78.588 | 33.839 |
| 2012 | 187 | 37.626 | 10.719 – 80.837 | 34.644 |
| 2011 | 185 | 32.551 | 8.495 – 72.298 | 29.135 |
| 2010 | 185 | 34.478 | 9.342 – 77.493 | 31.033 |
| 2009 | 185 | 29.194 | 6.926 – 65.019 | 26.313 |
| 2008 | 185 | 28.206 | 8.555 – 70.588 | 23.703 |
| 2007 | 185 | 32.125 | 9.637 – 80.441 | 29.877 |
| 2006 | 185 | 29.923 | 7.189 – 77.348 | 26.515 |
| 2005 | 183 | 26.007 | 5.844 – 70.974 | 25.864 |
| 2004 | 183 | 29.073 | 6.167 – 68.865 | 27.818 |
| 2003 | 183 | 28.752 | 7.203 – 72.930 | 28.461 |
| 2002 | 183 | 28.623 | 8.289 – 72.858 | 28.411 |
| 2001 | 183 | 32.511 | 6.837 – 73.559 | 32.384 |
| 2000 | 183 | 32.175 | 8.648 – 67.825 | 32.312 |
| 1999 | 181 | 32.472 | 7.863 – 66.865 | 34.349 |
| 1998 | 181 | 33.391 | 7.835 – 69.183 | 34.330 |
| 1997 | 181 | 28.276 | 7.737 – 68.675 | 28.866 |
| 1996 | 181 | 25.669 | 7.165 – 68.971 | 23.704 |
| 1995 | 181 | 25.286 | 7.385 – 68.234 | 23.794 |
| 1994 | 181 | 28.864 | 7.051 – 63.429 | 24.189 |
| 1993 | 181 | 29.439 | 8.274 – 62.973 | 25.863 |
| 1992 | 177 | 28.458 | 8.702 – 68.106 | 26.011 |
| 1991 | 158 | 24.064 | 6.038 – 70.175 | 22.398 |
| 1990 | 157 | 24.731 | 6.598 – 67.632 | 24.731 |
| 1989 | 157 | 26.286 | 6.806 – 77.995 | 26.286 |
| 1988 | 157 | 24.202 | 6.041 – 70.758 | 24.202 |
| 1987 | 157 | 25.354 | 6.570 – 63.399 | 25.354 |
| 1986 | 157 | 21.034 | 5.098 – 65.367 | 21.034 |
| 1985 | 157 | 19.888 | 5.145 – 67.254 | 19.888 |
| 1984 | 157 | 20.954 | 6.096 – 62.575 | 20.954 |
| 1983 | 157 | 21.490 | 5.645 – 61.694 | 21.490 |
| 1982 | 157 | 21.908 | 3.950 – 66.989 | 21.908 |
| 1981 | 157 | 19.110 | 4.833 – 68.853 | 19.110 |
| 1980 | 157 | 17.408 | 4.147 – 53.628 | 17.408 |
| 1979 | 157 | 17.611 | 3.771 – 51.547 | 17.611 |
| 1978 | 157 | 14.943 | 3.270 – 55.171 | 14.943 |
| 1977 | 157 | 14.850 | 3.224 – 67.448 | 14.850 |
| 1976 | 157 | 14.808 | 2.061 – 55.419 | 14.808 |
| 1975 | 157 | 12.559 | 2.676 – 55.750 | 12.559 |
| 1974 | 157 | 12.826 | 2.234 – 50.060 | 12.826 |
| 1973 | 157 | 15.357 | 3.201 – 53.804 | 15.357 |
| 1972 | 157 | 13.707 | 2.496 – 45.081 | 13.707 |
| 1971 | 157 | 11.841 | 1.258 – 45.686 | 11.841 |
| 1970 | 157 | 10.872 | 1.541 – 45.492 | 10.872 |
| 1969 | 157 | 10.880 | 0.725 – 45.546 | 10.880 |
| 1968 | 157 | 10.790 | 0.822 – 39.365 | 10.790 |
| 1967 | 157 | 9.548 | 0.465 – 34.841 | 9.548 |
| 1966 | 157 | 8.063 | 0.580 – 34.501 | 8.063 |
| 1965 | 157 | 8.599 | -0.132 – 31.424 | 8.599 |
| 1964 | 157 | 7.800 | 0.030 – 31.203 | 7.800 |
| 1963 | 157 | 7.960 | 0.106 – 29.660 | 7.960 |
| 1962 | 157 | 7.407 | -0.693 – 28.542 | 7.407 |
| 1961 | 157 | 7.374 | -0.050 – 26.178 | 7.374 |
062022 → 2023
Who rose and fell
The biggest changes in value between the two newest editions — reference years recalculated in one report, not two separate publications. Places are shown second, because they also move when other countries do.
Rose most
before → after- Singapore1,003.123 → 1,198.829+195.705
- Suriname137.427 → 191.967+54.540
 Belize14.105 → 64.109+50.004
- Turkmenistan267.670 → 316.593+48.922
 Malawi39.724 → 74.996+35.272
Fell most
before → after- Mauritius35.748 → -26.886−62.634
 Hungary59.007 → 8.620−50.387
 Serbia63.077 → 30.573−32.504
 Slovakia68.340 → 38.175−30.165
- Dominican Republic6.095 → -18.873−24.968
187 countries were measured in both 2022 and 2023.
07Across every edition
Cropland nitrogen balance in records
The extremes of the statistic. A record reached by more than one country names none of them.
Highest reading on record
3,309.031
Nitrogen surplus (+) or deficit (−) on cropland, kg per hectare
Lowest reading on record
-555.524
Nitrogen surplus (+) or deficit (−) on cropland, kg per hectare
Biggest rise between editions
+780.427
1,395.305 → 2,175.732
Biggest fall between editions
−953.847
1,579.602 → 625.755
Biggest change since first measured
+873.329
325.500 → 1,198.829
Highest most often
44 of 63
editions, alone at the first-listed end
08The measure
About cropland nitrogen balance
This is how much more nitrogen goes onto a country's cropland each year — as fertiliser, manure, fixation by crops and deposition from the air — than leaves it in the harvest, per hectare. The surplus is the nitrogen that ends up in rivers, groundwater and the air; a deficit means the soil itself is being drawn down.
What the number is: Nitrogen surplus (+) or deficit (−) on cropland, kg per hectare.
09Where it fits
Connections
Its part in the Country Index, the statistics whose values line up most closely with it across countries, and others on the same subject.
In the Country Index
Context, with no vote
This statistic is published in full under Environment & Sustainability and Food & Agriculture, but does not help decide any Country Index standing.
Environment & SustainabilityFood & AgricultureWhich statistics vote, and why
Moves with
Where cropland nitrogen balance is higher, these tend to be higher too.
- Fertilizer Consumption per HectareFAO · 183 countries in commonρ 0.73
- Life Expectancy at BirthKeyUN DESA Population Division · 187 countries in commonρ 0.61
- Life Expectancy at Age 65UN DESA Population Division · 187 countries in commonρ 0.58
Moves against
Where cropland nitrogen balance is higher, these tend to be lower.
- Adult Mortality (Probability of Dying Between 15 and 60)UN DESA Population Division · 187 countries in commonρ −0.60
- Maternal Mortality RatioKeyMMEIG · 185 countries in commonρ −0.55
- Prevalence of Moderate or Severe Food InsecurityFAO · 134 countries in commonρ −0.55
Rank correlation (ρ, from −1 to 1) across countries, on each statistic’s newest edition, out of 382 statistics sharing at least 80 countries with this one. Two statistics that move together do not cause each other.
10Keep reading
Explore further
11Questions
Cropland nitrogen balance: questions and answers
Which country has the highest cropland nitrogen balance?
Singapore, at 1,198.829, among the 187 countries compared in 2023.
Which country has the lowest cropland nitrogen balance?
Micronesia, at -555.524, among the 187 countries compared in 2023.
How many countries does the Cropland Nitrogen Balance cover?
187 in 2023. The number measured varies from 157 to 187 between editions.
What is the world average cropland nitrogen balance?
This site does not calculate a world average, which would depend on how countries are weighted. In the middle country of the 187 compared in 2023, the figure was 37.634.
Is this Food and Agriculture Organization of the United Nations (FAO)’s own ranking?
No ranking is shown. Food and Agriculture Organization of the United Nations (FAO) publishes values only, and too many countries share the same value for an ordering to mean anything, so none is derived.
How often is the Cropland Nitrogen Balance published?
This site holds 63 reference years, 1961–2023, all recalculated in Food and Agriculture Organization of the United Nations (FAO)’s 2025 report on one method — not 63 separate publications.
Where does the data come from, and can I download it?
From Food and Agriculture Organization of the United Nations (FAO), under CC BY 4.0. FAOSTAT's Cropland Nutrient Balance domain, read from FAO's own bulk download. The inputs, the removals, the nitrogen use efficiency and the national total are stored beside the balance. Every edition is on this site’s Datasets pages as a full table, and downloads as a CSV file with every value unrounded.
12Method
Sources, method and citation
Source
Cropland Nitrogen Balance — Food and Agriculture Organization of the United Nations (FAO)
FAOSTAT's Cropland Nutrient Balance domain, read from FAO's own bulk download. The inputs, the removals, the nitrogen use efficiency and the national total are stored beside the balance.
Newest edition
Report year 2023Data year 2023
Cite the source as: FAO. 2025. FAOSTAT: Cropland Nutrient Balance. Accessed on 29 September 2026. https://www.fao.org/faostat/en/#data/ESB Licence: CC-BY-4.0.
Licence: CC BY 4.0, checked 2026-09-29.
How this page reads the numbers
- No rank or position is shown: Food and Agriculture Organization of the United Nations (FAO) publishes values only, and too many countries share the same value for an ordering to mean anything.
- This statistic has no better end, so the page describes higher and lower values and never calls a country a leader.
- A country is named at an end only when it holds that value alone. Where several share it, the page says how many and names none first.
- Values are stored exactly as published and trimmed only for display. “The middle country” is the median of the countries measured, not a world average.
The file itself, column by column — where it came from, what each column holds, and every edition as a CSV — is on its dataset page.
Cite this page
Nations Inquiry (2026). Cropland nitrogen balance by country: Cropland Nitrogen Balance, data from Food and Agriculture Organization of the United Nations (FAO). https://nationsinquiry.com/statistics/cropland-nitrogen-balance