UN DESA Population Division · Urban Population Share (National Definitions)
Urban population by country
What share of people live in places their own country calls urban?
Of the 222 countries compared in 2025, 14 countries shared the highest reading, 100.000%, and Montserrat had the lowest reading, 8.980%. In the middle country the figure was 64.788%. Among the 222 countries measured in every edition since 1950, the middle one moved from 26.338% to 64.788%.
Share
Part ofPeople & Population
Urban population · 2025
Context statistic
14 countries share the highest value, 100.000% — no single country is named first.
012025 · values only
The highest and the lowest
The three countries with the highest values of 222 compared, the three with the lowest, and the highest on each continent. This statistic has no better end, so no country is shown as leading.
Highest in 2025 · shared
14 countries share the highest reading, 100.000%
No single country is named first: picking one from a shared value would be a choice the data does not make.





Lowest in 2025
 Montserrat8.980%
 Liechtenstein14.630%
 Papua New Guinea15.780%
This statistic has no better end: the two ends describe size, not success.
02Every measured country
Urban population on a map
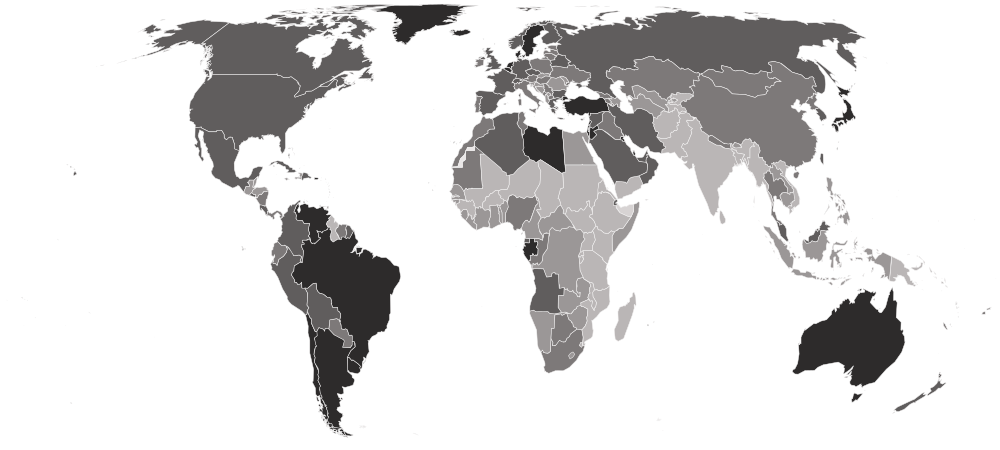
Each country is shaded by its value, in five groups holding the same number of countries. Hover a country for its value, or select it to open its profile. Below the map, each continent’s middle country.
Darker is a higher value. This statistic has no better end, so the shades describe size, not success.
- 8.980–39.526%
- 39.643–59.425%
- 59.444–71.145%
- 71.462–87.382%
- 87.673–100.000%
- No reading in 2025
- Americas
74.755%
the middle country, of 48 measured · 48 members
5 share 100.000%
Montserrat8.980%Highest and lowest reading in Americas.
- Europe
71.798%
the middle country, of 48 measured · 49 members
3 share 100.000%
Liechtenstein14.630%Highest and lowest reading in Europe.
- Asia
66.343%
the middle country, of 51 measured · 52 members
5 share 100.000%
 Sri Lanka20.450%
Highest and lowest reading in Asia.
- Oceania
65.448%
the middle country, of 21 measured · 21 members
 Nauru100.000%Papua New Guinea15.780%
Highest and lowest reading in Oceania.
- Africa
45.700%
the middle country, of 54 measured · 55 members
 Gabon92.088%
 Malawi17.595%
Highest and lowest reading in Africa.
- Every region
22 sub-regions, highest middle country first
- Western Europe
85.727%
the middle country, of 9 measured · 9 members
 Monaco100.000%Liechtenstein14.630%
Highest and lowest reading in Western Europe.
- Western Asia
85.287%
the middle country, of 18 measured · 19 members
2 share 100.000%
 Yemen37.034%
Highest and lowest reading in Western Asia.
- South America
82.190%
the middle country, of 12 measured · 12 members
 Uruguay95.654%
 Guyana26.491%
Highest and lowest reading in South America.
- Eastern Asia
80.048%
the middle country, of 8 measured · 8 members
2 share 100.000%
 North Korea64.190%
Highest and lowest reading in Eastern Asia.
- Micronesia
79.284%
the middle country, of 7 measured · 7 members
Nauru100.000% Micronesia22.481%
Highest and lowest reading in Micronesia.
- Northern Europe
72.623%
the middle country, of 12 measured · 13 members
 Iceland94.218%
 Faroe Islands39.643%
Highest and lowest reading in Northern Europe.
- Eastern Europe
70.145%
the middle country, of 10 measured · 10 members
 Belarus79.495%
 Moldova43.734%
Highest and lowest reading in Eastern Europe.
- Caribbean
67.133%
the middle country, of 24 measured · 24 members
4 share 100.000%
Montserrat8.980%Highest and lowest reading in Caribbean.
- Northern Africa
66.915%
the middle country, of 6 measured · 6 members
 Libya87.911%
 Sudan34.935%
Highest and lowest reading in Northern Africa.
- Southern Europe
65.609%
the middle country, of 17 measured · 17 members
2 share 100.000%
 Kosovo50.926%
Highest and lowest reading in Southern Europe.
- Middle Africa
64.124%
the middle country, of 9 measured · 9 members
Gabon92.088% Chad27.566%
Highest and lowest reading in Middle Africa.
- Central America
62.797%
the middle country, of 8 measured · 8 members
 Mexico80.041%
 Belize41.562%
Highest and lowest reading in Central America.
- Polynesia
61.758%
the middle country, of 7 measured · 7 members
 American Samoa80.512%
 Samoa17.506%
Highest and lowest reading in Polynesia.
- South-eastern Asia
55.773%
the middle country, of 11 measured · 11 members
 Singapore100.000%
 Timor-Leste28.786%
Highest and lowest reading in South-eastern Asia.
- Western Africa
53.955%
the middle country, of 16 measured · 16 members
 Cabo Verde77.630%
 Niger18.374%
Highest and lowest reading in Western Africa.
- Southern Africa
50.867%
the middle country, of 5 measured · 5 members
 Botswana67.956%
 Eswatini26.721%
Highest and lowest reading in Southern Africa.
- Central Asia
47.105%
the middle country, of 5 measured · 5 members
 Kazakhstan62.386%
 Tajikistan26.165%
Highest and lowest reading in Central Asia.
- Southern Asia
39.526%
the middle country, of 9 measured · 9 members
 Iran77.376%Sri Lanka20.450%
Highest and lowest reading in Southern Asia.
- Eastern Africa
34.241%
the middle country, of 18 measured · 19 members
 Djibouti72.976%Malawi17.595%
Highest and lowest reading in Eastern Africa.
- Melanesia
31.309%
the middle country, of 5 measured · 5 members
 New Caledonia68.172%Papua New Guinea15.780%
Highest and lowest reading in Melanesia.
- Australia and New Zealand
2 of 2 measured — too few for a middle: Australia, New Zealand.
 Australia87.719%
 New Zealand83.998%
Highest and lowest reading in Australia and New Zealand.
- Northern America
4 of 4 measured — too few for a middle: Bermuda, Canada, Greenland, United States.
 Bermuda100.000%
 United States80.192%
Highest and lowest reading in Northern America.
03The whole field at once
The spread
222 countries, one dot each, on one scale — further right is a higher value. Half the countries are above 64.788%; a quarter are above 81.009%, and a quarter below 44.582%. The bar in each row marks that continent’s middle country.
04All 222 ever measured
Every country
In order, highest value first. No rank or position is shown: too many countries share the same value for an order to mean anything. This is urban as each country defines it, so the table does not compare like with like: some countries count any settlement of a few hundred people as urban, others only places with the legal status of a town or city. That is why some large, densely settled countries sit lower here than their cities would suggest. The Degree of Urbanisation, published beside this statistic, applies one definition to every country.
Showing 25 of 222 countries








































































































































Values for 2025. The change column compares 2025 with 2024 only; the sparkline covers the recent editions.
051950–2025 · 76 reference years
Over time
Each point is one year's estimate, 1950 to 2025, from the 2025 revision of World Urbanization Prospects. The most recent years are carried forward from each country's latest census or official estimate rather than measured afresh.
- the middle country
- the middle half of countries
- the middle of the 222 countries measured every time
- each continent’s middle country
The same, year by year
| Year | Countries | Middle country | Middle half | Measured every time |
|---|---|---|---|---|
| 2025 | 222 | 64.788% | 44.582% – 81.009% | 64.788% |
| 2024 | 222 | 64.323% | 43.892% – 81.112% | 64.323% |
| 2023 | 222 | 63.907% | 43.362% – 81.282% | 63.907% |
| 2022 | 222 | 63.559% | 42.869% – 81.281% | 63.559% |
| 2021 | 222 | 63.534% | 42.640% – 81.399% | 63.534% |
| 2020 | 222 | 63.454% | 42.551% – 81.396% | 63.454% |
| 2019 | 222 | 63.168% | 42.536% – 81.162% | 63.168% |
| 2018 | 222 | 63.064% | 42.265% – 80.927% | 63.064% |
| 2017 | 222 | 62.928% | 41.722% – 80.839% | 62.928% |
| 2016 | 222 | 62.857% | 40.891% – 80.751% | 62.857% |
| 2015 | 222 | 62.799% | 40.179% – 80.666% | 62.799% |
| 2014 | 222 | 62.629% | 39.923% – 80.603% | 62.629% |
| 2013 | 222 | 62.173% | 39.896% – 80.052% | 62.173% |
| 2012 | 222 | 61.520% | 39.608% – 80.168% | 61.520% |
| 2011 | 222 | 60.992% | 39.435% – 80.083% | 60.992% |
| 2010 | 222 | 60.804% | 39.183% – 79.811% | 60.804% |
| 2009 | 222 | 60.111% | 38.607% – 79.689% | 60.111% |
| 2008 | 222 | 59.762% | 38.411% – 79.436% | 59.762% |
| 2007 | 222 | 59.518% | 38.210% – 78.867% | 59.518% |
| 2006 | 222 | 59.027% | 37.705% – 78.252% | 59.027% |
| 2005 | 222 | 58.349% | 37.323% – 77.763% | 58.349% |
| 2004 | 222 | 57.635% | 36.790% – 77.549% | 57.635% |
| 2003 | 222 | 56.732% | 36.298% – 77.280% | 56.732% |
| 2002 | 222 | 56.170% | 35.937% – 76.720% | 56.170% |
| 2001 | 222 | 56.023% | 35.794% – 76.376% | 56.023% |
| 2000 | 222 | 56.065% | 35.574% – 76.157% | 56.065% |
| 1999 | 222 | 55.981% | 35.317% – 75.985% | 55.981% |
| 1998 | 222 | 56.018% | 35.007% – 75.752% | 56.018% |
| 1997 | 222 | 55.546% | 34.937% – 75.433% | 55.546% |
| 1996 | 222 | 54.790% | 34.629% – 74.991% | 54.790% |
| 1995 | 222 | 54.289% | 34.407% – 74.919% | 54.289% |
| 1994 | 222 | 54.175% | 33.999% – 74.765% | 54.175% |
| 1993 | 222 | 53.827% | 33.886% – 74.586% | 53.827% |
| 1992 | 222 | 53.793% | 33.458% – 74.412% | 53.793% |
| 1991 | 222 | 53.465% | 32.935% – 74.053% | 53.465% |
| 1990 | 222 | 52.818% | 32.264% – 73.724% | 52.818% |
| 1989 | 222 | 52.440% | 32.553% – 72.743% | 52.440% |
| 1988 | 222 | 52.127% | 31.950% – 71.528% | 52.127% |
| 1987 | 222 | 51.803% | 32.179% – 71.255% | 51.803% |
| 1986 | 222 | 51.221% | 30.504% – 70.816% | 51.221% |
| 1985 | 222 | 50.732% | 29.775% – 70.574% | 50.732% |
| 1984 | 222 | 50.040% | 29.304% – 70.348% | 50.040% |
| 1983 | 222 | 49.583% | 28.131% – 69.967% | 49.583% |
| 1982 | 222 | 48.990% | 27.327% – 69.250% | 48.990% |
| 1981 | 222 | 48.095% | 27.088% – 68.243% | 48.095% |
| 1980 | 222 | 47.236% | 26.846% – 67.014% | 47.236% |
| 1979 | 222 | 47.041% | 26.457% – 66.235% | 47.041% |
| 1978 | 222 | 46.524% | 25.733% – 65.970% | 46.524% |
| 1977 | 222 | 45.832% | 25.125% – 65.434% | 45.832% |
| 1976 | 222 | 45.406% | 24.475% – 64.527% | 45.406% |
| 1975 | 222 | 44.220% | 24.147% – 63.906% | 44.220% |
| 1974 | 222 | 43.716% | 23.704% – 63.004% | 43.716% |
| 1973 | 222 | 43.289% | 23.382% – 62.999% | 43.289% |
| 1972 | 222 | 42.111% | 22.741% – 62.283% | 42.111% |
| 1971 | 222 | 40.997% | 22.407% – 60.937% | 40.997% |
| 1970 | 222 | 40.167% | 22.083% – 60.163% | 40.167% |
| 1969 | 222 | 39.350% | 21.852% – 59.596% | 39.350% |
| 1968 | 222 | 38.554% | 21.536% – 59.049% | 38.554% |
| 1967 | 222 | 38.273% | 21.088% – 58.527% | 38.273% |
| 1966 | 222 | 37.559% | 20.526% – 56.819% | 37.559% |
| 1965 | 222 | 37.272% | 19.934% – 56.007% | 37.272% |
| 1964 | 222 | 36.995% | 19.505% – 55.099% | 36.995% |
| 1963 | 222 | 36.002% | 18.915% – 54.147% | 36.002% |
| 1962 | 222 | 35.483% | 18.471% – 53.696% | 35.483% |
| 1961 | 222 | 34.980% | 18.018% – 53.820% | 34.980% |
| 1960 | 222 | 34.340% | 17.453% – 53.773% | 34.340% |
| 1959 | 222 | 33.766% | 16.950% – 53.216% | 33.766% |
| 1958 | 222 | 32.746% | 16.037% – 51.304% | 32.746% |
| 1957 | 222 | 31.947% | 15.505% – 50.513% | 31.947% |
| 1956 | 222 | 31.113% | 14.801% – 49.765% | 31.113% |
| 1955 | 222 | 30.440% | 14.114% – 48.786% | 30.440% |
| 1954 | 222 | 29.634% | 13.851% – 47.294% | 29.634% |
| 1953 | 222 | 28.817% | 13.187% – 46.153% | 28.817% |
| 1952 | 222 | 28.302% | 12.775% – 45.444% | 28.302% |
| 1951 | 222 | 27.530% | 12.515% – 44.984% | 27.530% |
| 1950 | 222 | 26.338% | 12.006% – 43.756% | 26.338% |
062024 → 2025
Who rose and fell
The biggest changes in value between the two newest editions — reference years recalculated in one report, not two separate publications. Places are shown second, because they also move when other countries do.
Rose most
before → after Rwanda29.885% → 30.913%+1.028
 Lesotho43.678% → 44.670%+0.992
 Thailand61.869% → 62.799%+0.930
 Kiribati62.462% → 63.385%+0.923
 British Virgin Islands56.507% → 57.395%+0.888
Fell most
before → after- American Samoa80.945% → 80.512%−0.432
- Belize41.753% → 41.562%−0.191
 Antigua and Barbuda24.391% → 24.333%−0.057
 Aruba61.791% → 61.749%−0.042
- Liechtenstein14.658% → 14.630%−0.028
222 countries were measured in both 2024 and 2025.
07Across every edition
Urban population in records
The extremes of the statistic. A record reached by more than one country names none of them.
Highest reading on record
Reached 840 times by 14 countries — shared, so no holder is named
100.000%
Share of the population living in areas the country itself defines as urban (%)
Lowest reading on record
0.010%
Share of the population living in areas the country itself defines as urban (%)
Biggest rise between editions
+25.096
35.830% → 60.926%
Biggest fall between editions
−14.267
18.946% → 4.679%
Biggest change since first measured
+88.441
11.559% → 100.000%
08The measure
About urban population
The share of a country's people living in places its own government classifies as urban. It is the familiar per-cent-urban figure and tracks one of the great shifts of the last century — but each country draws the line between town and countryside in its own way.
What the number is: Share of the population living in areas the country itself defines as urban (%).
09Where it fits
Connections
Its part in the Country Index, the statistics whose values line up most closely with it across countries, and others on the same subject.
In the Country Index
Context, with no vote
This statistic is published in full under People & Population, but does not help decide any Country Index standing.
Moves with
Where urban population is higher, these tend to be higher too.
- Internet Use Among AdultsWorld Bank Group · 140 countries in commonρ 0.72
- Employment in ServicesILO · 181 countries in commonρ 0.72
- Human Capital Wealth per CapitaWorld Bank Group · 151 countries in commonρ 0.72
Moves against
Where urban population is higher, these tend to be lower.
- Employment in AgricultureILO · 181 countries in commonρ −0.74
- Vulnerable EmploymentKeyILO · 181 countries in commonρ −0.69
- Self-Employment RateILO · 181 countries in commonρ −0.68
Rank correlation (ρ, from −1 to 1) across countries, on each statistic’s newest edition, out of 386 statistics sharing at least 80 countries with this one. Two statistics that move together do not cause each other.
10Keep reading
Explore further
The subject
The countries at either end
11Questions
Urban population: questions and answers
Which country has the highest urban population?
14 countries share the highest reading, 100.000%, among the 222 compared in 2025, so no single country is named.
Which country has the lowest urban population?
Montserrat, at 8.980%, among the 222 countries compared in 2025.
How many countries does the Urban Population Share (National Definitions) cover?
222 in 2025.
What is the world average urban population?
This site does not calculate a world average, which would depend on how countries are weighted. In the middle country of the 222 compared in 2025, the figure was 64.788%.
Is this UN DESA Population Division’s own ranking?
No ranking is shown. UN DESA Population Division publishes values only, and too many countries share the same value for an ordering to mean anything, so none is derived.
How often is the Urban Population Share (National Definitions) published?
This site holds 76 reference years, 1950–2025, all recalculated in UN DESA Population Division’s 2025 report on one method — not 76 separate publications.
Where does the data come from, and can I download it?
From UN DESA Population Division, under CC BY 3.0 IGO. From World Urbanization Prospects 2025, read from the UN Population Division's own workbook of urban and rural shares by national definition. The workbook continues to 2050; those later years are projections and are excluded. Every edition is on this site’s Datasets pages as a full table, and downloads as a CSV file with every value unrounded.
12Method
Sources, method and citation
Source
Urban Population Share (National Definitions) — UN DESA Population Division
From World Urbanization Prospects 2025, read from the UN Population Division's own workbook of urban and rural shares by national definition. The workbook continues to 2050; those later years are projections and are excluded.
Newest edition
Report year 2025Data year 2025
Cite the source as: United Nations, Department of Economic and Social Affairs, Population Division (2025). World Urbanization Prospects: The 2025 Revision, Online Edition.
Licence: CC BY 3.0 IGO, checked 2026-09-29.
How this page reads the numbers
- No rank or position is shown: UN DESA Population Division publishes values only, and too many countries share the same value for an ordering to mean anything.
- This statistic has no better end, so the page describes higher and lower values and never calls a country a leader.
- A country is named at an end only when it holds that value alone. Where several share it, the page says how many and names none first.
- Values are stored exactly as published and trimmed only for display. “The middle country” is the median of the countries measured, not a world average.
The file itself, column by column — where it came from, what each column holds, and every edition as a CSV — is on its dataset page.
Cite this page
Nations Inquiry (2026). Urban population by country: Urban Population Share (National Definitions), data from UN DESA Population Division. https://nationsinquiry.com/statistics/urban-population-share