UN DESA Population Division · International Migrants
International migrants by country
How many international migrants live in each country?
Of the 221 countries compared in 2024, United States had the highest reading, 52,375,047, and Tuvalu had the lowest reading, 246. In the middle country the figure was 223,323. Among the 220 countries measured in every edition since 1990, the middle one moved from 116,794 to 221,897.
Share
International migrants · 2024
Context statistic

Highest of 221United States
52,375,047012024 · values only
The highest and the lowest
The three countries with the highest values of 221 compared, the three with the lowest, and the highest on each continent. This statistic has no better end, so no country is shown as leading.
- 1
- 2

- 3

Lowest in 2024
 Tuvalu246
 Vatican City496
 Niue588
This statistic has no better end: the two ends describe size, not success.
Highest on each continent
- Africa
 Côte d’Ivoire2,880,839
- AmericasUnited States52,375,047
- AsiaSaudi Arabia13,683,841
- EuropeGermany16,750,084
- Oceania
 Australia8,111,404
- Every region
02Every measured country
International migrants on a map
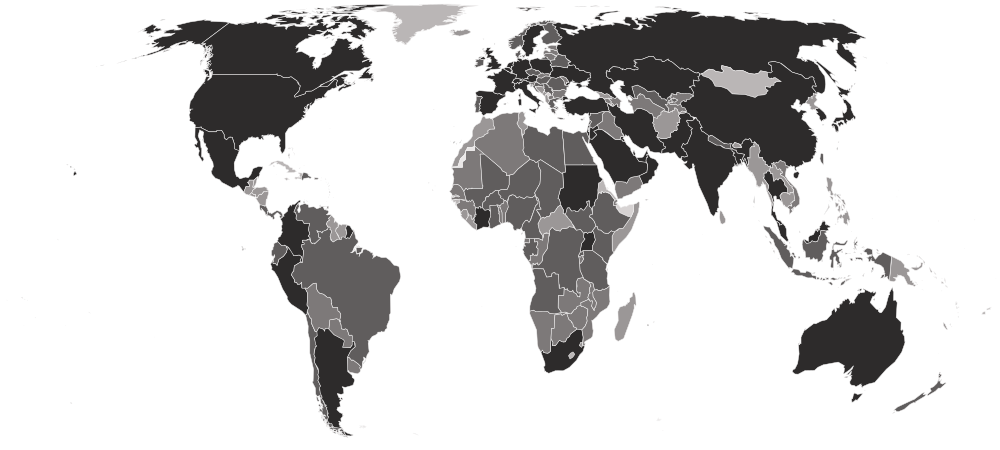
Each country is shaded by its value, in five groups holding the same number of countries. Hover a country for its value, or select it to open its profile. Below the map, each continent’s middle country.
Darker is a higher value. This statistic has no better end, so the shades describe size, not success.
- 246–29,142
- 30,099–111,069
- 113,478–429,108
- 445,726–1,538,324
- 1,638,718–52,375,047
- No reading in 2024
- Europe
521,132
the middle country, of 48 measured · 49 members
Germany16,750,084Vatican City496Highest and lowest reading in Europe.
- Asia
470,719
the middle country, of 51 measured · 52 members
Saudi Arabia13,683,841 Timor-Leste8,303
Highest and lowest reading in Asia.
- Africa
281,931
the middle country, of 54 measured · 55 members
Côte d’Ivoire2,880,839 São Tomé and Príncipe1,955
Highest and lowest reading in Africa.
- Americas
56,779
the middle country, of 47 measured · 48 members
United States52,375,047 Montserrat1,402
Highest and lowest reading in Americas.
- Oceania
4,937
the middle country, of 21 measured · 21 members
Australia8,111,404Tuvalu246Highest and lowest reading in Oceania.
- Every region
22 sub-regions, highest middle country first
- Western Europe
2,349,032
the middle country, of 9 measured · 9 members
Germany16,750,084 Monaco27,106
Highest and lowest reading in Western Europe.
- Eastern Asia
1,387,572
the middle country, of 8 measured · 8 members
 Japan3,409,529
 Mongolia22,589
Highest and lowest reading in Eastern Asia.
- Western Asia
1,159,313
the middle country, of 18 measured · 19 members
Saudi Arabia13,683,841 Georgia81,582
Highest and lowest reading in Western Asia.
- South America
1,005,527
the middle country, of 12 measured · 12 members
 Colombia3,063,518
 Suriname51,902
Highest and lowest reading in South America.
- Eastern Europe
857,382
the middle country, of 10 measured · 10 members
 Russia7,605,774
 Moldova188,207
Highest and lowest reading in Eastern Europe.
- Northern Africa
578,605
the middle country, of 6 measured · 6 members
 Sudan2,397,113
 Tunisia63,201
Highest and lowest reading in Northern Africa.
- Southern Asia
470,719
the middle country, of 9 measured · 9 members
 India4,796,255
 Sri Lanka40,698
Highest and lowest reading in Southern Asia.
- Middle Africa
449,746
the middle country, of 9 measured · 9 members
 Chad1,269,673São Tomé and Príncipe1,955
Highest and lowest reading in Middle Africa.
- Eastern Africa
301,174
the middle country, of 18 measured · 19 members
 Uganda2,057,759
 Comoros12,449
Highest and lowest reading in Eastern Africa.
- Western Africa
281,931
the middle country, of 16 measured · 16 members
Côte d’Ivoire2,880,839 Guinea-Bissau15,064
Highest and lowest reading in Western Africa.
- Central Asia
276,777
the middle country, of 5 measured · 5 members
 Kazakhstan2,089,797
 Turkmenistan193,763
Highest and lowest reading in Central Asia.
- Northern Europe
220,471
the middle country, of 13 measured · 13 members
 United Kingdom11,845,479
 Faroe Islands8,101
Highest and lowest reading in Northern Europe.
- Southern Europe
175,184
the middle country, of 16 measured · 17 members
 Spain8,870,527Vatican City496
Highest and lowest reading in Southern Europe.
- South-eastern Asia
119,933
the middle country, of 11 measured · 11 members
 Malaysia3,806,514Timor-Leste8,303
Highest and lowest reading in South-eastern Asia.
- Southern Africa
116,035
the middle country, of 5 measured · 5 members
 South Africa2,631,100
 Lesotho15,039
Highest and lowest reading in Southern Africa.
- Central America
80,719
the middle country, of 8 measured · 8 members
 Mexico1,726,089
 Honduras39,901
Highest and lowest reading in Central America.
- Caribbean
28,455
the middle country, of 23 measured · 24 members
 Dominican Republic738,667Montserrat1,402
Highest and lowest reading in Caribbean.
- Melanesia
14,362
the middle country, of 5 measured · 5 members
 New Caledonia76,738
 Solomon Islands2,469
Highest and lowest reading in Melanesia.
- Polynesia
3,843
the middle country, of 7 measured · 7 members
 French Polynesia30,099Tuvalu246
Highest and lowest reading in Polynesia.
- Micronesia
3,309
the middle country, of 7 measured · 7 members
 Guam84,159
 Nauru2,548
Highest and lowest reading in Micronesia.
- Australia and New Zealand
2 of 2 measured — too few for a middle: Australia, New Zealand.
Australia8,111,404 New Zealand1,467,989
Highest and lowest reading in Australia and New Zealand.
- Northern America
4 of 4 measured — too few for a middle: Bermuda, Canada, Greenland, United States.
United States52,375,047 Greenland5,812
Highest and lowest reading in Northern America.
03The whole field at once
The spread
221 countries, one dot each, on one scale — further right is a higher value. Half the countries are above 223,323; a quarter are above 1,139,820, and a quarter below 40,698. The bar in each row marks that continent’s middle country.
Log scale: each gridline is ten times the one before, so countries of very different sizes can be seen on one line.
04All 221 ever measured
Every country
In order, highest value first. No rank or position is shown: too many countries share the same value for an order to mean anything. Neither end is better, and the order is mostly one of size: populous countries host the most migrants in absolute terms. Countries also count differently — by country of birth in most places, by citizenship in some — so the type of data is printed beside each figure.
Showing 25 of 221 countries

















































































































































Values for 2024. The change column compares 2024 with 2020 only; the sparkline covers the recent editions.
051990–2024 · 8 reference years
Over time
Each point is one of eight reference years from 1990, as restated by the 2024 revision; there are no estimates for the years between. Before independence, a few countries repeat one back-estimated figure, so no trend can be read across those years.
- the middle country
- the middle half of countries
- the middle of the 220 countries measured every time
- each continent’s middle country
The same, year by year
| Year | Countries | Middle country | Middle half | Measured every time |
|---|---|---|---|---|
| 2024 | 221 | 223,323 | 40,698 – 1,139,820 | 221,897 |
| 2020 | 221 | 199,011 | 39,195 – 952,871 | 198,953 |
| 2015 | 221 | 190,896 | 37,611 – 797,374 | 187,803 |
| 2010 | 221 | 157,788 | 32,825 – 618,709 | 153,875 |
| 2005 | 220 | 141,923 | 29,462 – 623,610 | 141,923 |
| 2000 | 220 | 135,875 | 26,895 – 561,915 | 135,875 |
| 1995 | 220 | 125,930 | 25,606 – 534,140 | 125,930 |
| 1990 | 220 | 116,794 | 23,572 – 488,319 | 116,794 |
062020 → 2024
Who rose and fell
The biggest changes in value between the two newest editions — reference years recalculated in one report, not two separate publications. Places are shown second, because they also move when other countries do.
Rose most
before → after- United States50,471,028 → 52,375,047+1,904,019
- Germany15,021,300 → 16,750,084+1,728,784
- Spain7,146,130 → 8,870,527+1,724,397
- United Kingdom10,520,870 → 11,845,479+1,324,609
- Colombia1,932,807 → 3,063,518+1,130,711
Fell most
before → after Lebanon1,586,346 → 1,422,583−163,763
- India4,929,816 → 4,796,255−133,561
 Venezuela1,324,193 → 1,263,304−60,889
 Kenya1,050,147 → 992,536−57,611
 Afghanistan144,098 → 98,110−45,988
221 countries were measured in both 2020 and 2024.
07Across every edition
International migrants in records
The extremes of the statistic. A record reached by more than one country names none of them.
Highest reading on record
52,375,047
International migrants living in the country, mid-year (people)
Lowest reading on record
209
International migrants living in the country, mid-year (people)
Biggest rise between editions
+6,281,125
28,525,723 → 34,806,848
Biggest fall between editions
−2,538,896
6,208,204 → 3,669,308
Biggest change since first measured
+29,108,900
23,266,147 → 52,375,047
Highest most often
8 of 8
editions, alone at the first-listed end
08The measure
About international migrants
This is the number of international migrants living in each country — people born in another country, or foreign citizens where a country counts by citizenship, including refugees. The UN Population Division estimates it for every country from censuses, population registers and surveys.
What the number is: International migrants living in the country, mid-year (people).
09Where it fits
Connections
Its part in the Country Index, the statistics whose values line up most closely with it across countries, and others on the same subject.
In the Country Index
Context, with no vote
This statistic is published in full under Mobility & Trade and People & Population, but does not help decide any Country Index standing.
Mobility & TradePeople & PopulationWhich statistics vote, and why
Moves with
Where international migrants is higher, these tend to be higher too.
- Scholarly ArticlesOurResearch · 217 countries in commonρ 0.85
- GitHub DevelopersGitHub · 217 countries in commonρ 0.82
- GitHub RepositoriesGitHub · 216 countries in commonρ 0.81
Moves against
Where international migrants is higher, these tend to be lower.
- Outbound Mobility Ratio, TertiaryUIS · 117 countries in commonρ −0.51
- Cost of a Healthy DietFAO · 159 countries in commonρ −0.49
- Net Official Development Assistance ReceivedOECD Development Assistance Committee · 129 countries in commonρ −0.47
Rank correlation (ρ, from −1 to 1) across countries, on each statistic’s newest edition, out of 386 statistics sharing at least 80 countries with this one. Two statistics that move together do not cause each other.
10Keep reading
Explore further
The subject
The countries at either end
11Questions
International migrants: questions and answers
Which country has the highest international migrants?
United States, at 52,375,047, among the 221 countries compared in 2024.
Which country has the lowest international migrants?
Tuvalu, at 246, among the 221 countries compared in 2024.
How many countries does the International Migrants cover?
221 in 2024. The number measured varies from 220 to 221 between editions.
What is the world average international migrants?
This site does not calculate a world average, which would depend on how countries are weighted. In the middle country of the 221 compared in 2024, the figure was 223,323.
Is this UN DESA Population Division’s own ranking?
No ranking is shown. UN DESA Population Division publishes values only, and too many countries share the same value for an ordering to mean anything, so none is derived.
How often is the International Migrants published?
This site holds 8 reference years, 1990–2024, all recalculated in UN DESA Population Division’s 2024 report on one method — not 8 separate publications.
Where does the data come from, and can I download it?
From UN DESA Population Division, under CC BY 3.0 IGO. From International Migrant Stock 2024, read from the UN Population Division's own workbook. The World Bank republishes the same counts; its copy of the share is rounded to one decimal, which is why the Division's own file is used here. Every edition is on this site’s Datasets pages as a full table, and downloads as a CSV file with every value unrounded.
12Method
Sources, method and citation
Source
International Migrants — UN DESA Population Division
From International Migrant Stock 2024, read from the UN Population Division's own workbook. The World Bank republishes the same counts; its copy of the share is rounded to one decimal, which is why the Division's own file is used here.
Newest edition
Report year 2024Data year 2024
Cite the source as: United Nations Department of Economic and Social Affairs, Population Division (2024). International Migrant Stock 2024.
Licence: CC BY 3.0 IGO, checked 2026-09-29.
How this page reads the numbers
- No rank or position is shown: UN DESA Population Division publishes values only, and too many countries share the same value for an ordering to mean anything.
- This statistic has no better end, so the page describes higher and lower values and never calls a country a leader.
- A country is named at an end only when it holds that value alone. Where several share it, the page says how many and names none first.
- Values are stored exactly as published and trimmed only for display. “The middle country” is the median of the countries measured, not a world average.
The file itself, column by column — where it came from, what each column holds, and every edition as a CSV — is on its dataset page.
Cite this page
Nations Inquiry (2026). International migrants by country: International Migrants, data from UN DESA Population Division. https://nationsinquiry.com/statistics/international-migrants