UN DESA Population Division · Mean Age at Childbearing
Mean age at childbearing by country
How old are mothers, on average, when their children are born?
Of the 222 countries compared in 2023, South Korea had the highest reading, 33.424, and Nepal had the lowest reading, 25.346. In the middle country the figure was 29.079. Among the 222 countries measured in every edition since 1950, the middle one moved from 29.196 to 29.079.
Share
Part ofPeople & Population
Mean age at childbearing · 2023
Context statistic

Highest of 222South Korea
33.424012023 · values only
The highest and the lowest
The three countries with the highest values of 222 compared, the three with the lowest, and the highest on each continent. This statistic has no better end, so no country is shown as leading.
- 1
- 2

- 3

Lowest in 2023
 Nepal25.346
 Azerbaijan25.930
 Nicaragua25.969
This statistic has no better end: the two ends describe size, not success.
Highest on each continent
- Africa
 Libya31.885
- Americas
 Bermuda32.103
- AsiaSouth Korea33.424
- EuropeSan Marino32.848
- Oceania
 Australia31.391
- Every region
02Every measured country
Mean age at childbearing on a map
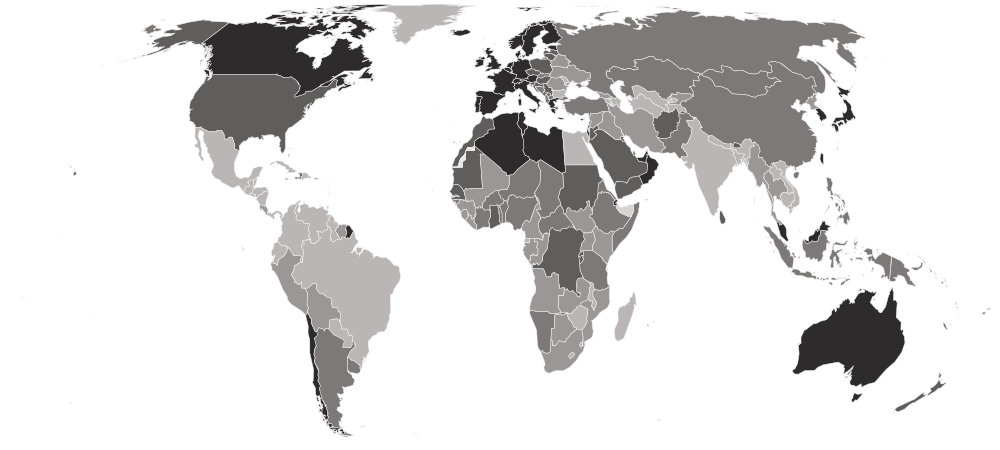
Each country is shaded by its value, in five groups holding the same number of countries. Hover a country for its value, or select it to open its profile. Below the map, each continent’s middle country.
Darker is a higher value. This statistic has no better end, so the shades describe size, not success.
- 25.346–28.062
- 28.094–28.859
- 28.875–29.468
- 29.505–30.830
- 30.835–33.424
- No reading in 2023
- Europe
30.844
the middle country, of 48 measured · 49 members
San Marino32.848 Bulgaria27.948
Highest and lowest reading in Europe.
- Asia
29.217
the middle country, of 51 measured · 52 members
South Korea33.424Nepal25.346Highest and lowest reading in Asia.
- Oceania
29.137
the middle country, of 21 measured · 21 members
Australia31.391 Marshall Islands27.098
Highest and lowest reading in Oceania.
- Africa
28.956
the middle country, of 54 measured · 55 members
Libya31.885 Equatorial Guinea27.049
Highest and lowest reading in Africa.
- Americas
28.195
the middle country, of 48 measured · 48 members
Bermuda32.103Nicaragua25.969Highest and lowest reading in Americas.
- Every region
22 sub-regions, highest middle country first
- Eastern Asia
31.895
the middle country, of 8 measured · 8 members
South Korea33.424 North Korea28.777
Highest and lowest reading in Eastern Asia.
- Western Europe
31.580
the middle country, of 9 measured · 9 members
 Luxembourg32.323
 Monaco30.852
Highest and lowest reading in Western Europe.
- Northern Europe
30.934
the middle country, of 12 measured · 13 members
 Ireland32.702
 Isle of Man29.700
Highest and lowest reading in Northern Europe.
- Southern Europe
30.660
the middle country, of 17 measured · 17 members
San Marino32.848 North Macedonia28.999
Highest and lowest reading in Southern Europe.
- Northern Africa
30.633
the middle country, of 6 measured · 6 members
Libya31.885 Egypt27.990
Highest and lowest reading in Northern Africa.
- Western Asia
29.778
the middle country, of 18 measured · 19 members
 United Arab Emirates31.897Azerbaijan25.930
Highest and lowest reading in Western Asia.
- Polynesia
29.195
the middle country, of 7 measured · 7 members
 Tonga29.945
 Niue29.110
Highest and lowest reading in Polynesia.
- Melanesia
29.166
the middle country, of 5 measured · 5 members
 New Caledonia30.487
 Vanuatu28.094
Highest and lowest reading in Melanesia.
- Western Africa
29.082
the middle country, of 16 measured · 16 members
 Mauritania30.221
 Liberia28.257
Highest and lowest reading in Western Africa.
- South-eastern Asia
28.950
the middle country, of 11 measured · 11 members
 Singapore32.291
 Laos26.260
Highest and lowest reading in South-eastern Asia.
- Micronesia
28.908
the middle country, of 7 measured · 7 members
 Kiribati29.077Marshall Islands27.098
Highest and lowest reading in Micronesia.
- Southern Asia
28.875
the middle country, of 9 measured · 9 members
 Afghanistan30.366Nepal25.346
Highest and lowest reading in Southern Asia.
- Eastern Europe
28.777
the middle country, of 10 measured · 10 members
 Czechia30.430Bulgaria27.948
Highest and lowest reading in Eastern Europe.
- Eastern Africa
28.774
the middle country, of 18 measured · 19 members
 Djibouti31.522
 Seychelles27.579
Highest and lowest reading in Eastern Africa.
- Middle Africa
28.562
the middle country, of 9 measured · 9 members
 DR Congo30.073Equatorial Guinea27.049
Highest and lowest reading in Middle Africa.
- Caribbean
28.367
the middle country, of 24 measured · 24 members
 Saint Martin30.830
 Cuba26.216
Highest and lowest reading in Caribbean.
- Southern Africa
28.298
the middle country, of 5 measured · 5 members
 Namibia28.943
 Eswatini27.891
Highest and lowest reading in Southern Africa.
- South America
27.978
the middle country, of 12 measured · 12 members
 Chile31.193
 Venezuela26.292
Highest and lowest reading in South America.
- Central Asia
27.818
the middle country, of 5 measured · 5 members
 Kazakhstan28.956
 Tajikistan26.523
Highest and lowest reading in Central Asia.
- Central America
27.205
the middle country, of 8 measured · 8 members
 Costa Rica28.201Nicaragua25.969
Highest and lowest reading in Central America.
- Australia and New Zealand
2 of 2 measured — too few for a middle: Australia, New Zealand.
Australia31.391 New Zealand30.639
Highest and lowest reading in Australia and New Zealand.
- Northern America
4 of 4 measured — too few for a middle: Bermuda, Canada, Greenland, United States.
Bermuda32.103 Greenland27.922
Highest and lowest reading in Northern America.
03The whole field at once
The spread
222 countries, one dot each, on one scale — further right is a higher value. Half the countries are above 29.079; a quarter are above 30.378, and a quarter below 28.258. The bar in each row marks that continent’s middle country.
04All 222 ever measured
Every country
In order, highest value first. No rank or position is shown: too many countries share the same value for an order to mean anything. Neither end is better. A young average can mean early marriage, or simply that women stop having children early; an older one can mean late first births, or that many women keep having children into their forties. Because every birth counts, this is not the age at which women first become mothers.
Showing 25 of 222 countries


































































































































Values for 2023. The change column compares 2023 with 2022 only; the sparkline covers the recent editions.
051950–2023 · 74 reference years
Over time
Each point is one year's estimate, 1950 to 2023, as restated by the 2024 revision. In many countries the line first falls, as large families become smaller and births late in life become rarer, and then rises as women start their families later.
- the middle country
- the middle half of countries
- the middle of the 222 countries measured every time
- each continent’s middle country
The same, year by year
| Year | Countries | Middle country | Middle half | Measured every time |
|---|---|---|---|---|
| 2023 | 222 | 29.079 | 28.258 – 30.378 | 29.079 |
| 2022 | 222 | 29.109 | 28.288 – 30.371 | 29.109 |
| 2021 | 222 | 29.091 | 28.255 – 30.387 | 29.091 |
| 2020 | 222 | 29.023 | 28.246 – 30.277 | 29.023 |
| 2019 | 222 | 29.001 | 28.196 – 30.230 | 29.001 |
| 2018 | 222 | 28.996 | 28.175 – 30.174 | 28.996 |
| 2017 | 222 | 28.964 | 28.147 – 30.216 | 28.964 |
| 2016 | 222 | 28.975 | 28.145 – 30.107 | 28.975 |
| 2015 | 222 | 28.942 | 28.061 – 30.053 | 28.942 |
| 2014 | 222 | 28.947 | 27.996 – 30.019 | 28.947 |
| 2013 | 222 | 28.914 | 27.895 – 29.967 | 28.914 |
| 2012 | 222 | 28.907 | 27.821 – 29.903 | 28.907 |
| 2011 | 222 | 28.855 | 27.818 – 29.854 | 28.855 |
| 2010 | 222 | 28.831 | 27.831 – 29.845 | 28.831 |
| 2009 | 222 | 28.868 | 27.814 – 29.868 | 28.868 |
| 2008 | 222 | 28.849 | 27.771 – 29.807 | 28.849 |
| 2007 | 222 | 28.832 | 27.671 – 29.801 | 28.832 |
| 2006 | 222 | 28.835 | 27.669 – 29.766 | 28.835 |
| 2005 | 222 | 28.836 | 27.642 – 29.710 | 28.836 |
| 2004 | 222 | 28.807 | 27.621 – 29.702 | 28.807 |
| 2003 | 222 | 28.778 | 27.571 – 29.634 | 28.778 |
| 2002 | 222 | 28.774 | 27.480 – 29.569 | 28.774 |
| 2001 | 222 | 28.751 | 27.409 – 29.577 | 28.751 |
| 2000 | 222 | 28.730 | 27.354 – 29.583 | 28.730 |
| 1999 | 222 | 28.661 | 27.324 – 29.563 | 28.661 |
| 1998 | 222 | 28.592 | 27.298 – 29.577 | 28.592 |
| 1997 | 222 | 28.609 | 27.266 – 29.533 | 28.609 |
| 1996 | 222 | 28.595 | 27.211 – 29.542 | 28.595 |
| 1995 | 222 | 28.618 | 27.092 – 29.563 | 28.618 |
| 1994 | 222 | 28.627 | 27.126 – 29.491 | 28.627 |
| 1993 | 222 | 28.575 | 27.138 – 29.444 | 28.575 |
| 1992 | 222 | 28.555 | 27.051 – 29.421 | 28.555 |
| 1991 | 222 | 28.592 | 27.096 – 29.414 | 28.592 |
| 1990 | 222 | 28.595 | 27.154 – 29.413 | 28.595 |
| 1989 | 222 | 28.613 | 27.168 – 29.458 | 28.613 |
| 1988 | 222 | 28.553 | 27.145 – 29.429 | 28.553 |
| 1987 | 222 | 28.529 | 27.225 – 29.506 | 28.529 |
| 1986 | 222 | 28.515 | 27.202 – 29.498 | 28.515 |
| 1985 | 222 | 28.474 | 27.191 – 29.504 | 28.474 |
| 1984 | 222 | 28.431 | 27.207 – 29.480 | 28.431 |
| 1983 | 222 | 28.379 | 27.172 – 29.528 | 28.379 |
| 1982 | 222 | 28.337 | 27.134 – 29.564 | 28.337 |
| 1981 | 222 | 28.282 | 27.171 – 29.565 | 28.282 |
| 1980 | 222 | 28.316 | 27.152 – 29.590 | 28.316 |
| 1979 | 222 | 28.295 | 27.251 – 29.586 | 28.295 |
| 1978 | 222 | 28.403 | 27.220 – 29.573 | 28.403 |
| 1977 | 222 | 28.449 | 27.289 – 29.548 | 28.449 |
| 1976 | 222 | 28.476 | 27.359 – 29.518 | 28.476 |
| 1975 | 222 | 28.517 | 27.404 – 29.538 | 28.517 |
| 1974 | 222 | 28.570 | 27.486 – 29.528 | 28.570 |
| 1973 | 222 | 28.617 | 27.572 – 29.548 | 28.617 |
| 1972 | 222 | 28.697 | 27.652 – 29.604 | 28.697 |
| 1971 | 222 | 28.728 | 27.735 – 29.651 | 28.728 |
| 1970 | 222 | 28.771 | 27.802 – 29.657 | 28.771 |
| 1969 | 222 | 28.762 | 27.871 – 29.653 | 28.762 |
| 1968 | 222 | 28.782 | 27.911 – 29.654 | 28.782 |
| 1967 | 222 | 28.809 | 27.981 – 29.646 | 28.809 |
| 1966 | 222 | 28.838 | 28.007 – 29.660 | 28.838 |
| 1965 | 222 | 28.874 | 28.005 – 29.659 | 28.874 |
| 1964 | 222 | 28.935 | 28.076 – 29.662 | 28.935 |
| 1963 | 222 | 28.936 | 28.128 – 29.656 | 28.936 |
| 1962 | 222 | 28.946 | 28.132 – 29.638 | 28.946 |
| 1961 | 222 | 28.968 | 28.101 – 29.675 | 28.968 |
| 1960 | 222 | 28.985 | 28.101 – 29.668 | 28.985 |
| 1959 | 222 | 28.989 | 28.164 – 29.704 | 28.989 |
| 1958 | 222 | 29.030 | 28.214 – 29.665 | 29.030 |
| 1957 | 222 | 29.019 | 28.269 – 29.691 | 29.019 |
| 1956 | 222 | 29.015 | 28.283 – 29.755 | 29.015 |
| 1955 | 222 | 29.075 | 28.276 – 29.758 | 29.075 |
| 1954 | 222 | 29.117 | 28.275 – 29.776 | 29.117 |
| 1953 | 222 | 29.126 | 28.363 – 29.829 | 29.126 |
| 1952 | 222 | 29.182 | 28.355 – 29.821 | 29.182 |
| 1951 | 222 | 29.204 | 28.370 – 29.843 | 29.204 |
| 1950 | 222 | 29.196 | 28.386 – 29.859 | 29.196 |
062022 → 2023
Who rose and fell
The biggest changes in value between the two newest editions — reference years recalculated in one report, not two separate publications. Places are shown second, because they also move when other countries do.
Rose most
before → after- South Korea33.297 → 33.424+0.127
- Chile31.093 → 31.193+0.100
 France31.484 → 31.580+0.096
- North Macedonia28.929 → 28.999+0.070
 Montserrat29.881 → 29.947+0.066
Fell most
before → after British Virgin Islands28.587 → 28.479−0.108
 Timor-Leste29.498 → 29.409−0.089
 South Sudan28.685 → 28.605−0.080
 Vatican City31.326 → 31.262−0.064
 Guinea-Bissau29.528 → 29.468−0.060
222 countries were measured in both 2022 and 2023.
07Across every edition
Mean age at childbearing in records
The extremes of the statistic. A record reached by more than one country names none of them.
Highest reading on record
33.424
Mean age of mothers at the birth of their children (years)
Lowest reading on record
23.693
Mean age of mothers at the birth of their children (years)
Biggest rise between editions
+1.019
29.992 → 31.011
Biggest fall between editions
−0.997
29.009 → 28.012
Biggest change since first measured
+5.331
26.772 → 32.103
Highest most often
40 of 74
editions, alone at the first-listed end
08The measure
About mean age at childbearing
The mean age at childbearing is the average age of mothers when their children are born, counting every birth, not only the first. It moves as women spend longer in education and work, as contraception spreads and as families get smaller, which makes it one of the plainest measures of how the timing of family life has changed.
What the number is: Mean age of mothers at the birth of their children (years).
09Where it fits
Connections
Its part in the Country Index, the statistics whose values line up most closely with it across countries, and others on the same subject.
In the Country Index
Context, with no vote
This statistic is published in full under People & Population, but does not help decide any Country Index standing.
Moves with
Where mean age at childbearing is higher, these tend to be higher too.
- Research and Development SpendingUIS · 84 countries in commonρ 0.68
- Anthropic AI Usage IndexAnthropic · 121 countries in commonρ 0.67
- Researchers per Million InhabitantsUIS · 127 countries in commonρ 0.65
Moves against
Where mean age at childbearing is higher, these tend to be lower.
- Adolescent Birth Rate (Ages 15–19)UN DESA Population Division · 222 countries in commonρ −0.69
- Learning PovertyWorld Bank Group and UNESCO Institute for Statistics · 108 countries in commonρ −0.65
- Youth Not in Education, Employment or TrainingILO · 97 countries in commonρ −0.63
Rank correlation (ρ, from −1 to 1) across countries, on each statistic’s newest edition, out of 386 statistics sharing at least 80 countries with this one. Two statistics that move together do not cause each other.
10Keep reading
Explore further
The subject
The countries at either end
11Questions
Mean age at childbearing: questions and answers
Which country has the highest mean age at childbearing?
South Korea, at 33.424, among the 222 countries compared in 2023.
Which country has the lowest mean age at childbearing?
Nepal, at 25.346, among the 222 countries compared in 2023.
How many countries does the Mean Age at Childbearing cover?
222 in 2023.
What is the world average mean age at childbearing?
This site does not calculate a world average, which would depend on how countries are weighted. In the middle country of the 222 compared in 2023, the figure was 29.079.
Is this UN DESA Population Division’s own ranking?
No ranking is shown. UN DESA Population Division publishes values only, and too many countries share the same value for an ordering to mean anything, so none is derived.
How often is the Mean Age at Childbearing published?
This site holds 74 reference years, 1950–2023, all recalculated in UN DESA Population Division’s 2024 report on one method — not 74 separate publications.
Where does the data come from, and can I download it?
From UN DESA Population Division, under CC BY 3.0 IGO. From World Population Prospects 2024, read from the Population Division's own demographic-indicators download, the same file as the fertility rate. Projections are excluded. Every edition is on this site’s Datasets pages as a full table, and downloads as a CSV file with every value unrounded.
12Method
Sources, method and citation
Source
Mean Age at Childbearing — UN DESA Population Division
From World Population Prospects 2024, read from the Population Division's own demographic-indicators download, the same file as the fertility rate. Projections are excluded.
Newest edition
Report year 2023Data year 2023
Cite the source as: United Nations, Department of Economic and Social Affairs, Population Division (2024). World Population Prospects 2024, Online Edition.
Licence: CC BY 3.0 IGO, checked 2026-09-29.
How this page reads the numbers
- No rank or position is shown: UN DESA Population Division publishes values only, and too many countries share the same value for an ordering to mean anything.
- This statistic has no better end, so the page describes higher and lower values and never calls a country a leader.
- A country is named at an end only when it holds that value alone. Where several share it, the page says how many and names none first.
- Values are stored exactly as published and trimmed only for display. “The middle country” is the median of the countries measured, not a world average.
The file itself, column by column — where it came from, what each column holds, and every edition as a CSV — is on its dataset page.
Cite this page
Nations Inquiry (2026). Mean age at childbearing by country: Mean Age at Childbearing, data from UN DESA Population Division. https://nationsinquiry.com/statistics/mean-age-childbearing